 Longwei Zhang
 Chao Wang
 Yu Chen
95% of researchers rate our articles as excellent or good
Learn more about the work of our research integrity team to safeguard the quality of each article we publish.
Find out more
ORIGINAL RESEARCH article
Front. Energy Res. , 03 November 2021
Sec. Sustainable Energy Systems
Volume 9 - 2021 | https://doi.org/10.3389/fenrg.2021.744974
This article is part of the Research Topic Future Energy Systems for Building Clusters and Districts View all 8 articles
Large-space buildings feature a sizable interface for receiving solar radiation, and optimizing their shape in the early design stage can effectively increase their solar energy harvest while considering both energy efficiency and space utilization. A large-space building shape optimization method was developed based on the “modeling-calculation-optimization” process to transform the “black box” mode in traditional design into a “white box” mode. First, a two-level node control system containing core space variables and envelope variables is employed to construct a parametric model of the shape of a large-space building. Second, three key indicators, i.e., annual solar radiation, surface coefficient, and space efficiency, are used to representatively quantify the performance in terms of sunlight capture, energy efficiency, and space utilization. Finally, a multi-objective genetic algorithm is applied to iteratively optimize the building shape, and the Pareto Frontier formed by the optimization results provides the designer with sufficient alternatives and can be used to assess the performance of different shapes. Further comparative analysis of the optimization results can reveal the typical shape characteristics of the optimized solutions and potentially determine the key variables affecting building performance. In a case study of six large-space buildings with typical shapes, the solar radiation of the optimized building shape solutions was 13.58–39.74% higher than that of reference buildings 1 and 3; compared with reference buildings 2 and 4, the optimized solutions also achieved an optimal balance of the three key indicators. The results show that the optimization method can effectively improve the comprehensive performance of buildings.
Due to climate change and a shortage of fossil fuels, clean energy, particularly solar energy, is increasingly used in buildings. Today, a major direction of sustainable building is designing buildings to obtain abundant solar energy, which can be converted into electricity or heat (Baljit et al., 2016; Barone et al., 2020; Liu et al., 2021; Maghrabie et al., 2021; Yu et al., 2021). Large-space buildings are of high research value thanks to their inherent advantages in capturing solar energy.
Large-space buildings usually refer to buildings with interior heights greater than 10 m that are partially used by occupants, including exhibition halls, stadiums, theaters, commercial buildings, terminals, and railway stations (Heiselberg et al., 1998; Rohdin and Moshfegh, 2007; Li et al., 2009; Gil-Lopez et al., 2017; Liu et al., 2018; Liu et al., 2020). Large-space buildings generally entail high costs and immense energy consumption, but they have great potential for capturing solar energy. First, the enormous roof areas of these buildings are natural interfaces for receiving solar radiation and can collect a large amount of solar energy. Second, large-space buildings usually have smooth shapes that do not change abruptly; therefore, solar irradiation is evenly distributed on the building surface, which reduces the potential for self-shading (Zhang et al., 2012). Third, large-space buildings are typically surrounded by open space and are not easily blocked by other buildings, ensuring the duration and quality of solar irradiation at the irradiated interface. Therefore, an effective approach for enhancing the sustainable performance and ecological value of large-space buildings is to improve their ability to collect sunlight by taking full advantage of these characteristics through building design (Ratti et al., 2005).
Shape is an important factor that affects the ability of a building to capture sunlight. A suitable shape can efficiently receive solar energy through a reasonable solar interface, creating conditions for enhancing the photovoltaic power generation potential and natural lighting. The prototype of a building shape is usually formed in the early design stage, during which shape optimization with the goal of receiving solar energy can enhance the solar gain potential of the building, creating favorable conditions for subsequent designs and maximizing the optimization and economic effects (Nault et al., 2015; Harter et al., 2020).
The early building design stage, which determines the direction of the design, is a process in which the designer generates an initial building concept based on the design task by comprehensively considering design conditions and performance objectives and incorporating subjective intention (Negendahl, 2015; Singh et al., 2020). This stage consists of three tasks: 1) generating as many alternative concepts as possible as potential options, 2) evaluating various aspects of the performance of the concepts using quantifiable indicators, and 3) continuously selecting and iteratively optimizing the concepts to make progressive improvements (Ascione et al., 2015). This process ensures that concepts with better performance enter the subsequent detailed design stage (Negendahl and Nielsen, 2015). The process described above is a “black box” in terms of traditional design models: the information is input into the mind of the designer to generate and select building concepts, and the design result is output directly (Harding et al., 2012), as shown in Figure 1. This process is highly dependent on the intuition and experience of the designer, neglects quantitative analyses of various measures of the building performance, and involves only a small number of concept iterations, making it difficult to ensure the feasibility and validity of the output result. In this work, we attempt to improve this process by (1) studying large-space buildings to clarify the roles of design requirements, performance objectives, and designer intentions in determining building shapes; 2) constructing a cycle that includes steps such as “performance simulation”, “shape optimization” and quantitative analysis (Yi and Malkawi, 2012); and, as a result, 3) transforming the uncontrollable “black box” into a “white box” with transparent, quantifiable, and easy-to-manipulate information, thereby ensuring that a large-space building shape with excellent performance is obtained in the early design stage (Hopfe and Hensen, 2011), as illustrated in Figure 2.
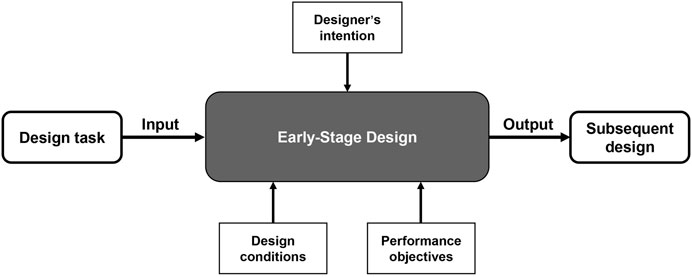
FIGURE 1. The traditional black box design model.

FIGURE 2. The “white box” design model.
In the literature, the main research object of energy efficiency optimization studies of existing buildings is mainly residential buildings (up to 48%); other types of buildings such as commercial, educational and historical buildings also account for a considerable proportion (Hashempour et al., 2020), but research on large-space buildings is very limited. Optimization targets primarily include minimizing energy consumption (Ascione et al., 2015; Negendahl and Nielsen, 2015; Feng et al., 2021; Lin et al., 2021) or cold/hot loads (Raphael, 2011; Xu et al., 2015), reducing costs (Evins et al., 2012; Ihm and Krarti, 2013; Junghans and Darde, 2015) and carbon emissions (McKinstray et al., 2015; Trinh et al., 2021). Other diversification goals include maximizing thermal comfort (Yu et al., 2015; Li et al., 2021), maximizing lighting quality (Karatas and El-Rayes, 2015), improving air quality (Carlucci et al., 2015), and achieving visual comfort (Ochoa et al., 2012) and aesthetics (Yi, 2019). Research on space use is limited. Optimization variables can be divided into three categories: the performance and construction of the envelope enclosure (Murray et al., 2014; Shao et al., 2014; Kim and Clayton, 2020; Xu et al., 2021), the selection and operation of mechanical systems (Han et al., 2013; Penna et al., 2015) and the building shape. Because it is difficult to describe a single variable, the relevant research always uses the shape type (Tuhus-Dubrow and Krarti, 2010; Bichiou and Krarti, 2011; Ciardiello et al., 2020), orientation (Nguyen and Reiter, 2014; Xu et al., 2015; Yu et al., 2015) and aspect ratio (Ramallo-González and Coley, 2014; Xu et al., 2015) as variables; however, Yi et al. pointed out that most studies are limited to simple geometries, and complex forms can be explored through their proposed hierarchical node control method (Yi and Malkawi, 2009), which provides the basis for the parameterized node-based model in this paper. Based on existing research, the contributions of the present study include selecting large-space buildings as the object, improving the energy efficiency of building by optimizing the form, and taking the use of space into account.
In this work, solar radiation gain is taken as the primary objective for the shape optimization of large-space buildings, because the active use of solar energy as a clean energy source can effectively alleviate the problem of high energy consumption in large-space buildings. First, such buildings have large and relatively flat roofs that can be used as an excellent solar collector. In addition, these roofs have access to adequate sunlight, and photothermal and photovoltaic technology can be used to convert solar energy into thermal energy or electricity for direct use in buildings. Second, sufficient sunlight creates good conditions for natural lighting, and reasonable lighting port designs can effectively reduce the lighting energy consumption of buildings, which is an important part of building energy consumption. China’s five primary solar radiation zone systems, established by Jiang etc. in 2021, show that, with the exception of the relatively low resource potential of Area V (mainly in Sichuan Basin), most regions of China have good solar energy potential, and it is feasible to collect solar energy through buildings (Jiang et al., 2021).
In addition, the energy performance and space utilization of buildings must also be considered in the building shape design (Kämpf et al., 2010; Tronchin et al., 2016; Talaei et al., 2021). Energy performance requires building shape to be adapted to the climate and avoid excessive heat exchange between the building and the external environment, and space utilization demands that the building meet the functional requirements and, on this basis, minimize the waste of space. Although it is ideal to achieve the above three objectives simultaneously, they often conflict with one another in actual design practice and are thus difficult to achieve simultaneously, which is a problem that is especially prominent in large-space buildings with a large number of free forms. Increasing solar energy acquisition and expanding the solar interface of a building may cause excessive energy loss due to increases in the external surface of the building and result in wasted space. Tightening a building to save energy may lead to limited access to sunlight or space use constraints, so these three objectives must be balanced. In addition to the objectives described above, secondary indicators such as the area, space volume, and height of a building are also considered by the designer and need to be controlled in the design. Therefore, the issues that need to be considered in the shape optimization of large-space buildings in the early design stage are quite complex and require a high efficiency in the generation, selection, and iteration of concepts.
In this study, we propose a multi-objective genetic algorithm (MOGA)-based method for the shape optimization of large-space buildings. This method can quickly generate a large number of different shape concepts, automatically quantify and analyze the solar gain, energy performance, and space utilization of each concept, select concepts with better performance, further improve their performance through iteration, and ultimately output and visualize the optimization results to provide a basis for the selection of the final concept by the designer (Raphael, 2011).
The method is based on the “Modeling-Calculation-Optimization” process and includes three steps, as shown in Figure 3. First, a parametric shape model defined by the “core space” is constructed considering the large-space building characteristics. Second, by weighing the speed and accuracy requirements in the early design stage, solar radiation gain, energy performance, and space utilization are set as key indicators (Chang et al., 2019), and the corresponding calculation modules are developed to analyze the three key aspects of performance quickly and quantitatively. Finally, the MOGA (Wright et al., 2002; Wang et al., 2005a; Wang et al., 2005b; Zhu et al., 2020) and the Pareto Frontier are applied to achieve multi-performance optimization and visualize the results of the early concepts (Tuhus-Dubrow and Krarti, 2010; Yi, 2019).
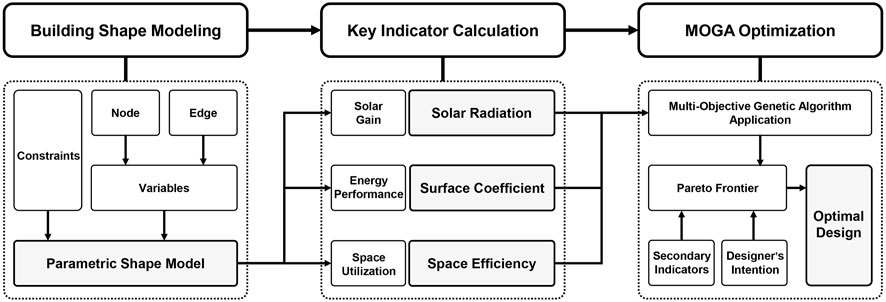
FIGURE 3. The “Modeling-Calculation-Optimization” process.
In the early design stage, building shape modeling should not be overly limited to details such as the window form, material, and color but should use variables that are as simple as possible to enable the building shape to transform freely within the constraints to explore a greater number of shape possibilities and thereby provide the designer with a broader range of choices (Ourghi et al., 2007). Parametric shape modeling includes three steps:
1) Analysis of design requirements. In the early design stage, the geographic location, site environment, and climatic conditions of the building should be considered in detail to lay the foundation and precondition for the subsequent steps.
2) Definition of shape variables. The variables in this study specifically refer to the independent variables that control the generation of the building shape (Wang et al., 2006). The designer can adjust the input values to change the building shape. In previous studies, architectural variables such as the orientation, area, story height, and story number have been used to control the shape, and the pattern of shape change has been limited by the types of variables. To exercise a sufficient degree of freedom for the shape to change, this study starts with the more essential shape generation rules and uses the shape control nodes (hereafter referred to as nodes) as variables to generate and manipulate the building shape (Jin and Jeong, 2013; Jin and Jeong, 2014).
3) Setting of constraints. Constraints define the range of change in variables and may originate from functional requirements, design requirements, the intentions of the designer, and standard specifications. In this step, the abovementioned conditions need to be concretized into numerical constraints on node variables, which are specifically expressed as the movable range of nodes in three-dimensional (3D) space.
The shape variable definition and the constraint setting of the shape model are shown in Figure 4. The building shape can be summarized as a spatial structure formed by a number of nodes connected to each other in a specific order. This structure expresses the generation rules and evolution pattern of the shape, and changing the position of the nodes alters the shape accordingly, thus controlling the change in shape (Negendahl, 2014). As shown in Figure 4A, the displacement of a node along any direction can be decomposed into movements along the X-, Y-, and Z-axes, as Ax, Ay and Az, respectively. Therefore, a freely movable node needs to be expressed by three variables, but when the movement of the node along an axis is constrained, the number of variables decreases. For example, in Figure 4B, node A is located in the XY-plane and cannot move along the Z-axis, so its displacement is determined by the X and Y variables only; node A in Figure 4C follows node B along the Y-axis, so its position can be described by the X and Z variables only; and the movement of node A in Figure 4D depends on node B completely, so it has the same variables as node B, i.e., no new variables are needed to describe its displacement.
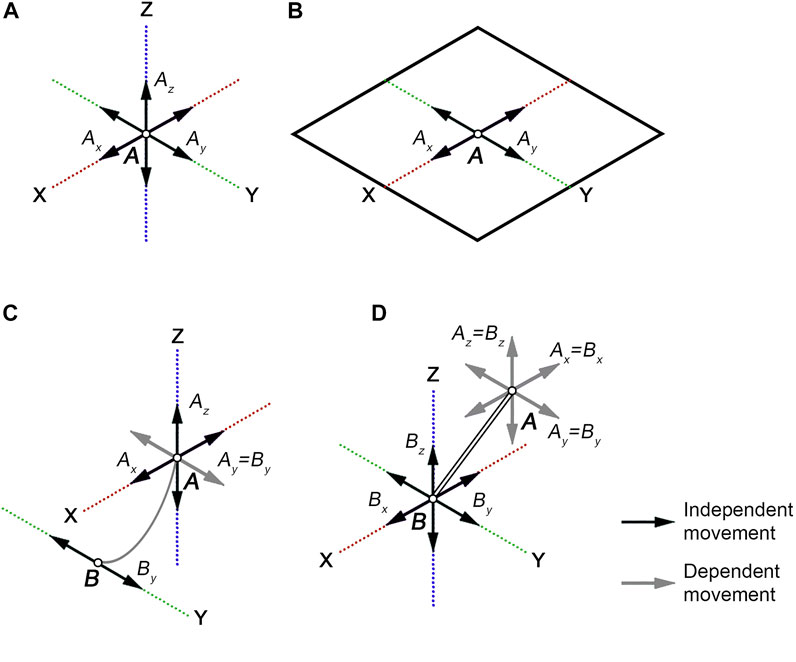
FIGURE 4. The number of node variables changes under the constraint: (A) Independent movement of node A; (B) Node A in XY-plane cannot move along the Z-axis; (C) Node A follows node B along the Y-axis; (D) Movement of Node A depends on node B completely in 3 dimensions.
The building shape model with nodes as variables features the following advantages: 1) the shape can be accurately manipulated by nodal displacements, which is especially suitable for generating and controlling nonlinear shapes; 2) the degree of freedom of shape change can be altered by imposing constraints on the nodes, and the change interval of the shape can be controlled as needed; and 3) the variables are all nodal displacements, which are of the same type, share the same units, and can be concisely expressed and easily calculated.
The shape of a large-space building is defined by its inner core space and outer envelope enclosure. The core space is the space within the building that assumes the main use function, and its size and shape are determined by the building function, not necessarily with clear physical boundaries. The envelope enclosure is the outer interface of the building (Oral and Yilmaz, 2002) and can be understood as a “skin layer” that wraps around the core space, with its form determined and influenced by the core space. Therefore, the shape model of a large-space building is actually a two-level node control system, in which the nodes constituting the core space are called core nodes and their spatial positions are described by core variables, while the nodes constituting the envelope enclosure are called envelope nodes and are described by envelope variables, which are defined and constrained by core variables and change with them.
In the early design stage, the objectives of the solar gain, energy performance, and space utilization of the shape of a large-space building are selected according to two principles: first, they are representative and capable of summarizing and describing the corresponding building performance in a general and accurate manner; second, they enable a high computational efficiency, do not require a large consumption of time or computational resources, and satisfy the need for performance analysis of a large number of concepts in the early design stage.
The solar gain of a building can be characterized by the annual solar radiation gain at the surface of the building (Angelis-Dimakis et al., 2011), and its data can be obtained through solar radiation simulations (Perez et al., 1990). To ensure the accuracy and efficiency of the simulation, the Ladybug tool, based on the Grasshopper platform, was used in this study to calculate the solar radiation gain (Roudsari and Pak, 2013). Ladybug simulates solar radiation using a Climate-Based Daylight Modeling (CBDM) method, which extracts area-specific meteorological data from EnergyPlus weather files (.epw) as the basis for the simulation. The solar radiation function in Ladybug uses the cumulative sky approach to calculate the amount of radiation for the Tregenza sky dome (Robinson and Stone, 2004). The total solar radiation incident on the test model and the amount at each test point on the surfaces are accumulated, and the results are displayed on a multicolor user interface. This method has proven reliable in many studies (Yi and Kim, 2015; Freitas et al., 2020; Kharvari, 2020).
In general, energy consumption must be simulated to measure the energy efficiency of a building. However, high-precision annual simulations not only consume large amounts of time and computational resources but also require detailed and accurate simulation parameters, which are difficult to determine in the early design stage. Therefore, an effective research approach is to select indicators that show significant correlations between the building shape and energy consumption (Jedrzejuk and Marks, 2002). Relevant studies have used a variety of indicators such as the shape coefficient (Menezo et al., 2001), the building corresponding area coefficient (Zhao and Hu, 2012), and the thermal shape coefficient (Lin and Li, 2016). Based on the latest research results, the surface coefficient was used as the core indicator in this study (Wang et al., 2020). The surface coefficient is defined as the ratio of the exterior surface area of the building in contact with the air to the building area; that is,
where SC is the surface coefficient, F0 is the exterior surface area of the building, and S is the bottom surface area of the building. These two values can be obtained directly from a parametric model. Studies have shown that the dimensionless surface coefficient has a significant linear relationship with the energy consumption per unit area of the building and can accurately reflect the correlation between the building shape and energy consumption.
Inappropriate height, location, and shape values for a building can lead to inefficient space utilization, resulting in a waste of space and additional energy and material consumption (Coakley et al., 2014). In our previous study (Zhang et al., 2016), the concept of space efficiency (SE) was proposed to measure the extent of utilization of the interior space of a building:
where E is the space efficiency, Vu is the volume of available space, and V0 is the total volume of the interior space of the building. Large-space buildings are characterized by zoning use and time-sharing operation, and the extent of use of each space zone varies significantly over time. Therefore, the utilization rate is introduced to modify Eq. 2. The utilization rate refers to the percentage of time in hours that a specific space region is put into use relative to the total operating time of the building throughout the year. The utilization rate is 100% for the space region that is put into use during the entire operation period of the building, 0% for the space region that is never used, 50% for the space region that is used for half of the operation period, and so on. Then, SE can be written as
where n is the number of zones in the large space, i is the zoning ID, and ri is the utilization rate of the ith zone. These values can all be calculated using a parametric model.
Shape optimization can be divided into two steps. The first step is to find the optimized shapes that perform well with respect to the three objectives and gather them into an optimized solution set. The second step is to sort the shapes in the optimized solution set according to their performances and visualize them to provide a basis for the designer to select the final solution to be implemented. The objective function of shape optimization can be written as follows:
where
Optimization problems are generally expressed as minimum value problems. Therefore, the purpose of shape optimization is to find the solutions that achieve the minimum values of the three objectives.
A variety of optimization algorithms, such as the genetic algorithm (GA) (Ouarghi and Krarti, 2006), the sensitivity vector algorithm (SVA) (Wang and Zhao, 2021), and the Manta Ray Foraging Optimization algorithm (MRFOA) (Feng et al., 2021), have been used for building shape optimization. In this study, the Pareto optimization method was used for shape optimization. This method balances multiple objectives by finding nondominated solutions, also known as Pareto solutions. These solutions are not dominated by other solutions in the solution space. The set of nondominated solutions is called the Pareto Frontier, and each optimized solution has a particular performance benefit and achieves a certain optimal tradeoff among the multiple objectives. This method is particularly suitable for complex optimization problems such as the one involved in this study.
An optimization tool called Octopus, a Grasshopper plug-in, was used to carry out the optimization. Octopus is a MOGA tool based on the principle of evolution and can achieve the optimal tradeoff of multiple optimization objectives through a multi-objective optimization process. Octopus generates the set of optimized solutions for each generation in the form of a Pareto Frontier and displays the form and key indicator information of each solution to monitor and control the optimization process. In addition, Octopus can record various types of secondary indicator information of the solution to provide a basis for the designer to choose the final optimization solution.
To verify this method, a large-space exhibition hall in Shenyang, China, is used as a case study in this work. Shenyang is in a cold region of China and is a typical winter city. The building design considers the reception of sufficient sunlight and minimization of the exterior surface area of the building to reduce energy consumption as important sustainable design goals. Climate information for Shenyang is available from the website (https://www.energyplus.net/weather).
The exhibition hall is arranged in the north-south direction and has the following design requirements: 1) the large core space with an exhibition function has the basic size of 120 m × 90 m × 14 m and a variable planar form with a total area of not less than 10,800 m2; 2) the total building height is not less than 14 m and not greater than 24 m; and 3) in addition to the core space, there is a 10-m space at both the north and south sides of the building for shape adjustment. These design requirements can be converted into constraints on shape variables. The actual utilization of the building space requires field observation. Since this work aims to verify the feasibility of the method, the problem is simplified by assuming the utilization rate of each space zone based on the height and location. According to the standard requirement for the height of an exhibition hall space, as shown in the section view in Figure 5, it is assumed that a space with a clear height of 12 m (e.g., zone A) can be fully utilized (i.e., utilization rate = 100%), a space with a clear height greater than 12 m and less than or equal to 20 m (e.g., zone D) has a utilization rate of 50%, and a space with a clear height greater than 2.1 m but less than 12 m (e.g., zone B or C) is available 70% of the time (i.e., utilization rate = 70%). A space with a clear height that does not meet the use requirements, i.e., less than 2.1 m (e.g., zone E), greater than 20 m (e.g., zone G), or with a shape that does not meet the use requirements (e.g., zone F, which has a roof area larger than the corresponding floor area), has a utilization rate of 0.
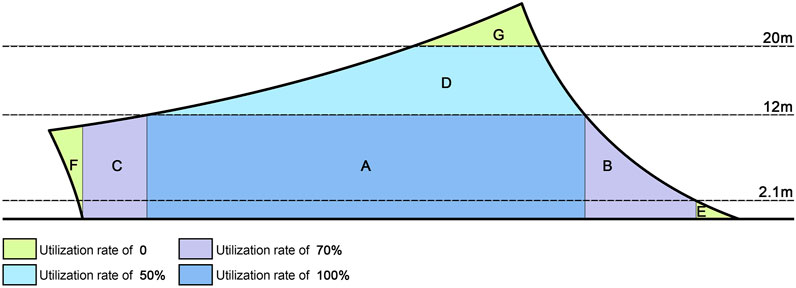
FIGURE 5. The number of node variable changes under the constraint.
According to the design requirements, the core space is initially box-shaped with a length of 120 m, a width of 90 m, and a height of 14 m, as shown in Figure 6. The bottom nodes and top nodes are labeled clockwise as A-D and E-H, respectively, with edges BC, AD, AB, and CD facing south, north, east, and west, respectively. Since the height of the space remains constant at 14 m, nodes E-H can only move along the horizontal direction, and hence, the change in the core space is reflected in the change in the form of plane. In this work, two planar forms commonly used in exhibition halls—rectangular plane and convex quadrilateral plane—are selected for comparative study.
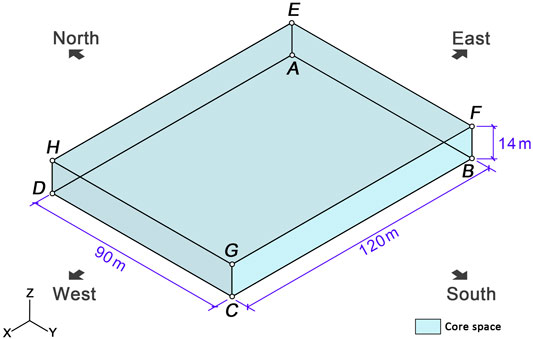
FIGURE 6. The core space and its variable information.
In the rectangular plane shown in Figure 7A, the three adjacent edges that pass through any node are perpendicular to each other. Node A is set as the origin (the same below), and node D is allowed to move along the X-axis as node variable Dx. When node D moves, nodes B and C will move with it to ensure that the adjacent edges remain perpendicular to each other under the condition of a constant area. Assuming that D1 and D2 are the endpoints of D moving along the X-axis, when node D moves to D1, the corresponding node C will move to C1, and when node D moves to D2, node C will then move to C2. Therefore, only one variable Dx is needed to control the change in the plane of the core space. In this work, the D1 and D2 directions are set to be positive and negative directions, respectively, and this core space model is denoted as C1.
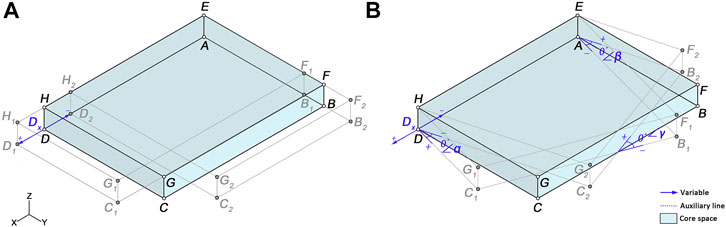
FIGURE 7. Control nodes and variables of the core space: (A) rectangular plane; (B) convex quadrilateral plane.
The case of the convex quadrilateral plane as shown in Figure 7B becomes complex. Since there is no restriction that adjacent edges are perpendicular to each other, three additional variables in addition to Dx are needed to ensure that the planar area remains unchanged when the plane shape changes. In this work, the change in plane shape is controlled by setting the offset angle: 1) the angle between the edge CD and the Y-axis is set as ∠α, with clockwise and counterclockwise rotations being positive and negative, respectively; 2) the angle between the edge AB and the X-axis is set as ∠ β, which is the mirror image of ∠α, with clockwise and counterclockwise rotations being negative and positive, respectively; and 3) the angle between the edge BC and the X-axis as ∠γ, with clockwise and counterclockwise rotations being negative and positive, respectively. This core space model is denoted as C2.
The final shape of the building can be generated by constructing the envelope variable system based on core spaces C1 and C2. The envelope nodes can be regarded as those obtained by moving the core nodes A-H, so the corresponding envelope nodes are set as A1-H1. Since the envelope nodes of the building can only move outside the core space, the displacements of the nodes away from the core space along the X-, Y-, and Z-axes are defined as positive, which can simplify the description and calculation of the shape variables.
In this work, six typical large-space shapes are selected as the optimization alternatives (S1–S6). All nodes in S1–S3 are connected by straight lines and are thus denoted as straight-edge shapes (Figure 8). The nodes on the east and west sides in the middle of S4–S6 are passed through by curves, so these three are curved-edge shapes (Figure 9). These curves are generated using the “interpolate curve” command in Rhinoceros software, with degree and weight set to 3 and 1, respectively, to ensure that there is one and only one curve passing through these nodes. It should be noted that the east and west façades of these six shapes are all perpendicular to the ground for two reasons. First, in building design, traffic space is usually set up on the short-edge side of the exhibition hall or along connections with other exhibition halls, and the vertical façades are conducive to space arrangement. Second, compared to the roof and south façades, changes in angle of the east and west façades have little impact on solar energy capture, and hence, setting the two façades as vertical helps simplify the problem. Details of the six shapes and their variables are as follows.
1) Shape1 (S1) is a box shape, as shown in Figure 8A. It has C1 as the base, and the three adjacent edges passing through any envelope node are perpendicular to each other. As shown in Figure 8B, because the adjacent faces are perpendicular to each other, nodes D, H, and E move together with node A along the Y-axis with the same displacement as Ay; C, F, and G move together with B along the Y-axis with the same displacement as By; and F, G, and H move together with E along the Z-axis with the same displacement as Ez. Thus, the form change of S1 can be controlled by envelope variables Ay, By, and Ez and the core variable Dx.
2) Shape2 (S2) is also based on C1 as is S1, but there is no restriction that adjacent edges are perpendicular to each other. As shown in Figure 8C, nodes A-H can independently move to the corresponding positions A1-H1, and in this case there can be various angles between adjacent edges. Figure 8D shows that nodes A-D can all move freely along the Y-axis as the corresponding variables Ay-Dy; nodes E-H can move freely along the Y-axis and Z-axis, with the corresponding variables denoted as Ey-Hy and Ez-Hz, respectively. In this case, 12 envelope variables and one core variable Dx are required to control the form change of S2.
3) As shown in Figure 8E, Shape3 (S3) is based on C2, and its nodes are similar to those of S2. A-H can move independently to the corresponding positions A1-H1, and there can be a variety of angles between adjacent edges. The envelope variables for S3 shown in Figure 8F are the same as those for S2, and these 12 envelope variables and four core variables of C2, totaling 16 variables, are needed to control the form change of S3.
4) Based on C1, Shape4 (S4) is a curved-edge shape with symmetrical east and west sides and is integrated by the top surface of the building and the north and south façades. The envelope nodes on the east and west sides of the building are symmetrically positioned and each intersected by separate curves with the same trend. To control the building height and the change trend of the curved-edge shape, a ridgeline is set at the roof of the building with two endpoints M1 and N1, which are obtained by moving the midpoint M of the line connecting nodes E1 and F1 and the midpoint N of the line connecting nodes H1 and G1 along the Y- and Z-axes, respectively, as shown in Figure 9A. Using the “interpolate curve” command (with the degree of the curves set to 3 and the weights set to 1, the same below), two curves are obtained by connecting A1, E1, M1, F1, and B1 to D1, H1, N1, G1, and C1, respectively, to generate the building envelope. Regarding envelope variables of S4 shown in Figure 9B, due to the east-west symmetry of the shape, the displacements of nodes C, D, H, G, and N are the same as those of nodes B, A, E, M, and F, respectively, so S4 can be described by eight envelope variables (Ay, By, Ey, Ez, Fy, Fz, My, and Mz) and the core variable Dx.
5) Shape5 (S5) is based on C1 and is a curved-edge shape like S4, except that the east and west sides need not be symmetrical, as shown in Figure 9C. In addition, nodes A-N can each move to any of the positions A1-N1, the number of envelope variables is doubled compared to that of S4. As seen in Figures 9A,D total of 16 envelope variables and one core variable Dx are needed to control the shape change of S5.
6) Shape6 (S6) takes C2 as the core space, as shown in Figure 9E, and nodes A-N each can move to any of the positions A1-N1. Figure 9F shows that S6 has 16 envelope variables, which are the same as those of S5, but its core variables are increased to four, as determined by C2. Therefore, a total of 20 variables are needed to describe its form change.
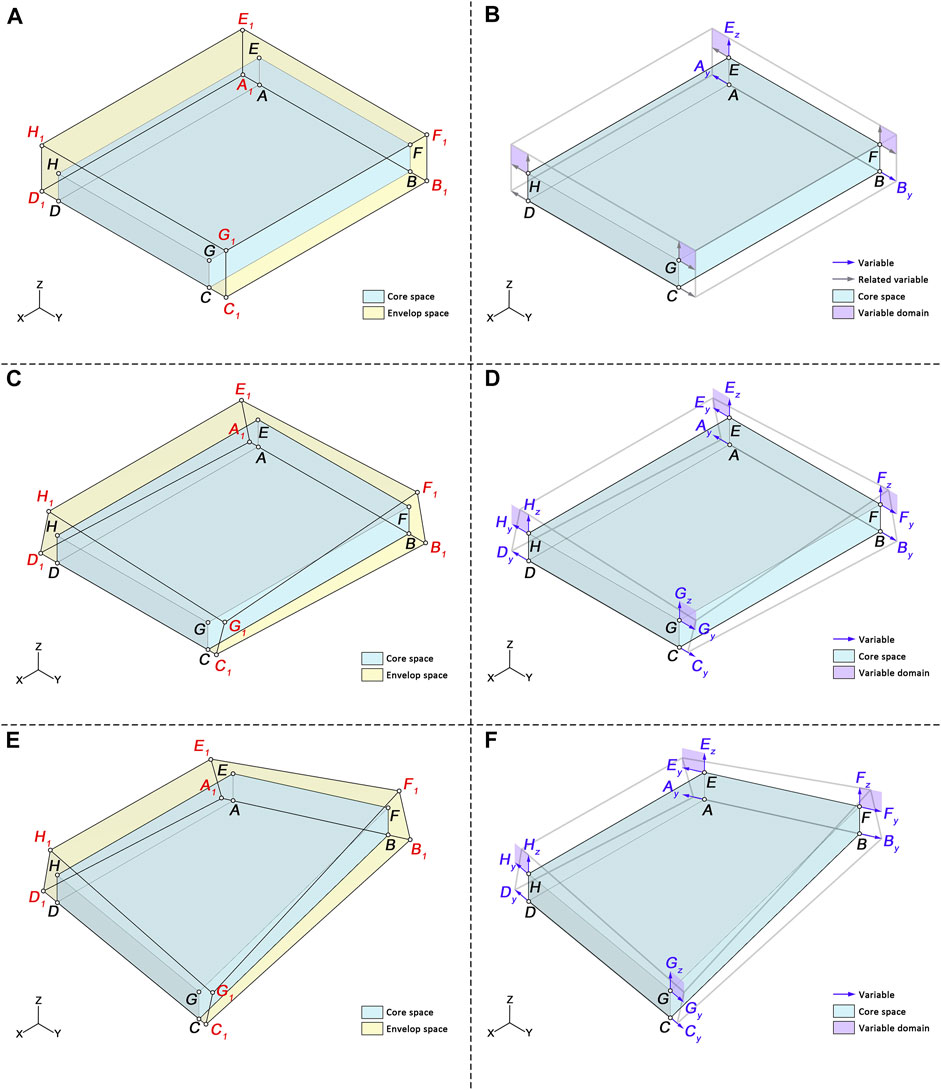
FIGURE 8. Node systems and envelope variables of straight-edge shapes: (A) node systems of S1; (B) envelope variables of S1; (C) node systems of S2; (D) envelope variables of S2; (E) node systems of S3; (F) envelope variables of S3.
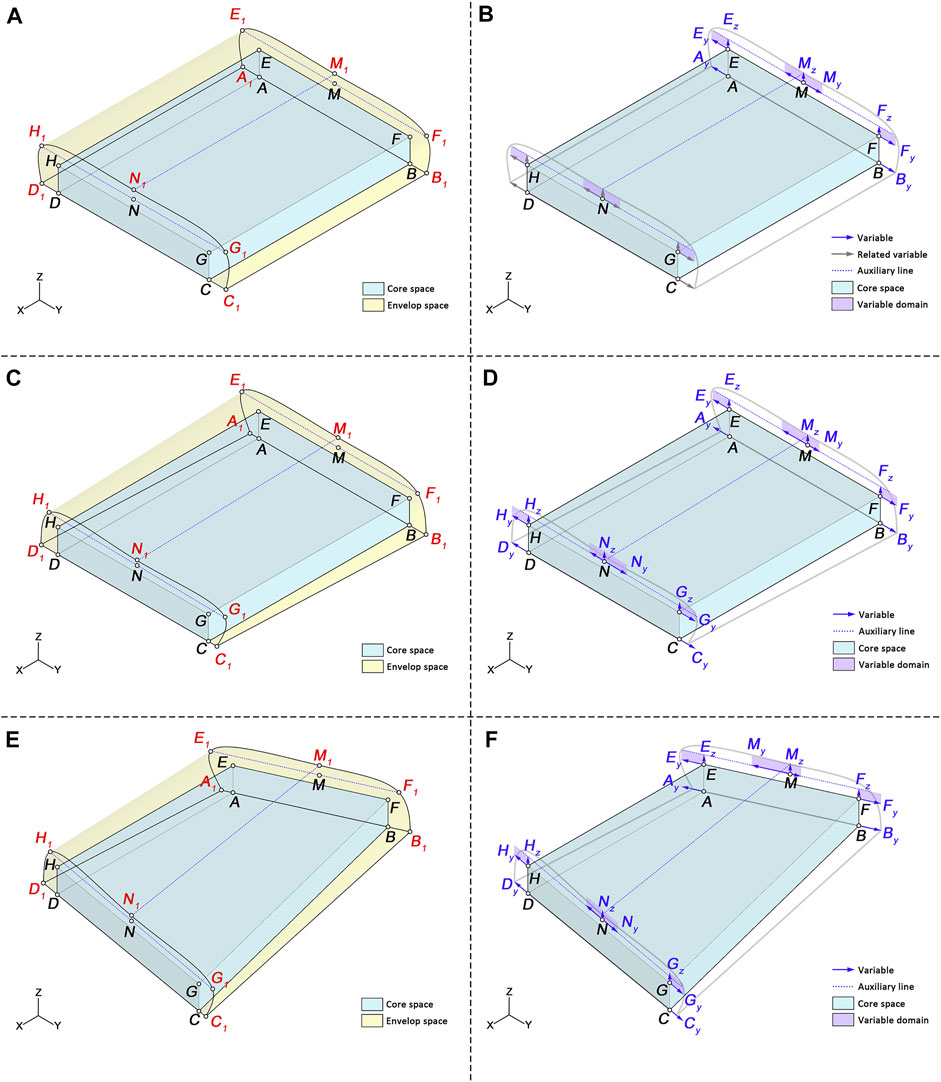
FIGURE 9. Node systems and envelope variables of curved-edge shapes: (A) node systems of S4; (B) envelope variables of S4; (C) node systems of S5; (D) envelope variables of S5; (E) node systems of S6; (F) envelope variables of S6.
The six shapes described above are typical of the shapes commonly used in large-space exhibition halls. These shapes range from simple to complex, with increasing numbers of node variables. The information on the six shapes is summarized in Table 1.
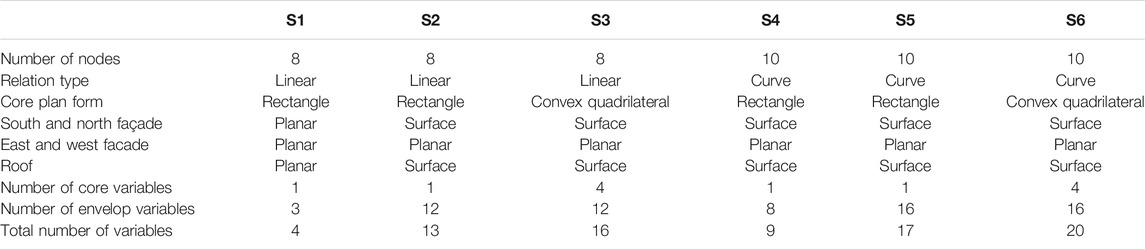
TABLE 1. Summary of the six shapes.
The value range and accuracy of the variables directly affect the complexity of the optimization. The optimization efficiency can be improved by setting reasonable upper and lower bounds and step sizes for the variables. Considering the complexity of the optimization in this case, the variables are defined as follows: 1) For the two core spaces C1 and C2, the range of Dx is set to be between −20 and 20 m (inclusive), with a step size of 0.1 m. 2) In C2, ∠α and ∠β are allowed to change within ±15° and ∠γ to change within ±20°, with a step size of 1°. 3) The values of all variables of each node in S1–S3 and variables of each node in S4–S6 on the X- and Y-axes can range from 0 to 10 m (inclusive), with a step size of 0.1 m. 4) Nodes E, F, G, H, M, and N in S4–S6 can range between 0 and 5 m along the Z-axis, with the distance from nodes M and N to the core space ensured to be between 0 and 10 m and the step size of the above variables set to 0.1 m, which is consistent with that for S1–S3. Finally, 5) in S4–S6, the horizontal movement of nodes M and N is set to range between −10 and 10 m, with a step size of 0.1 m. Details of the variables are shown in Table 2.
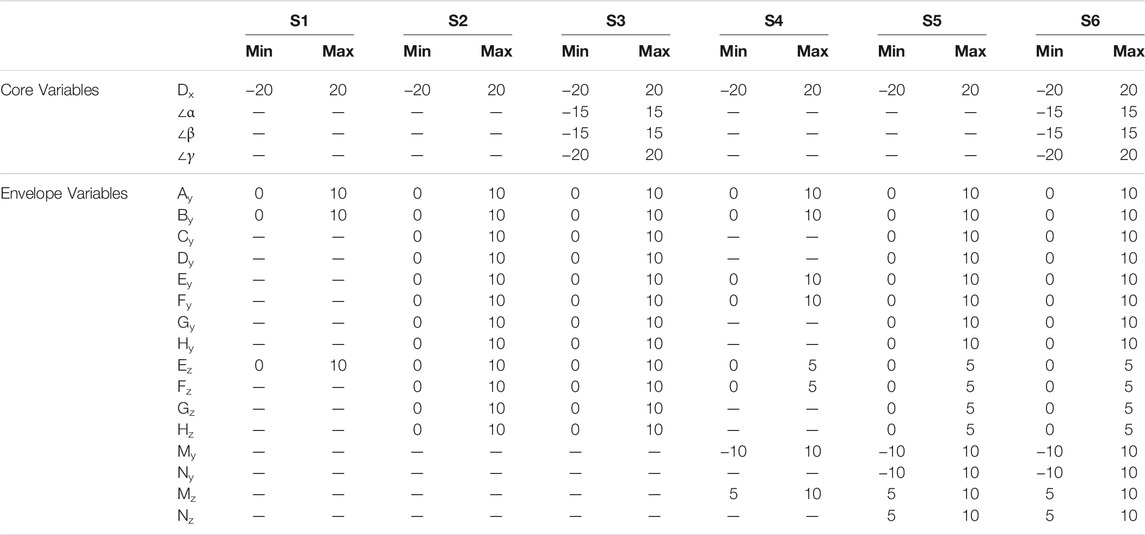
TABLE 2. Domains of the shape variables.
In this case, solar radiation (SR), the surface coefficient (SC), and space efficiency (SE) are selected as the key objectives for optimization, where larger SR and SE values and smaller SC values are better. In addition, the building area, volume, and height are selected as secondary indicators to provide a basis for the designers to select solutions. SR is calculated using the Grasshopper plug-in Ladybug, SC and SE are calculated by a program written in Grasshopper, and the secondary indicators can be obtained by direct query in Grasshopper.
To verify the effectiveness of this optimization method, reference buildings for comparative study are defined with the following rules: 1) corresponding reference buildings are set for straight-edge shapes and curved-edge shapes; 2) the reference buildings are modeled after the baseline straight-edge shape S1 and the curved-edge shape S4, respectively, and the upper and lower bounds of the node variables except Dx are removed to evaluate the performance of building shapes under extreme conditions. Therefore, there are a total of four reference buildings, numbered 1–4, with the minimum and maximum values of node variables of S1 selected for reference buildings 1 and 2, respectively, and the minimum and maximum values of node variables of S4 selected for reference buildings 3 and 4, respectively. After the simulation, the shapes and solar radiation distributions of the reference buildings are shown in Figure 10, and the values of their respective variables, core indicators (“Objectives”), and secondary indicators are presented in Table 3.
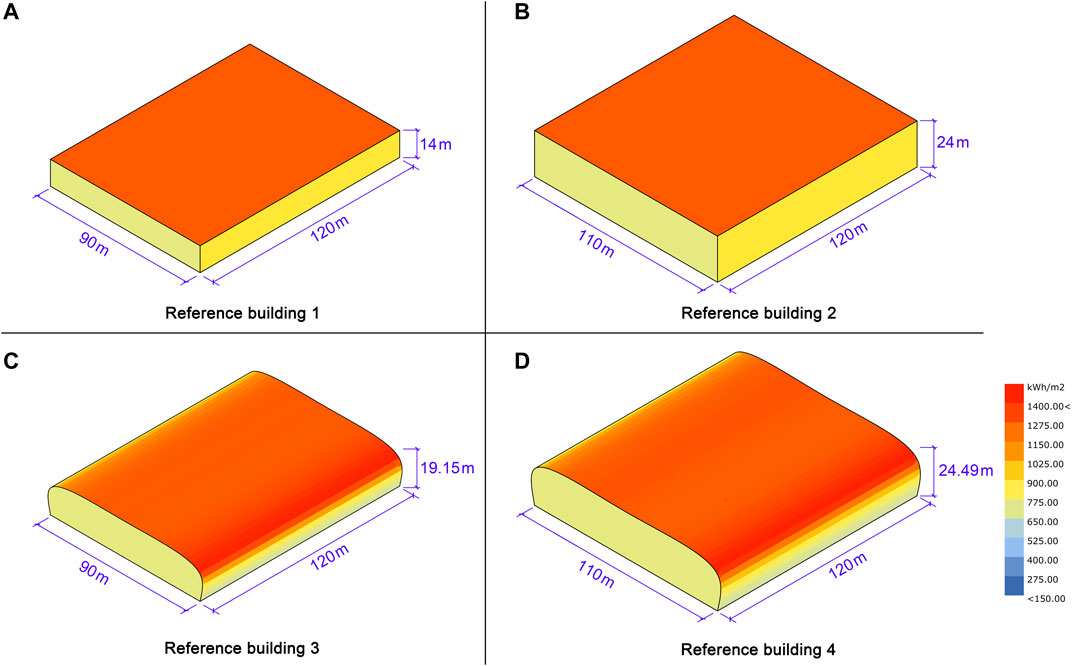
FIGURE 10. The shapes and solar radiation distributions of the reference buildings: (A) Reference building 1; (B) Reference building 2; (C) Reference building 3; (D) Reference building 4.
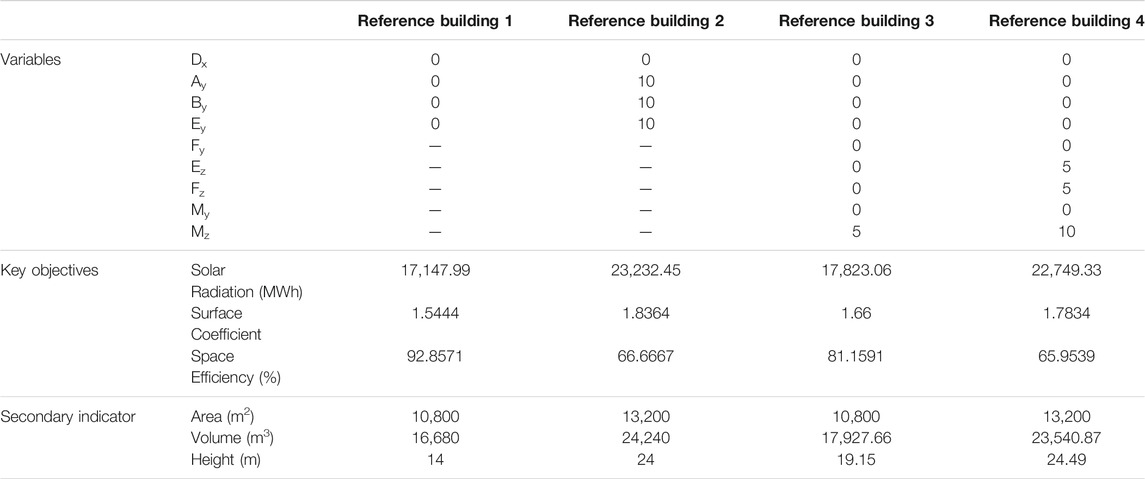
TABLE 3. Variables and performance of the reference buildings.
For this case, the following MOGA parameter values were set: the population size = 50, maximum generations = 100, crossover rate = 0.8, mutation probability = 0.2, mutation rate = 0.9 and elitism = 0.5. The optimization was performed on a computer with Windows 10 (16 core 3.5 GHz processor, 8G RAM), and the total calculation required 120.4 h. The results are presented hereafter.
The optimization method proposed in this work can achieve nondominated solutions for the optimized tradeoff among three key objectives, and the optimization results can be used to support the early-stage design of large-space building shapes in three ways: 1) By visualizing the Pareto Frontier, the distribution pattern of nondominated solutions can be presented and the information on key objectives distribution displayed. 2) The performance characteristics of the optimized shapes can be investigated through a horizontal comparison of the optimized solutions for different shape types, and the performance improvement effect of the optimization can be verified by comparing the optimized shapes with reference buildings. Finally, 3) analysis of the distribution of the shape variables in the optimized solutions facilitates both the discovery of typical shape characteristics of the optimized solutions and the potential identification of key variables affecting building performance, which provides a reference for subsequent in-depth designs.
The Pareto Frontier for each of the six shapes in this case study was generated after 100 iterations. Each point on the Pareto Frontier is a nondominated solution. Except for the solution that obtains the optimal value for a core indicator, each of the remaining solutions achieves the optimal tradeoff among the three objectives, which is called a characteristic solution in this study and can be selected as the final scheme. The optimal solutions for single indicators are presented here, with their positions in the Pareto Frontier, building shapes, sunlight distributions, and key indicators shown in Figure 11. The other three random characteristic solutions of each shape are also marked, and their key indicator values were also used in the comparative analysis.
1) Figure 11A shows the Pareto Frontier for S1, which has a total of 63 nondominated solutions that are approximately distributed in an arc. Solution 63 has the largest solar radiation, 23,962.52 MWh; Solution 1 has the smallest surface coefficient, 1.4870; and Solution 2 has the highest space efficiency, up to 92.86%. The two solutions are close to each other in the Pareto Frontier, indicating that the surface coefficient and space efficiency are highly correlated for S1.
2) The Pareto Frontier of S2 is shown in Figure 11B. There are a total of 169 nondominated solutions, which are distributed in two curves. Solution 169 located at the top end of the curve on the right side has the highest solar radiation, 22,617.23 MWh; Solution 1 has the smallest surface coefficient, 1.3236; and Solution 21 has the highest space efficiency, 91.82%.
3) As shown in Figure 11C, the Pareto Frontier of S3 is more scattered than that of S2, and there are a total of 160 nondominated solutions, which are approximately distributed over a curved surface. Solution 160 at the top right end of the surface has the highest solar radiation, 23,901.06 MWh; Solution 4 has the smallest surface coefficient, 1.3239; and Solution 27 has the highest space efficiency, 92.31%. The rest of the characteristic solutions each have their own shape characteristics and emphasized indicators, which can meet the diverse preferences of designers for shapes.
4) The Pareto Frontier of S4 is shown in Figure 12A, which contains a total of 146 nondominated solutions distributed approximately on two curves that converge at the upper right corner, where Solution 146 is located. This solution has the highest solar radiation, 23,374.13 MWh; Solution 1 has the smallest surface coefficient, 1.3997; and Solution 2 has the highest space efficiency, 82.96%. Solutions 1 and 2 have very close values for each indicator and are located in the lower left corner of the Pareto Frontier.
5) Figure 12B shows that there are 159 nondominated solutions in the Pareto Frontier of S5, with a distribution similar to that of S4. Specifically, the formed curves also converge at the top, where Solution 159 is located. This solution features the highest solar radiation of 23,320.51 MWh; at the lower left corner of the curves, Solution 1 has the smallest surface coefficient of 1.4011 and Solution 2 the highest space efficiency of 82.90%. A comprehensive comparison revealed that the characteristic solutions differ substantially in terms of each indicator and hence can be selected according to different needs.
6) Three core variables are added to S6, which therefore has a significantly different planar shape. Figure 12C shows its Pareto Frontier, which consists of a total of 156 nondominated solutions distributed on a roughly curved surface. Solution 156 has the highest solar radiation, 24,460.74 MWh; Solution 1 has the smallest surface coefficient, 1.4136; and Solution 34 has the highest space efficiency, up to 88.50%. The remaining characteristic solutions differ significantly in terms of the shape, indicators, and variable values, indicating a broad range of optimization solutions and a high variability in the results, which can meet diverse design needs.
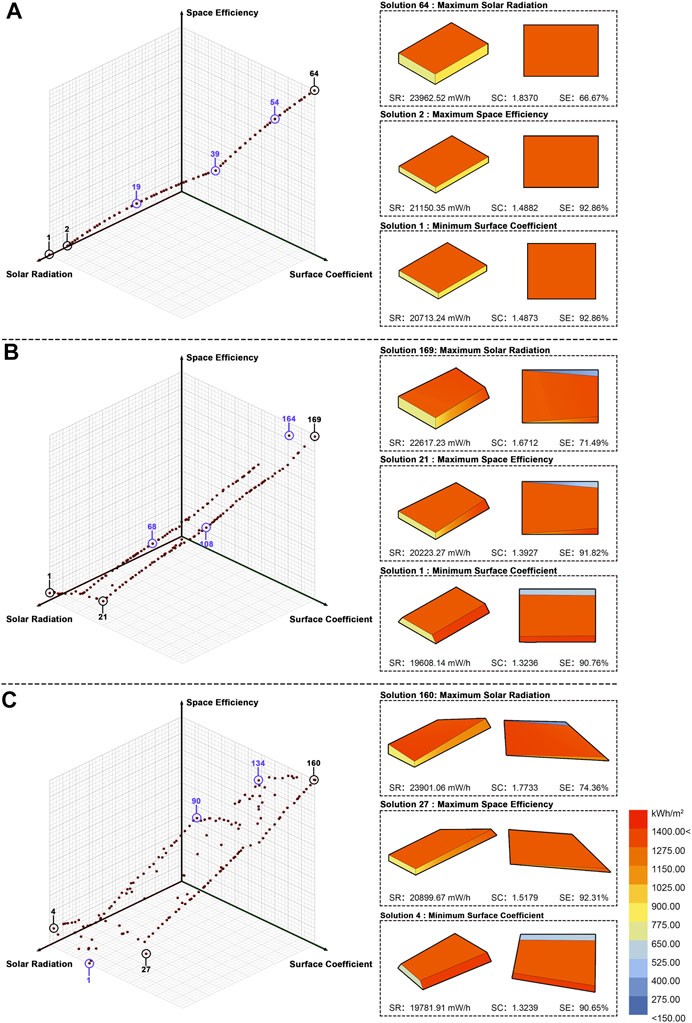
FIGURE 11. Pareto Frontier of S1 and the building shapes of its optimal solutions: (A) S1; (B) S2; (C) S3.
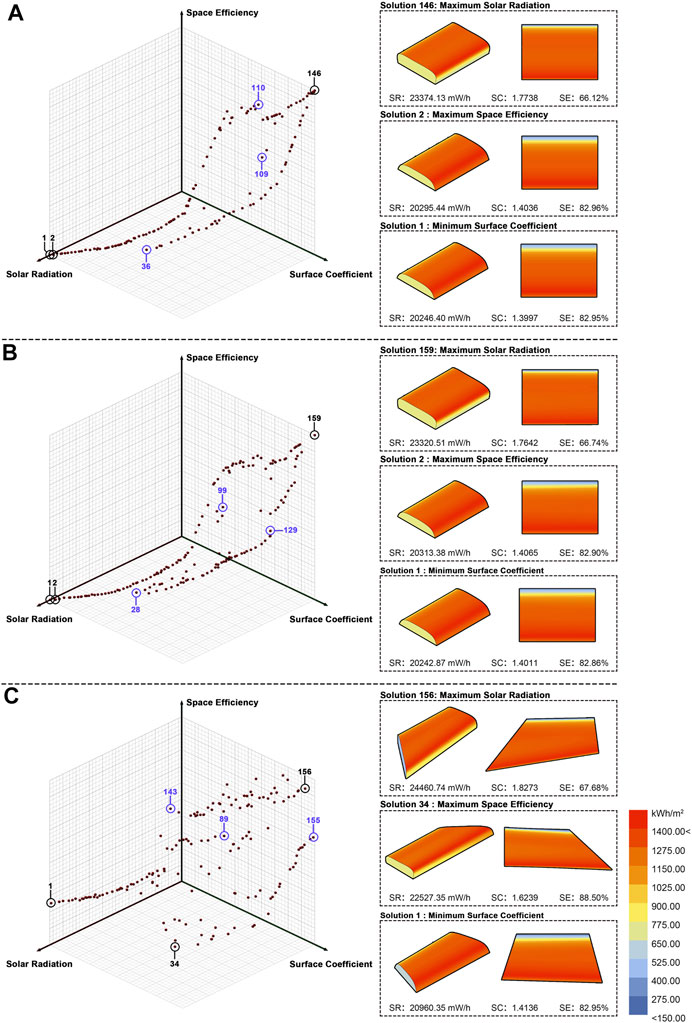
FIGURE 12. Pareto Frontier of S1 and the building shapes of its optimal solutions: (A) S4; (B) S5; (C) S6.
The comparative analysis of the results includes a comparison of the optimized solutions among different shape types and comparisons with the corresponding reference buildings.
The solar radiation, surface coefficient, and space efficiency values for the extremal solutions and the remaining characteristic solutions of S1, S2, and S3 with straight edges, as well as the improvements relative to reference building 1 and reference building 2, are shown in Table 4. In terms of solar radiation, each optimized shape shows a significant improvement over that for reference building 1. The solution with the greatest improvement is the Best SR solution of S1, exhibiting an improvement of 39.74% in solar radiation accompanied by a change of 18.95% in the surface coefficient and 28.20% in space efficiency; and the solution with the smallest improvement is the Best SC solution of S2, with a 14.35% increase in solar radiation along with a 14.30% increase in the surface coefficient but a 2.26% decrease in space efficiency, noting that the decrease is much smaller than the increases in the other two indicators. In contrast to reference building 2, which performs well in solar radiation, most of the nondominated solutions show a decrease in solar radiation but a significant improvement in the surface coefficient and space efficiency. The solution with the largest reduction in solar radiation is the Best SC solution of S2, which shows a 15.60% decrease in solar radiation in exchange for a 27.92% improvement in the surface coefficient and a 36.14% improvement in space efficiency. It is worth mentioning that the best SR solution of S3 improves all three indicators by 2.88, 3.44, and 11.54%, respectively.
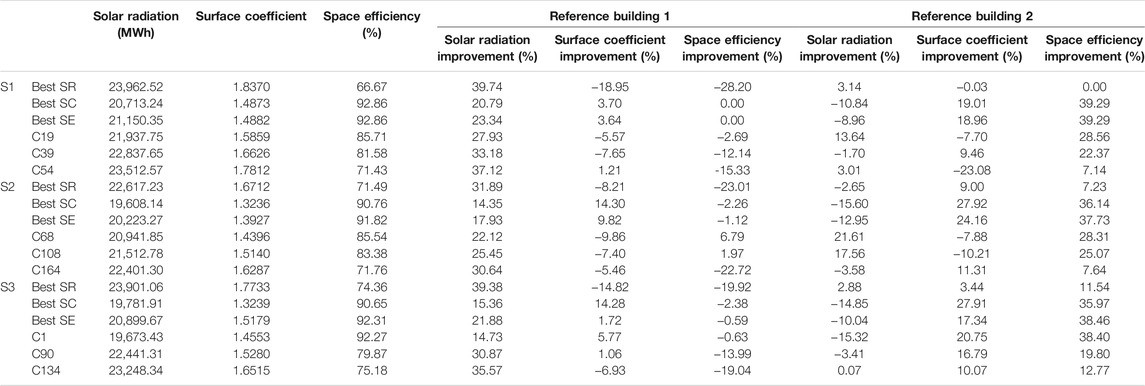
TABLE 4. Performance of S1-S3 characteristic solutions and comparison with reference buildings 1 and 2.
The solar radiation, surface coefficient, and space efficiency of each nondominated solution of the curved-edge shapes S4, S5, and S6 and the improvements relative to reference buildings 3 and 4 are shown in Table 5. The comparison with reference building 3 shows that the solar radiation of each nondominated solution increases significantly, and the Best SR solution of S6 improves solar radiation the most, by up to 37.24%, albeit accompanied by a 10.08% decrease in the surface coefficient and a 16.61% decrease in space efficiency. The best SC solution of S5 has the smallest increase in solar radiation, 13.58%, but its surface coefficient and space efficiency increase by 15.60 and 2.10% respectively, indicating that the three indicators are all better than those of reference building 3. Compared with reference building 4, some of the characteristic solutions show reductions in solar radiation in the range of 0.98–11.02% but display significant improvements in the other two indicators, with the improvement in the surface coefficient in the range of 8.94–21.52% and the improvement in the space efficiency between 13.31 and 34.18%; other characteristic solutions exhibit an improvement in solar radiation between 0.43 and 7.52%, and most of these solutions feature improvements in both the surface coefficient and space efficiency, achieving an overall improvement in the three indicators.
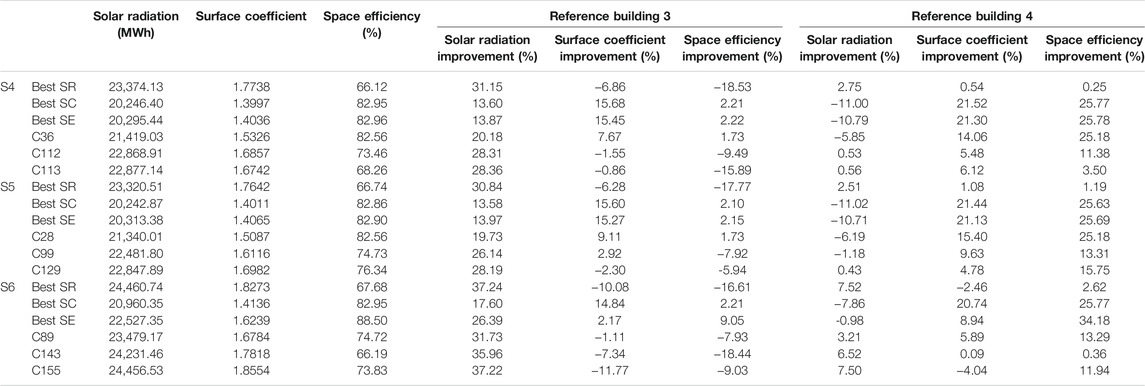
TABLE 5. Performance of S4-S6 characteristic solutions and comparison with reference buildings 3 and 4.
The distribution of all nondominated solutions of the six shapes are analyzed to verify the effectiveness of the optimization and provide a basis for selection in the early design stage. As seen in Figure 13A, all the nondominated solutions of the six shapes are significantly better than reference buildings 1 and 3 in terms of solar radiation, and all the shapes except S2 have several optimized solutions better than reference buildings 2 and 4. In terms of the surface coefficient, as shown in Figure 13B, most of the nondominated solutions of all six shapes are better than the reference buildings, with S2 performing the best and approximately 75% of the nondominated solutions performing better than reference building 1, the best performer for this indicator among the reference buildings. Figure 13C shows that the space efficiencies of all optimized solutions lie between that of reference building 1, the best performer by this indicator, and reference building 4, the worst performer by this indicator, with S1, S2, and S3 performing relatively well, indicating that the straight-edge shapes have an advantage in space utilization. Among the curved-edge shapes, S6 has a higher upper bound due to its greater flexibility in shape change and better chance of achieving higher space efficiency.
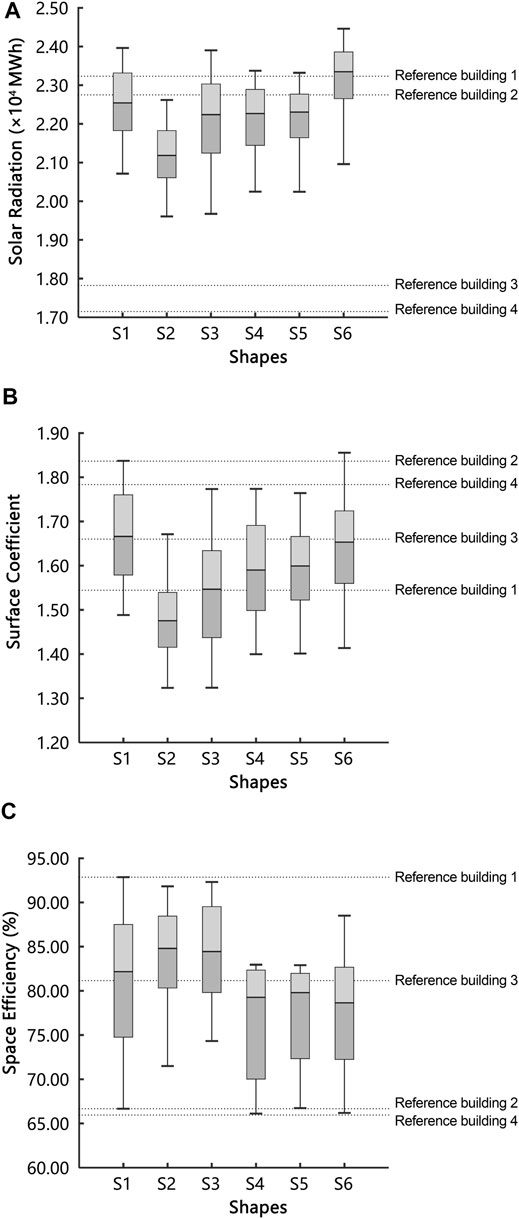
FIGURE 13. Performance distribution of six shapes and comparison with the reference buildings: (A) solar radiation; (B) surface coefficient; (C) space efficiency.
In this work, a parallel coordinates plot (PCP) is used to analyze the distribution of shape variables of nondominated solutions. PCP is a visualization method suitable for multidimensional data and can reflect the distributional trends in data and relationships among variables. Using this method, we can clarify the variable value patterns of the optimized solutions and thereby discover the common shape characteristics of the nondominated solutions and identify the key variables affecting building performance, which can provide a reference for subsequent in-depth design. The variable distributions of straight- and curved-edge shapes are shown in Figures 11,12, respectively, where the solutions with different solar radiation gains are marked in different colors, as noted in the legend.
1) The variable distribution of S1 in Figure 14A shows that Dx, Ay, and By generally take their respective maximum values with high consistency, indicating that the depth of the building and the area of the south façade both tend to increase in optimized shapes. In terms of optimization objectives, solar radiation gain is positively correlated with the surface coefficient and negatively correlated with space efficiency. The solar radiation gain of the building depends more on Ez, with a larger Ez leading to a higher solar radiation, a greater surface coefficient, and a lower space efficiency. Thus, Ez is the key variable for shape in this work and should be given attention in the design.
2) Figure 14B shows the variable distribution of S2, which is similar to that of S1, that is, Dx, Ay, By, Cy, and Dy tend to choose their respective maximum values to maximize the planar area and the south façade area. Similarly, solar radiation gain is positively correlated with the surface coefficient and negatively correlated with space efficiency. Variables Hy, Ez, and Hz are strongly correlated with solar radiation, and the larger their values are, the greater the solar radiation gain of the building. Hence, these are key variables that need to be addressed in design.
3) The variable distribution of S3 shown in Figure 14C is much more complex than those of S1 and S2. Specifically, the distributions of the values of Dx, ∠α, ∠β, Ay, By, Cy, Dy, and Hy of nondominated solutions are relatively concentrated, and the advantage of intercepting sunlight is prominent when the maximum values of these variables are taken. Gz tends to take the minimum value; that is, the roof slopes downward toward this point to obtain more sunlight. The remaining variables are widely distributed; in particular, Gy and Fz each exhibit a polarized trend. Due to the large number of variables, their influence on the optimization results is complex, and there are no obvious correlations between the optimization objectives.
4) In the variable distribution of S4 shown in Figure 15A, similar to that of S1, Dx, Ay, and By are all concentrated at their respective maximum values to increase the building depth and south-facing area. In addition, a greater Ey can increase the roof area and thus further increase the building’s ability to acquire sunlight. Ez is strongly correlated with solar radiation, and the larger its value is, the more the roof slopes to the south and the more favorable it is for receiving sunlight. Overall, solar radiation is positively correlated with the surface coefficient and notably negatively correlated with space efficiency.
5) The variable distribution of S5 in Figure 15B shows that the values of Dx, Ay, By, Cy, and Dy are still aimed at maximizing the planar area, and hence, the maximum values tend to be chosen. Larger values of My and Ny increase the solar radiation by tilting the roof to the south; the distributions of Ey and Hy are strongly correlated with solar radiation, and the greater their values are, the greater the solar radiation gain, so the two can be used as key variables in the design.
6) Figure 15C shows that among the 20 variables of S6, excluding Dx, ∠α, Ay, By, Cy, and Dy, which take their respective maximum values, the values of the remaining variables are widely distributed and discrete, showing no obvious pattern. This distribution indicates that when there are a larger number of variables, the influence of the interactions among variables on the optimization results is relatively complex. In terms of solar radiation gain alone, solar radiation increases most significantly when Ey and Hz are maximized.
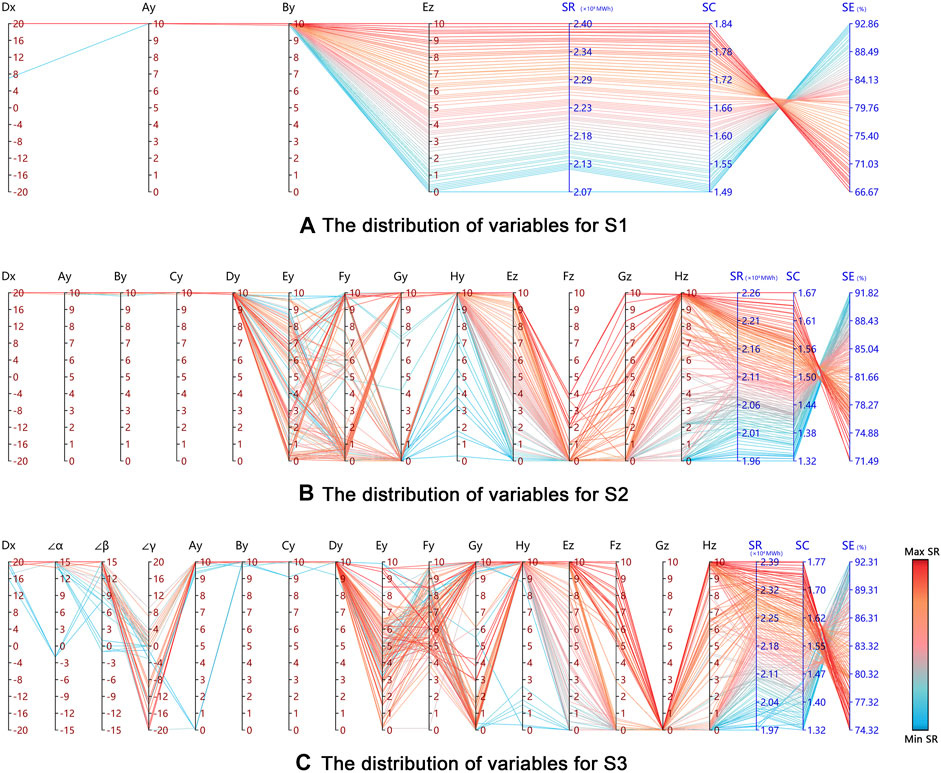
FIGURE 14. Variable distributions of shapes S1-S3: (A) S1; (B) S2; (C) S3.
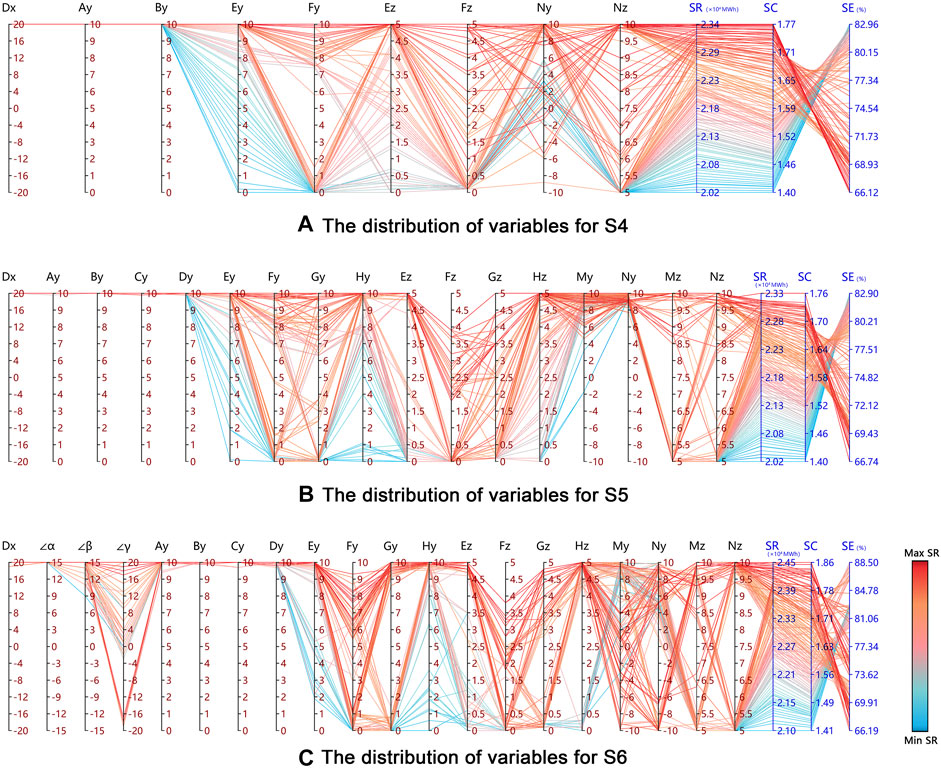
FIGURE 15. Variable distributions of shapes S4-S6: (A) S4; (B) S5; (C) S6.
The simulation results for six large-space exhibition hall shapes in this case study show that this optimization method is very effective at comprehensively improving various aspects of building performance. Designers are provided with sufficient quantitative data support through the Pareto Frontier, comparative analysis of results, and analysis of variable distributions.
1) The optimized nondominated solutions in the Pareto Frontier are sorted, and their shape appearances, performance, secondary indicators, and variable values are directly displayed, so that designers are provided with an intuitive basis for choosing concepts.
2) The comparative analysis of the results enables a horizontal comparison of the differences in performance among various optimized shape types and in improvements in the optimized shapes relative to reference buildings, allowing a designer to select the shape type that meets the design intention based on the results.
3) Distributional analysis of color-coded variables can reveal the patterns of values for variables under various optimized shapes and determine both the correlations between variables and correlations between variables and objectives and hence help designers find the key variables affecting performance.
Building design is essentially a process of finding optimal solutions to multiple objectives within the constraints of objective design requirements and subjective design intention. These objectives often conflict with each other, and the designer needs to balance them to obtain the best overall building performance. In the early design stage, optimization of the building concept can yield significant and long-term benefits at a relatively low cost. In this work, a method is discussed for enhancing the solar potential of a large-space building through shape optimization in the early design process to obtain sufficient sunlight while balancing the energy efficiency and space utilization of the building. This method is based on the “modeling-calculation-optimization” process, which includes three main steps, namely, building shape modeling, key indicator calculation, and MOGA optimization. First, the parametric modeling method is used to construct a two-level large-space building shape model with core and envelope variables. Next, three key performance objectives, i.e., solar radiation, the surface coefficient, and space efficiency, are calculated and used to drive the MOGA to automatically iterate and optimize the building shape. The optimization results can be used to generate the Pareto Frontier, a comparative analysis, and a variable distribution analysis to provide designers with feasible suggestions and a quantitative basis for selecting a solution. A case study of a large-space exhibition hall in Shenyang, China, is conducted to demonstrate the applicability of this method during the early design stage in which a large number of building shape concepts need to be generated, compared, and optimized. The proposed method can help designers obtain optimized building shape solutions quickly and efficiently.
The following main conclusions were drawn from this study:
1 The case study shows that this method can be used to obtain relatively optimized large-space building shapes that achieve multi-objective tradeoff optimization in terms of improving the solar gain, energy efficiency, and space utilization, thereby significantly improving the overall performance of the building compared to the reference buildings.
2 A modeling method that describes the generation and change in building shape through node variables is suitable for large-space shape optimization. By changing the range of values and constraints of the node variables of the parametric model, the degree of freedom of the building shape change can be controlled, which in turn controls the optimization and improves the optimization efficiency.
3 There are some differences among the shape optimization schemes. For example, curved-edge shapes have an advantage over straight-edge shapes in terms of solar gain but are inferior in terms of space efficiency. These characteristics can be utilized in the design.
4 This method can effectively help designers in the early design stage: the Pareto Frontier can be used to visualize the shapes and various indicators of nondominated solutions; the differences among the shapes can be identified through a comparative analysis of the results so that the architect can choose a suitable shape; and variable distribution analysis helps the designer find the key variables that affect the performance.
The method still has room for improvement, because it is oriented to the early design stage and especially aims at improving optimization efficiency and consequently reduces the accuracy to some extent. The results from simplified calculation of key objectives cannot represent the performance of the final completed building. Therefore, more accurate and detailed simulation analysis is needed for the subsequent in-depth design. Follow-up research should be carried out to further reduce the model complexity and improve the calculation accuracy and optimization efficiency. The application of this method can be extended to other research areas (e.g., energy savings, carbon emissions, and comfort) by changing model construction methods and replacing optimization objectives.
The original contributions presented in the study are included in the article/Supplementary Material, further inquiries can be directed to the corresponding author.
LZ—The main work of this paper, experiment design. CW—case study, data statistics and analysis. YC—case study, charting. LZ—Method and theory guidance.
The authors gratefully acknowledge the support of the National Natural Science Foundation of China (NSFC) through Grant Nos 51978418 and 51738006.
The authors declare that the research was conducted in the absence of any commercial or financial relationships that could be construed as a potential conflict of interest.
All claims expressed in this article are solely those of the authors and do not necessarily represent those of their affiliated organizations, or those of the publisher, the editors and the reviewers. Any product that may be evaluated in this article, or claim that may be made by its manufacturer, is not guaranteed or endorsed by the publisher.
Angelis-Dimakis, A., Biberacher, M., Dominguez, J., Fiorese, G., Gadocha, S., Gnansounou, E., et al. (2011). Methods and Tools to Evaluate the Availability of Renewable Energy Sources. Renew. Sust. Energ. Rev. 15, 1182–1200. doi:10.1016/j.rser.2010.09.049
Ascione, F., Bianco, N., de Stasio, C., Mauro, G. M., and Vanoli, G. P. (2015). A New Methodology for Cost-Optimal Analysis by Means of the Multi-Objective Optimization of Building Energy Performance. Energy and Buildings 88, 78–90. doi:10.1016/j.enbuild.2014.11.058
Baljit, S. S. S., Chan, H.-Y., and Sopian, K. (2016). Review of Building Integrated Applications of Photovoltaic and Solar thermal Systems. J. Clean. Prod. 137, 677–689. doi:10.1016/j.jclepro.2016.07.150
Barone, G., Buonomano, A., Forzano, C., Giuzio, G. F., and Palombo, A. (2020). Passive and Active Performance Assessment of Building Integrated Hybrid Solar Photovoltaic/thermal Collector Prototypes: Energy, comfort, and Economic Analyses. Energy 209, 118435. doi:10.1016/j.energy.2020.118435
Bichiou, Y., and Krarti, M. (2011). Optimization of Envelope and HVAC Systems Selection for Residential Buildings. Energy and Buildings 43, 3373–3382. doi:10.1016/j.enbuild.2011.08.031
Carlucci, S., Cattarin, G., Causone, F., and Pagliano, L. (2015). Multi-objective Optimization of a Nearly Zero-Energy Building Based on thermal and Visual Discomfort Minimization Using a Non-dominated Sorting Genetic Algorithm (NSGA-II). Energy and Buildings 104, 378–394. doi:10.1016/j.enbuild.2015.06.064
Chang, S., Saha, N., Castro-Lacouture, D., and Pei-Ju Yang, P. (2019). Generative Design and Performance Modeling for Relationships between Urban Built Forms, Sky Opening, Solar Radiation and Energy. Energ. Proced. 158, 3994–4002. doi:10.1016/j.egypro.2019.01.841
Ciardiello, A., Rosso, F., Dell'Olmo, J., Ciancio, V., Ferrero, M., and Salata, F. (2020). Multi-objective Approach to the Optimization of Shape and Envelope in Building Energy Design. Appl. Energ. 280, 115984. doi:10.1016/j.apenergy.2020.115984
Coakley, D., Raftery, P., and Keane, M. (2014). A Review of Methods to Match Building Energy Simulation Models to Measured Data. Renew. Sust. Energ. Rev. 37, 123–141. doi:10.1016/j.rser.2014.05.007
Evins, R., Pointer, P., Vaidyanathan, R., and Burgess, S. (2012). A Case Study Exploring Regulated Energy Use in Domestic Buildings Using Design-Of-Experiments and Multi-Objective Optimisation. Building Environ. 54, 126–136. doi:10.1016/j.buildenv.2012.02.012
Feng, J., Luo, X., Gao, M., Abbas, A., Xu, Y.-P., and Pouramini, S. (2021). Minimization of Energy Consumption by Building Shape Optimization Using an Improved Manta-Ray Foraging Optimization Algorithm. Energ. Rep. 7, 1068–1078. doi:10.1016/j.egyr.2021.02.028
Freitas, J. d. S., Cronemberger, J., Soares, R. M., and Amorim, C. N. D. (2020). Modeling and Assessing BIPV Envelopes Using Parametric Rhinoceros Plugins Grasshopper and Ladybug. Renew. Energ. 160, 1468–1479. doi:10.1016/j.renene.2020.05.137
Gil-Lopez, T., Galvez-Huerta, M. A., O’Donohoe, P. G., Castejon-Navas, J., and Dieguez-Elizondo, P. M. (2017). Analysis of the Influence of the Return Position in the Vertical Temperature Gradient in Displacement Ventilation Systems for Large Halls. Energy and Buildings 140, 371–379. doi:10.1016/j.enbuild.2017.02.017
Han, X., Pei, J., Liu, J., and Xu, L. (2013). Multi-objective Building Energy Consumption Prediction and Optimization for Eco-Community Planning. Energy and Buildings 66, 22–32. doi:10.1016/j.enbuild.2013.07.016
Harding, J., Joyce, S., Shepherd, P., and Williams, C. (2012). Thinking Topologically at Early Stage Parametric Design. Adv. Architectural Geometry 2013, 67–76. doi:10.1007/978-3-7091-1251-9_5
Harter, H., Singh, M. M., Schneider-Marin, P., Lang, W., and Geyer, P. (2020). Uncertainty Analysis of Life Cycle Energy Assessment in Early Stages of Design. Energy and Buildings 208, 109635. doi:10.1016/j.enbuild.2019.109635
Hashempour, N., Taherkhani, R., and Mahdikhani, M. (2020). Energy Performance Optimization of Existing Buildings: A Literature Review. Sust. Cities Soc. 54, 101967. doi:10.1016/j.scs.2019.101967
Heiselberg, P., Murakami, S., and Claude-Alain, R. (1998). Ventilation of Large Spaces in Buildings, Analysis and Prediction Techniques, Energy Conservation in Buildings and Community Systems; Annex 26: Energy Efficient Ventilation of Large Enclosures.
Hopfe, C. J., and Hensen, J. L. M. (2011). Uncertainty Analysis in Building Performance Simulation for Design Support. Energy and Buildings 43, 2798–2805. doi:10.1016/j.enbuild.2011.06.034
Ihm, P., and Krarti, M. (2013). Design Optimization of Energy Efficient Office Buildings in Tunisia. J. Solar Energ. Eng. Trans. ASME. 135, 1–10. doi:10.1115/1.4025588
Jedrzejuk, H., and Marks, W. (2002). Optimization of Shape and Functional Structure of Buildings as Well as Heat Source Utilization. Basic Theory. Building Environ. 37, 1379–1383. doi:10.1016/S0360-1323(01)00101-9
Jiang, H., Lu, N., Qin, J., and Yao, L. (2021). Hierarchical Identification of Solar Radiation Zones in China. Renew. Sust. Energ. Rev. 145, 111105. doi:10.1016/j.rser.2021.111105
Jin, J.-T., and Jeong, J.-W. (2014). Optimization of a Free-form Building Shape to Minimize External thermal Load Using Genetic Algorithm. Energy and Buildings 85, 473–482. doi:10.1016/j.enbuild.2014.09.080
Jin, J.-T., and Jeong, J.-W. (2013). Thermal Characteristic Prediction Models for a Free-form Building in Various Climate Zones. Energy 50, 468–476. doi:10.1016/j.energy.2012.11.011
Junghans, L., and Darde, N. (2015). Hybrid Single Objective Genetic Algorithm Coupled with the Simulated Annealing Optimization Method for Building Optimization. Energy and Buildings 86, 651–662. doi:10.1016/j.enbuild.2014.10.039
Kämpf, J. H., Montavon, M., Bunyesc, J., Bolliger, R., and Robinson, D. (2010). Optimisation of Buildings' Solar Irradiation Availability. Solar Energy 84, 596–603. doi:10.1016/j.solener.2009.07.013
Karatas, A., and El-Rayes, K. (2015). Optimizing Tradeoffs Among Housing Sustainability Objectives. Automation in Construction 53, 83–94. doi:10.1016/j.autcon.2015.02.010
Kharvari, F. (2020). An Empirical Validation of Daylighting Tools: Assessing Radiance Parameters and Simulation Settings in Ladybug and Honeybee against Field Measurements. Solar Energy 207, 1021–1036. doi:10.1016/j.solener.2020.07.054
Kim, H., and Clayton, M. J. (2020). A Multi-Objective Optimization Approach for Climate-Adaptive Building Envelope Design Using Parametric Behavior Maps. Building Environ. 185, 107292. doi:10.1016/j.buildenv.2020.107292
Li, Q., Yoshino, H., Mochida, A., Lei, B., Meng, Q., Zhao, L., et al. (2009). CFD Study of the thermal Environment in an Air-Conditioned Train Station Building. Building Environ. 44, 1452–1465. doi:10.1016/j.buildenv.2008.08.010
Li, Q., Zhang, L., Zhang, L., and Wu, X. (2021). Optimizing Energy Efficiency and thermal comfort in Building green Retrofit. Energy 237, 121509. doi:10.1016/j.energy.2021.121509
Lin, B., Chen, H., Yu, Q., Zhou, X., Lv, S., He, Q., et al. (2021). MOOSAS - A Systematic Solution for Multiple Objective Building Performance Optimization in the Early Design Stage. Building Environ. 200, 107929. doi:10.1016/j.buildenv.2021.107929
Lin, B., and Li, Z. (2016). Building Energy-Saving Approach in Early Design Stage. Chin. Sci. Bull. 61, 113–121. doi:10.1360/N972014-01379
Liu, X., Lin, L., Liu, X., Zhang, T., Rong, X., Yang, L., et al. (2018). Evaluation of Air Infiltration in a Hub Airport Terminal: On-Site Measurement and Numerical Simulation. Building Environ. 143, 163–177. doi:10.1016/j.buildenv.2018.07.006
Liu, X., Liu, X., and Zhang, T. (2020). Influence of Air-Conditioning Systems on Buoyancy Driven Air Infiltration in Large Space Buildings: A Case Study of a Railway Station. Energy and Buildings 210, 109781. doi:10.1016/j.enbuild.2020.109781
Liu, Z., Zhang, Y., Yuan, X., Liu, Y., Xu, J., Zhang, S., et al. (2021). A Comprehensive Study of Feasibility and Applicability of Building Integrated Photovoltaic (BIPV) Systems in Regions with High Solar Irradiance. J. Clean. Prod. 307, 127240. doi:10.1016/j.jclepro.2021.127240
Maghrabie, H. M., Elsaid, K., Sayed, E. T., Abdelkareem, M. A., Wilberforce, T., and Olabi, A. G. (2021). Building-integrated Photovoltaic/thermal (BIPVT) Systems: Applications and Challenges. Sustainable Energ. Tech. Assessments 45, 101151. doi:10.1016/j.seta.2021.101151
McKinstray, R., Lim, J. B. P., Tanyimboh, T. T., Phan, D. T., Sha, W., and Brownlee, A. E. I. (2015). Topographical Optimisation of Single-Storey Non-domestic Steel Framed Buildings Using Photovoltaic Panels for Net-Zero Carbon Impact. Building Environ. 86, 120–131. doi:10.1016/j.buildenv.2014.12.017
Menezo, C., Lepers, S., Depecker, P., and Virgone, J. (2001). Design of Buildings Shape and Energetic Consumption. Building Environ. 36, 627–635.
Murray, S. N., Walsh, B. P., Kelliher, D., and O'Sullivan, D. T. J. (2014). Multi-variable Optimization of thermal Energy Efficiency Retrofitting of Buildings Using Static Modelling and Genetic Algorithms - A Case Study. Building Environ. 75, 98–107. doi:10.1016/j.buildenv.2014.01.011
Nault, E., Peronato, G., Rey, E., and Andersen, M. (2015). Review and Critical Analysis of Early-Design Phase Evaluation Metrics for the Solar Potential of Neighborhood Designs. Building Environ. 92, 679–691. doi:10.1016/j.buildenv.2015.05.012
Negendahl, K. (2015). Building Performance Simulation in the Early Design Stage: An Introduction to Integrated Dynamic Models. Automation in Construction 54, 39–53. doi:10.1016/j.autcon.2015.03.002
Negendahl, K., and Nielsen, T. R. (2015). Building Energy Optimization in the Early Design Stages: A Simplified Method. Energy and Buildings 105, 88–99. doi:10.1016/j.enbuild.2015.06.087
Negendahl, K. (2014). Parametric Design and Analysis Framework with Integrated Dynamic Models. Proc. 3rd Int. Workshop Des. Civil Environ. Eng. 23.
Nguyen, A. T., and Reiter, S. (2014). Passive Designs and Strategies for Low-Cost Housing Using Simulation-Based Optimization and Different thermal comfort Criteria. J. Building Perform. Simulation 7, 68–81. doi:10.1080/19401493.2013.770067
Ochoa, C. E., Aries, M. B. C., van Loenen, E. J., and Hensen, J. L. M. (2012). Considerations on Design Optimization Criteria for Windows Providing Low Energy Consumption and High Visual comfort. Appl. Energ. 95, 238–245. doi:10.1016/j.apenergy.2012.02.042
Oral, G. K., and Yilmaz, Z. (2002). The Limit U Values for Building Envelope Related to Building Form in Temperate and Cold Climatic Zones. Building Environ. 37, 1173–1180. doi:10.1016/S0360-1323(01)00102-0
Ouarghi, R., and Krarti, M. (2006). Building Shape Optimization Using Neural Network and Genetic Algorithm Approach. ASHRAE Trans. 112, 484–491.
Ourghi, R., Al-anzi, A., and Krarti, M. (2007). A Simplified Analysis Method to Predict the Impact of Shape on Annual Energy Use for Office Buildings. Energ. Convers. Manag. 48, 300–305. doi:10.1016/j.enconman.2006.04.011
Penna, P., Prada, A., Cappelletti, F., and Gasparella, A. (2015). Multi-objectives Optimization of Energy Efficiency Measures in Existing Buildings. Energy and Buildings 95, 57–69. doi:10.1016/j.enbuild.2014.11.003
Perez, R., Ineichen, P., Seals, R., Michalsky, J., and Stewart, R. (1990). Modeling Daylight Availability and Irradiance Components from Direct and Global Irradiance. Solar Energy 44, 271–289. doi:10.1016/0038-092X(90)90055-H
Ramallo-González, A. P., and Coley, D. A. (2014). Using Self-Adaptive Optimisation Methods to Perform Sequential Optimisation for Low-Energy Building Design. Energy and Buildings 81, 18–29. doi:10.1016/j.enbuild.2014.05.037
Raphael, B. (2011). Multi‐criteria Decision Making for Collaborative Design Optimization of Buildings. Built Env Proj Ass Man. 1, 122–136. doi:10.1108/20441241111180398
Ratti, C., Baker, N., and Steemers, K. (2005). Energy Consumption and Urban Texture. Energy and Buildings 37, 762–776. doi:10.1016/j.enbuild.2004.10.010
Robinson, D., and Stone, A. (2004). Irradiation Modelling Made Simple: The Cumulative Sky Approach and its Applications, PLEA - Passive and Low Energy Architecture. Eindhoven, Netherlands, 19–22.
Rohdin, P., and Moshfegh, B. (2007). Numerical Predictions of Indoor Climate in Large Industrial Premises. A Comparison between Different K-ε Models Supported by Field Measurements. Building Environ. 42, 3872–3882. doi:10.1016/j.buildenv.2006.11.005
Roudsari, M. S., and Pak, M. (2013). A Parametric Environmental Plugin for Grasshopper to Help Designers Create an Environmentally-Conscious Design, In Proceedings of BS 2013: 13th Conference of the International Building Performance Simulation Association. 3128–3135.
Shao, Y., Geyer, P., and Lang, W. (2014). Integrating Requirement Analysis and Multi-Objective Optimization for Office Building Energy Retrofit Strategies. Energy and Buildings 82, 356–368. doi:10.1016/j.enbuild.2014.07.030
Singh, M. M., Singaravel, S., Klein, R., and Geyer, P. (2020). Quick Energy Prediction and Comparison of Options at the Early Design Stage. Adv. Eng. Inform. 46, 101185. doi:10.1016/j.aei.2020.101185
Talaei, M., Mahdavinejad, M., Azari, R., Prieto, A., and Sangin, H. (2021). Multi-objective Optimization of Building-Integrated Microalgae Photobioreactors for Energy and Daylighting Performance. J. Building Eng. 42, 102832. doi:10.1016/j.jobe.2021.102832
Trinh, H. T. M. K., Chowdhury, S., Nguyen, M. T., and Liu, T. (2021). Optimising Flat Plate Buildings Based on Carbon Footprint Using Branch-and-Reduce Deterministic Algorithm. J. Clean. Prod. 320, 128780. doi:10.1016/j.jclepro.2021.128780
Tronchin, L., Manfren, M., and Tagliabue, L. C. (2016). Optimization of Building Energy Performance by Means of Multi-Scale Analysis - Lessons Learned from Case Studies. Sust. Cities Soc. 27, 296–306. doi:10.1016/j.scs.2015.11.003
Tuhus-Dubrow, D., and Krarti, M. (2010). Genetic-algorithm Based Approach to Optimize Building Envelope Design for Residential Buildings. Building Environ. 45, 1574–1581. doi:10.1016/j.buildenv.2010.01.005
Wang, C., Zhang, L., and Lyu, X. (2020). Research on Shape Pilot Control of Large Space Public Buildings in the North: Based on Low Energy Consumption Target. Architectural J. S1, 38–43.
Wang, L., and Zhao, X. (2021). Fast Optimization of Outriggers for Super-tall Buildings Using a Sensitivity Vector Algorithm. J. Building Eng. 43. doi:10.1016/j.jobe.2021.102531
Wang, W., Rivard, H., and Zmeureanu, R. (2006). Floor Shape Optimization for green Building Design. Adv. Eng. Inform. 20, 363–378. doi:10.1016/j.aei.2006.07.001
Wang, W., Zmeureanu, R., and Rivard, H. (2005). Applying Multi-Objective Genetic Algorithms in green Building Design Optimization. Building Environ. 40, 1512–1525. doi:10.1016/j.buildenv.2004.11.017
Wang, W., Zmeureanu, R., and Rivard, H. (2005). Two-phase Application of Multi-Objective Genetic Algorithms in green Building Design, IBPSA 2005 - International Building Performance Simulation Association 2005. 1323–1330.
Wright, J. A., Loosemore, H. A., and Farmani, R. (2002). Optimization of Building thermal Design and Control by Multi-Criterion Genetic Algorithm. Energy and Buildings 34, 959–972. doi:10.1016/S0378-7788(02)00071-3
Xu, J., Kim, J.-H., Hong, H., and Koo, J. (2015). A Systematic Approach for Energy Efficient Building Design Factors Optimization. Energy and Buildings 89, 87–96. doi:10.1016/j.enbuild.2014.12.022
Xu, Y., Zhang, G., Yan, C., Wang, G., Jiang, Y., and Zhao, K. (2021). A Two-Stage Multi-Objective Optimization Method for Envelope and Energy Generation Systems of Primary and Secondary School Teaching Buildings in China. Building Environ. 204, 108142. doi:10.1016/j.buildenv.2021.108142
Yi, Y. K. (2019). Building Facade Multi-Objective Optimization for Daylight and Aesthetical Perception. Building Environ. 156, 178–190. doi:10.1016/j.buildenv.2019.04.002
Yi, Y. K., and Kim, H. (2015). Agent-based Geometry Optimization with Genetic Algorithm (GA) for Tall Apartment's Solar Right. Solar Energy 113, 236–250. doi:10.1016/j.solener.2014.11.007
Yi, Y. K., and Malkawi, A. M. (2009). Optimizing Building Form for Energy Performance Based on Hierarchical Geometry Relation. Automation in Construction 18, 825–833. doi:10.1016/j.autcon.2009.03.006
Yi, Y. K., and Malkawi, A. M. (2012). Site-specific Optimal Energy Form Generation Based on Hierarchical Geometry Relation. Automation in Construction 26, 77–91. doi:10.1016/j.autcon.2012.05.004
Yu, G., Yang, H., Yan, Z., and Kyeredey Ansah, M. (2021). A Review of Designs and Performance of Façade-Based Building Integrated Photovoltaic-thermal (BIPVT) Systems. Appl. Therm. Eng. 182, 116081. doi:10.1016/j.applthermaleng.2020.116081
Yu, W., Li, B., Jia, H., Zhang, M., and Wang, D. (2015). Application of Multi-Objective Genetic Algorithm to Optimize Energy Efficiency and thermal comfort in Building Design. Energy and Buildings 88, 135–143. doi:10.1016/j.enbuild.2014.11.063
Zhang, J., Heng, C. K., Malone-Lee, L. C., Hii, D. J. C., Janssen, P., Leung, K. S., et al. (2012). Evaluating Environmental Implications of Density: A Comparative Case Study on the Relationship between Density, Urban Block Typology and Sky Exposure. Automation in Construction 22, 90–101. doi:10.1016/j.autcon.2011.06.011
Zhang, L., Zhang, L., and Wang, Y. (2016). Shape Optimization of Free-form Buildings Based on Solar Radiation Gain and Space Efficiency Using a Multi-Objective Genetic Algorithm in the Severe Cold Zones of China. Solar Energy 132, 38–50. doi:10.1016/j.solener.2016.02.053
Zhao, P., and Hu, W. (2012). Study on Building Corresponding Area Coefficient Instead of Building Shape Coefficient. Sichuan Building Sci. 38, 4–7.
Keywords: large-space building, building shape, multi-objective optimization, solar radiation, surface coefficient, space efficiency
Citation: Zhang L, Wang C, Chen Y and Zhang L (2021) Multi-Objective Optimization Method for the Shape of Large-Space Buildings Dominated by Solar Energy Gain in the Early Design Stage. Front. Energy Res. 9:744974. doi: 10.3389/fenrg.2021.744974
Received: 21 July 2021; Accepted: 13 October 2021;
Published: 03 November 2021.
Edited by:
Xingxing Zhang, Dalarna University, SwedenReviewed by:
Yilin Song, Tianjin University, ChinaCopyright © 2021 Zhang, Wang, Chen and Zhang. This is an open-access article distributed under the terms of the Creative Commons Attribution License (CC BY). The use, distribution or reproduction in other forums is permitted, provided the original author(s) and the copyright owner(s) are credited and that the original publication in this journal is cited, in accordance with accepted academic practice. No use, distribution or reproduction is permitted which does not comply with these terms.
*Correspondence: Longwei Zhang, bG9uZ3dlaXpoYW5nMTcxMDBAb3V0bG9vay5jb20=, el9sd0Bzanp1LmVkdS5jbg==
Disclaimer: All claims expressed in this article are solely those of the authors and do not necessarily represent those of their affiliated organizations, or those of the publisher, the editors and the reviewers. Any product that may be evaluated in this article or claim that may be made by its manufacturer is not guaranteed or endorsed by the publisher.
Research integrity at Frontiers
Learn more about the work of our research integrity team to safeguard the quality of each article we publish.