 Daolu Zhang1,2
 WenCong Xiao
 Tao Yu
- 1School of Electric Power Engineering South China University of Technology, Guangzhou, China
- 2Guangdong Provincial Key Laboratory of Intelligent Measurement and Advanced Metering of Power Grid, Guangzhou, China
Medium-and long-term load forecasting in the distribution network has important guiding significance for overload warning of distribution transformer, transformation of distribution network and other scenarios. However, there are many constraints in the forecasting process. For example, there are many predict objects, the data sample size of a single predict object is small, and the long term load trend is not obvious. The forecasting method based on neural network is difficult to model due to lack of data, and the forecasting method based on time sequence law commonly used in engineering is highly subjective, which is not effective. Aiming at the above problems, this paper takes distribution transformer as the research object and proposes a medium-and long-term load forecasting method for group objects based on Image Representation Learning (IRL). Firstly, the data of distribution transformer is preprocessed in order to restore the load variation in natural state. And then, the load forecasting process is decoupled into two parts: the load trend forecasting of the next year and numerical forecasting of the load change rate. Secondly, the load images covering annual and inter-annual data change information are constructed. Meanwhile, an Image Representation Learning forecasting model based on convolutional neural network, which will use to predict the load development trend, is obtained by using load images for training; And according to the data shape, the group classification of the data in different periods are carried out to train the corresponding group objects forecasting model of each group. Based on the forecasting data and the load trend forecasting result, the group forecasting model corresponding to the forecasting data can be selected to realize the numerical forecasting of load change rate. Due to the large number of predict objects, this paper introduces the evaluation index of group forecasting to measure the forecasting effect of different methods. Finally, the experimental results show that, compared with the existing distribution transformer forecasting methods, the method proposed in this paper has a better overall forecasting effect, and provides a new idea and solution for the medium-and long-term intelligent load forecasting of the distribution network.
Introduction
With the introduction of the concept of “Digital Power Grid” (Islam, 2016) and the development of measurement technology, power grid companies are constantly striving to promote the integration of multi-source heterogeneous data (Munshi and Mohamed, 2017), and many scholars are also constantly studying how to mine data implicit information to assist power grid decision-making (Chang and Huang, 2018). Load forecasting is the basis of generation control (Yang et al., 2015; Xi et al., 2016; Zhang et al., 2016), optimal dispatch (Zhang et al., 2015; Zhang et al., 2021), planning and construction in smart grid. As an important part of planning and construction, medium-and long-term load forecasting of distribution network plays an important role in network architecture optimization, selection of new energy access point, distribution transformer overload warning and other scenarios. Therefore, it is necessary to carry out in-depth research on medium-and long-term load forecasting of distribution network (Zhao et al., 2014).
The existing medium-and long-term load forecasting system is mainly divided into two categories: the methods based on the time sequence law of load and the methods based on the correlation between influencing factors and load (Kang et al., 2004; Li et al., 2018; Farrag and Elattar, 2021). The methods based on time sequence law requires the load sequence has certain trend law. Many literatures have applied these methods, such as time extrapolation method, exponential average method, dynamic average method, etc., (Kaytez, 2020); and the forecasting methods that take into account the influencing factors include the traditional unit consumption method and regression analysis method, as well as the emerging non-analytical artificial intelligence method (Alrashidi and El-Naggar, 2010; Kang and Zhao, 2012; Wen et al., 2020). Literature (Sun and Zhao, 2010) proposed a new continuous ant colony optimization algorithm called MG-CACO to optimize the parameters of SVM, and used 9 groups of historical load data to forecast the annual power load of Tianjin. Literature (Kazemzadeh et al., 2020) proposed a medium-and long-term load forecasting model based on PSO-SVR, and 6 groups of load data are used to predict the load peak of Iran’s national grid in the next year.
The above methods are mainly applied to large power grid systems. Because the system-level load has the same trend of continuous growth and the range of growth is similar, better forecasting results can be obtained by using a small amount of historical data of predict object. However, when these methods are applied directly to the distribution network level with no obvious continuous trend, the forecasting effect is not ideal. At present, there are few literatures on the medium-and long-term forecasting of distribution network, it is mainly because of the following difficulties:
1) The continuous trend of distribution network load is not obvious, and it often presents a fluctuating state rather than a monotonic growth state. The error of using time sequence extrapolation method is large.
2) The data required for medium-and long-term forecasting of distribution network is annual dimension data, so the historical data of a single predict object is less, and it is difficult to obtain good forecasting effect through the establishment of neural network.
3) Distribution network has three levels: station, feeder and transformer. The smaller the level, the more predict objects. If we use the traditional idea to train and model each predict object separately, it will cost a lot of computation and it is not conducive to the implementation of engineering deployment.
However, in practical engineering applications, although the specific numerical changes of the peak load of the predict object can’t be known, sometimes the load trend of the future year can be determined by relying on expert experience. Therefore, the forecasting problem of distribution network without obvious continuous trend is decomposed into two parts by taking advantage of the trend characteristics of predict object:
1) Judge whether the load of the predict object will increase or decrease in the future.
2) Forecast the load change amount of its increase or decrease.
The load data contains certain social information and load information, and the convolutional neural network (CNN) can extract representative features from the original load data and perform data representation learning. Literature (Dong et al., 2017) extracts seasonal cycle features from input data by using CNN model to carry out load forecasting. Literature (Wang et al., 2018a) uses a CNN model to extract features from historical load data, and establishes a nonlinear relationship between implicit features and users’ social attributes for attribute recognition.
For the multi-object forecasting problem, the literature (Wang et al., 2018b; Gong et al., 2019) classifies users by clustering. After classification, each group is combined into a single predict object, and the historical data of the combined object is used for forecasting. But it only focuses on the overall load, so the load forecasting results of all the predict objects can’t be obtained. Literature (Zhang and Li, 2020) connects the forecasting stage with the clustering stage through an additional feedback mechanism. The feedback mechanism returns the signal of model fitness and uses it as the clustering criterion to update the clustering members. Literature (Liu et al., 2018) divides the load trend into four categories by K-means algorithm, establishes classification rules between temperature and categories, and finally establishes XGBoost regression models for different classifications. Literature (Dong and Grumbach, 2019) takes the historical data of different predict objects as the input of the same LSTM forecasting model, and realizes the expansion of medium-and long-term forecasting data.
Therefore, this paper takes the smallest unit in the distribution network (distribution transformers) as the predict object, and forecast its maximum load in the next year. First of all, the historical load data are restored to the data in the state of natural change through the identification of the transfer load. Then the load forecasting process of distribution transformer is decoupled into two parts: load trend forecasting (growth or decline) and load change rate numerical forecasting. Meanwhile, a group objects forecasting method based on Image Representation Learning is proposed. Among them, the load trend forecasting link constructs the load data into the power load image to reflect the annual and inter-annual load changes of each distribution transformer. Under the attention mechanism, the improved convolution neural network is used to automatically extract the hidden features and forecast the load trend; In the load change rate numerical forecasting link, a Multiple Objects-Group Forecasting model based on random forest regression is proposed. It is based on the data shape to make group classification forecasting, solve the problem that there are small amount of data and large number of predict objects when single object modeling and forecasting. For different forecasting links, different methods are selected for performance analysis and comparison, the best method combination is selected. The results of the method combination in this article are compared with the current engineering methods such as Linear regression forecasting method, Fixed growth rate forecasting method, Moving average forecasting method. Experiments have proved that the method proposed in this paper can improve the overall forecasting effect by using a few feature dimensions and short time length data.
Data Preprocessing
Filling and Cleaning of Distribution Transformer Data
Since the complete daily load data is needed to construct the distribution transformer power load image, the data of the distribution transformer is filled and cleaned, such as vacancies and zero-value loads are filled and modified. For the data vacancy at the beginning and end, the trend proportion calculation method is used to complete the data. For the absence of intermediate data, methods such as Near-neighbor mean generation method, Linear interpolation non-neighbor mean generation method, Sequence and mean generation method, Cluster completion method can be used to fill the data, and outlier test and correction can be carried out. Refer to the literature (Kang et al., 2007) for specific treatment steps.
Classification of Distribution Transformer Development Stage
The classification of distribution transformer development stage determines which distribution transformers can be predicted by the method proposed in this paper. Although the distribution transformer load has no obvious continuous trend, the development stage can be roughly divided into rapid development period, fluctuating development period and mature and stable period by analyzing the information of distribution transformer operation time and load level.
The classification flow chart of distribution transformer development stage is shown in Figure 1. It is defined that the distribution transformer put into operation within the last 4 years is in rapid development period. Due to the commissioning and load release process, the maximum load of distribution transformer varies greatly in the rapid development period. It is defined that when the distribution transformer’s maximum annual load change rate for four consecutive years does not exceed 10% and the absolute load value change is less than 50 kW, it is in a mature and stable period. According to the sample analysis, the load of most distribution transformers in the mature and stable period will also not change much in the next year. In this paper, we focus on the forecasting of distribution transformers in rapid development period, and the treatment methods of distribution transformers in the other two development stages will not be described in detail.
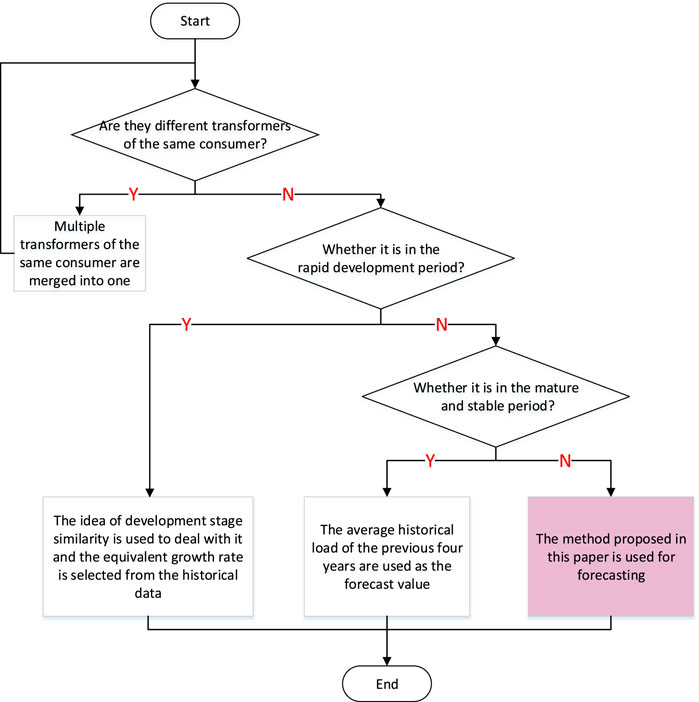
FIGURE 1. Distribution transformer classification flow chart.
Identification and Restoration of Transfer Load
In the existing historical load data, there is a variation steep peak of load maximum in the partial distribution transformers, in which there is often a load transfer phenomenon, and the load transfer between different distribution transformers will destroy the original characteristics of the load variation. Therefore, identification and restoration of transfer load is required, the processing flow is as follows:
1) Identify distribution transformers where load transfer may present. Combined with the records of load transfer events, the distribution transformer whose annual peak load decreases by more than 40% is listed as the distribution transformer with possible load transfer, also called Bus-transformer (BT).
2) Establish an adjacent distribution transformer set of each Bus Transformer. Through the GISID and the topology information table, the distribution transformers near the Bus-transformer is included in its adjacent distribution transformer set.
3) Identify the distribution transformer that takes on the load. Distribution transformer with load growth change magnitude and load mutation date similar to the Bus Transformer are found from the adjacent distribution transformer set, and determine it as Sub-transformer (ST). In this paper, the variation of the load growth of the Sub-transformer should be within the 20% error range of the variation of the load decreases of the Bus-transformer. At the same time, the load mutation time interval between the Sub-transformer and the Bus-transformer is not more than 2 weeks.
4) Combine load. By superposing the daily load data of the Bus-transformer and the Sub-transformer, a virtual distribution transformer history data is obtained for forecasting.
Forecasting Model and Principle
Improved Convolutional Neural Network
Convolutional neural network (CNN) has translation invariance when extracting image features. Among them, the convolutional layer is used to extract different features of the input, and establish mapping through nonlinear activation function. The pooling layer takes the maximum or average value of the features of the convolutional layer to achieve dimensionality reduction of data features. The fully connected layer combines all local features into global features. Since the task of CNN in this article is actually a two-classification task, the network structure is improved. SVM is used to replace the Softmax layer in original CNN, and hidden features are extracted through the Dense layer, then input into the SVM layer for load trend forecasting. Figure 2 shows the implementation process of Attention mechanism.
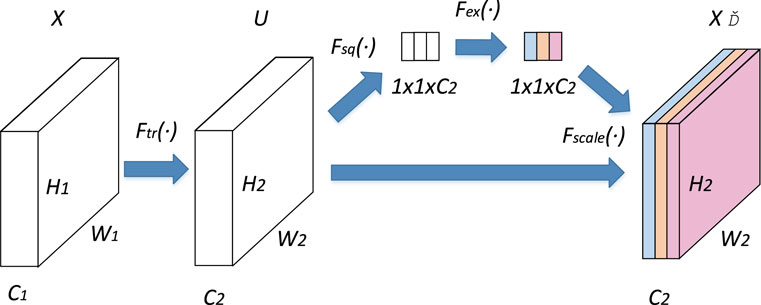
FIGURE 2. Implementation process of Attention mechanism.
Random Forest Regression
Random forest (Breiman, 2001) belongs to an ensemble learning method of Bagging. In the training stage, Bootstrap sampling is used to collect multiple different sub-training data sets from the input training data set to train multiple different decision trees in turn. By minimizing the impurity, the minimum segmentation variable and segmentation point are found. In the forecasting stage, random forest averages the forecasting results of multiple internal decision trees to get the final result.
Attention Mechanism
The Attention mechanism can simulate the human brain’s attention distribution process. By means of probability distribution, the model can focus on the important information and fully learn it. This paper implements the channel attention mechanism through the Squeeze-and-Excitation module. For convolutional mapping
The obtained global features are then fully connected in two levels, and finally limited to the range of (0, 1) with sigmoid:
Multiply the obtained activation value by the original features on the C channels of the original output U, and the result is used as the input data of the next stage:
The data of different channels have different degrees of influence on the target task. By introducing the channel attention mechanism, the weight coefficient of each channel can be automatically learned, the channel data with greater influence can be given greater attention, and the learning effect can be effectively improved.
Feature Construction of Prediction Methods
Input Feature Construction of Image Representation Learning
The annual load data of distribution transformer contains information of periodic and seasonal variation, and the load data between different years also reflects the change information of the inter-annual load level. Therefore, this paper constructs a power load image which can reflect the information of annual and inter-annual load changes. This paper needs to forecast the annual maximum load of the distribution transformer, so the construction of power load image focuses on the moment when the annual maximum load appears.
Take the daily load data of a distribution transformer for 3 years, and daily load data of 105 days (i.e., 15 weeks) are continuously selected from the annual load data. The selected data should contain the data of the maximum load day of the distribution transformer each year. Since there are 96 load data measurement time points every day, three data matrices of 105*96 are formed. Each row of data represents the load at a different time on the same day, and each column of data represents the load at the same time on a different date. When the load levels of different distribution transformers differ too much, the training effect of the model will be disturbed, so the data is normalized, and the data distribution will not be changed after normalization. The formula used for normalization is as follows:
In the formula,
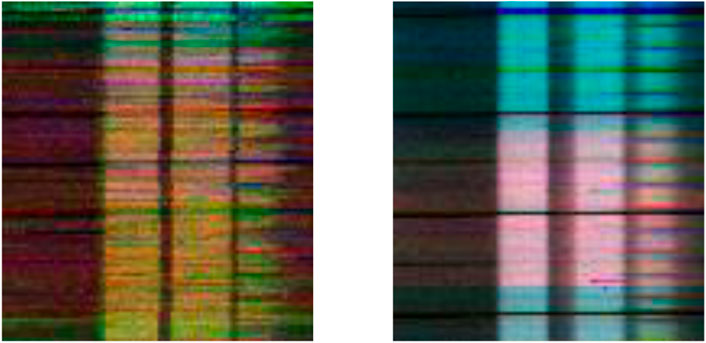
FIGURE 3. Power load images.
Feature Construction of Data Group Classification
A new concept “Load Trend Shape” (LTS) is introduced to describe the variation of annual maximum load, and define the time step for each LTS as 3 years. By comparing the relationship between the annual maximum load in each of the 3 years, the historical load data of any 3 years can be divided into the following four categories, corresponding to the four LTS:1. Continuous growth LTS; 2. Continuous decline LTS; 3. First rise and then fall LTS; 4. First fall and then rise LTS.
Figure 4 shows the annual maximum load curve of the two distribution transformers from 2008 to 2018. From 2010 to 2012, the maximum annual load of transformer A showed the first rise and then fall LTS, while that of transformer B showed the first fall and then rise LTS; From 2015 to 2017, the maximum annual load of transformer A showed the Continuous growth LTS, while that of transformer B showed Continuous decline LTS. For each LTS, there are only two load trends in the coming year: growth or decline. Therefore, the annual maximum load value in 4 years may present eight data shape, corresponding to 8 groups. Different from the aforementioned classification of distribution transformer development stage, the group classification feature is to classify the data of a certain time period, so the data of the same distribution transformer at different time periods may belong to different groups.
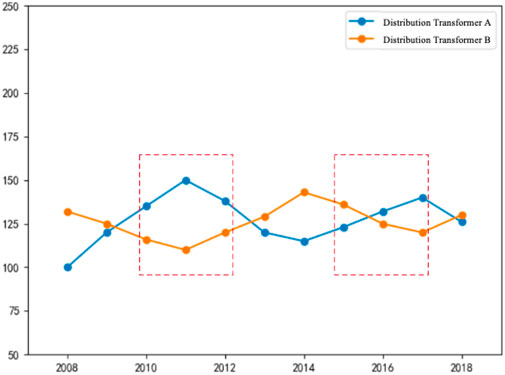
FIGURE 4. Schematic diagram of Load Trend Shape.
Due to the contingency of the annual maximum load, when extracting the annual maximum load, in order to truly reflect the maximum load level of the distribution transformer, the maximum daily load in the year of the distribution transformer was arranged in descending order, and the average value of the top five load values is selected as the annual maximum load used in the calculation of the change rate, which can effectively reduce the impact of abnormal accidents.
Input Feature Construction of Group Objects Forecasting
In the existing research on user pattern discrimination based on load data, some literature points out that there is a correlation between electricity load, population, and economic income (McLoughlin et al., 2011; Jin et al., 2014), but it is difficult to obtain the influencing factor data of the corresponding level of distribution transformer. Therefore, the economic growth rate and population growth rate of the district/county can be obtained from the statistical yearbook. Extract the maximum load of each substation under the jurisdiction of the district/county, then calculate the influence coefficient
In the formula,
The Proposed Forecasting Framework
Firstly, the load data of 4 years before the forecast year is defined as the Training Sample Data; the load data of 3 years before the forecast year is defined as the Forecasting Data. A large number of distribution transformers in the period of fluctuating development period are selected to form the distribution transformer set N, taking
The framework of the medium-and long-term load forecasting method for group objects based on Image Representation Learning is shown in Figure 5. It can be divided into two forecasting links: load trend forecasting and load change rate numerical forecasting. The distribution transformer in the distribution transformer set N can be either a training sample object or a predict object. For the same distribution transformer, in the same forecasting link, the difference between the Training Sample Data and the Forecasting Data lies in the different time of data selection; in different forecasting links, the data dimensions of the Training Sample Data and the Forecasting Data are different.
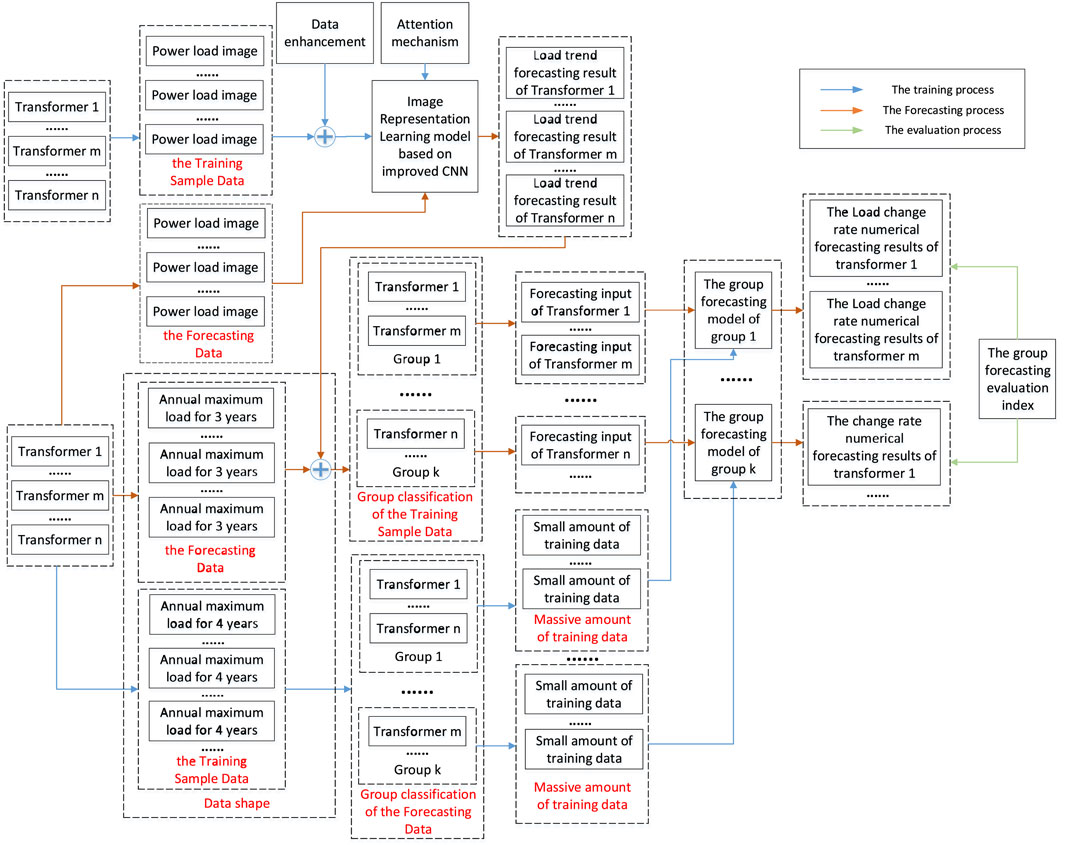
FIGURE 5. The proposed forecasting framework.
Load Trend Forecasting Based on Image Representation Learning
The load trend forecasting link uses daily dimension data. The first 3 years of data in the Training Sample Data (i.e.,
When the distribution transformer is taken as the predict object, the Forecasting Data of distribution transformer set N (
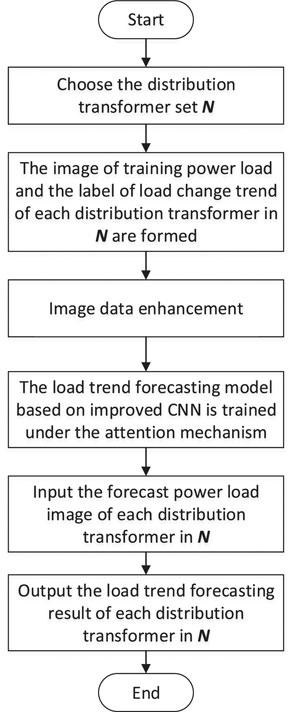
FIGURE 6. The load trend forecasting link flow chart.
Load Change Rate Numerical Forecasting of Group Objects
The load change rate numerical forecasting link uses annual dimension data. The annual dimensional data of a single distribution transformer is small, and it is difficult to model for a single distribution transformer. Therefore, a Multiple Objects-Group Forecasting model which is different from the traditional Single Object-Single Forecasting model (As shown in Figure 7) is established. By integrating the annual dimension data of a large number of objects in a certain group, the training data can be expanded.
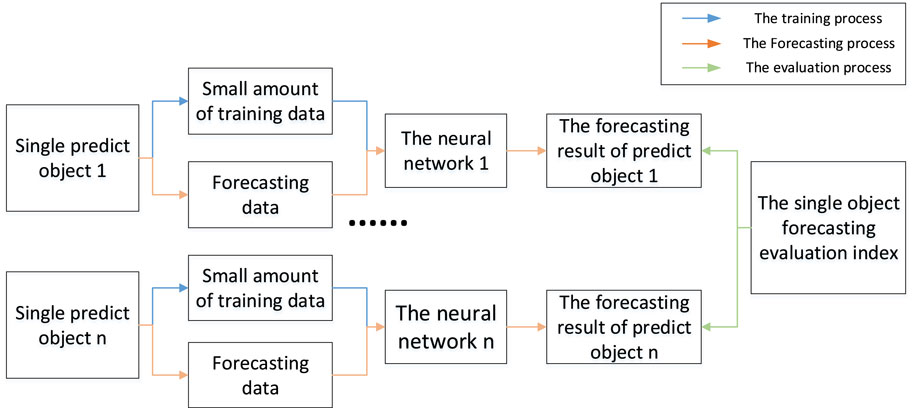
FIGURE 7. Forecasting flow chart of Single Object—Single Forecasting model.
The annual maximum load value is extracted from the Training Sample Data of distribution transformer set N, and the inter-annual load change rate is calculated. Based on the data shape formed by the LTS of the previous 3 years (T4−T2 years) and the trends (growth or decline) of the fourth year (T1 year), the Training Sample Data is divided into eight groups. From the Training Sample Data, the population change rate, economic growth rate and load change rate of the first 3 years in the power supply area where the distribution transformer is located are obtained as the input features of group objects forecasting model, and the load change rate in the fourth year is used as the training output label. Therefore, N training data can be divided into eight categories, and eight group forecasting models can be trained based on random forest regression.
When using the load change rate numerical forecasting model for group objects, we extracted the annual maximum load value from the Forecasting Data of the distribution transformer set N (T3−T1 years). Combined with the results obtained from the load trend forecasting link, the Forecasting Data shape is formed. According to the Forecasting Data shape, the corresponding group forecasting model is selected. Input the population change rate, economic growth rate and load change rate in the Forecasting Data, and output the load change rate of the distribution transformer in the forecast year. Figure 8 shows the process of The load change rate numerical forecasting link.
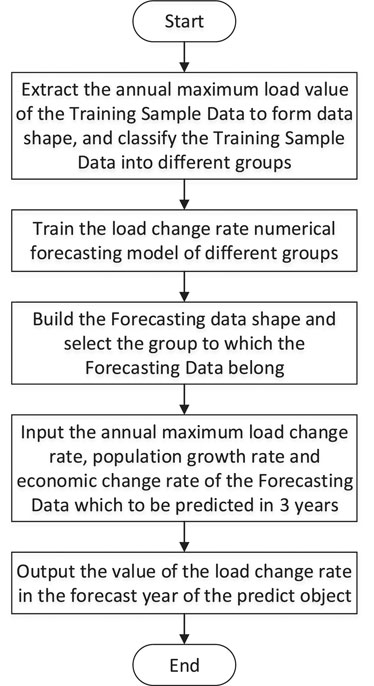
FIGURE 8. The load change rate numerical forecasting link flow chart.
For the same distribution transformer, as a training sample object, its Training Sample Data will present a data shape, which determines the group belonging of the Training Sample Data. As a forecasting object, its Forecasting Data and load trend forecasting results will present another data shape, which is often different from the former. The latter determines which group forecasting model should be selected for load change rate numerical forecasting.
Evaluation Index
Evaluation Index of Load Trend Forecasting
Take the load trend judgment accuracy as the evaluation index of the load trend forecasting link, and the load trend judgment accuracy is defined as:
In the formula,
Evaluation Index of Load Change Rate Numerical Forecasting
Due to the existence of multiple predict objects, the forecasting effect of different forecasting methods can be evaluated comprehensively from three aspects:
1) Error box diagram. Observe the overall distribution of the error of the forecasting results, compare the error aggregation interval and the median error of different methods.
2) Mean Absolute Percentage Error (MAPE). The calculation formula is:
In the formula,
3) The number of transformers forecasting results Percentage Error falling within different error intervals. The more transformers forecasting results Percentage Error that fall in the small error interval, the better the overall forecasting effect of this method.
Case Study
The data set of this paper is the load data of distribution transformers of an economically developed city in Guangdong Province from 2015 to 2019. One measurement point data is obtained in 15 min, with a total of 96 load data points per day. 5,360 distribution transformers in the fluctuating development period are randomly selected from the mature region as the training distribution transformer set N. Among the 5,360 distribution transformers, 421 distribution substations belonging to a certain 110 kV substation are selected as the predict distribution transformer set
Comparative Analysis of Load Trend Forecasting Results
Data cleaning is performed on the training distribution transformer set N, 5,360 training power load images and corresponding load change trend labels can be obtained. Through data enhancement technology, the power load images are expanded. First, through the operation of cyclic shift (Zhang et al., 2020), with a cycle of 7 days a week, the data is expanded by 14 times. Secondly, by changing the data interception time window of the power load image, the vertical translation of the power load image is realized. Finally, small random perturbations are added to load data at different measuring times. Through data enhancement technology, 700,000 training sample power load images are obtained to train Image Representation Learning model. After the training is completed, input the power load image formed by the Forecasting Data of the predict distribution transformer set object in 2016–2018, and output the forecasting result of the load trend in 2018–2019.
In the training process, the Gaussian distribution matrix with mean value of 0 and standard deviation of 0.5 is selected for the training convolution kernel initialization of the improved CNN network, the Dropout layer discard rate is 0.3, The loss function is the cross entropy function, the error term penalty coefficient of SVM layer is 1.0, and the Gaussian kernel function is selected for the kernel function. The parameter structure of the improved CNN is shown in Figure 9.
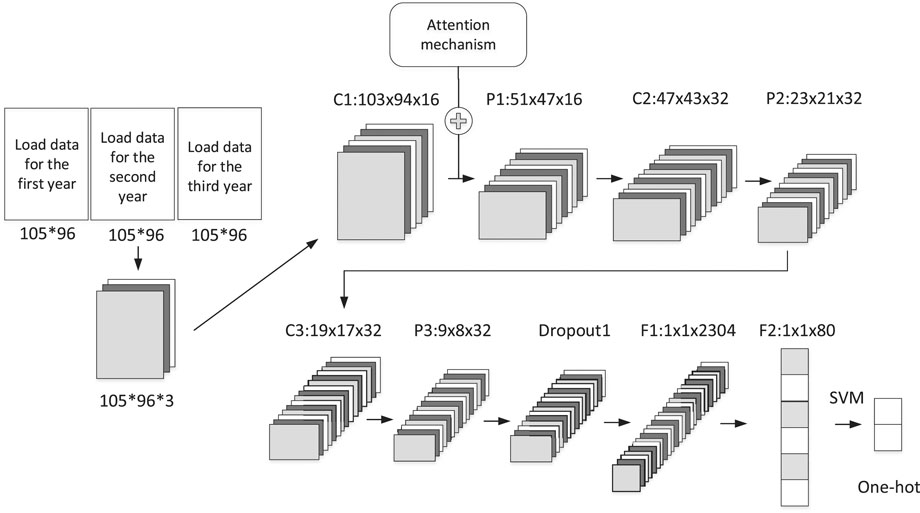
FIGURE 9. The parameter structure of the improved CNN.
In the load trend forecasting link, Attention + Improved CNN, Attention + CNN and CNN are used to build models respectively, and the load change trend judgment accuracy is compared with Linear regression forecasting method, Fixed growth rate forecasting method (3% annual growth rate), Moving average forecasting method. Among them, the last three methods calculate the load trend based on the predicted value and get the accuracy rate.
From the results in Table 1, it can be seen that the Linear regression forecasting method is affected by the overall data of the previous 3 years, and the ability to judge the load trend in the case of disorderly fluctuations is slightly weak, the accuracy rate is only 50.12%; Moving average forecasting method has the characteristic of following the load change, and its judgment of the load trend is greatly affected by the change of the previous year, and its judgment accuracy is slightly higher than the Linear regression forecasting method. The direction of load trend judgment for Fixed growth rate forecasting method is fixed, the larger the proportion of distribution transformers change in a growth state, the higher the accuracy of trend judgment accuracy, In this case, it is 57.01%. When using Image Representation Learning model, if only the original structure of CNN is used, the load trend judgment accuracy is 62.23%; Due to the establishment of power load images reflecting the annual and inter-annual load change information, its load trend judgment accuracy is slightly higher than that of the Fixed growth rate forecasting method. After adding the channel Attention mechanism, the load trend judgment accuracy increases to 66.27%; this article uses Attention + improved CNN, which can further effectively increase the load trend judgment accuracy to 67.46%, and the load trend judgment accuracy of the method proposed in this article is higher than that of other methods.
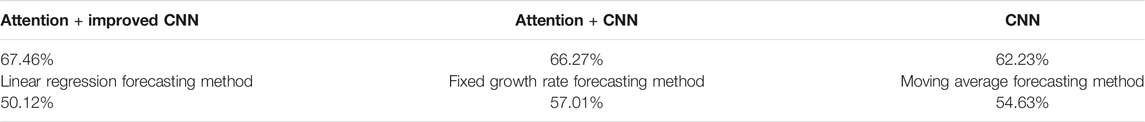
TABLE 1. The load trend judgment accuracy of various methods.
Comparative Analysis of Group Objects Numerical Forecasting Results
Based on the data shape of the Training Sample Data, the Training Sample Data is divided into eight categories. Input the annual maximum load value change rate, economic change rate and population change rate of the training distribution transformer set from 2015 to 2017, output the annual maximum load value change rate from 2017 to 2018. Therefore, eight numerical forecasting model for group objects are trained based on Random Forest Regression method. Combined with the load trend forecasting results of the distribution transformer set in 2018–2019 have been obtained, the numerical forecasting model for group objects corresponding to the data shape can be selected. Input the annual maximum load value change rate, economic change rate, and population change rate from 2016 to 2018, and output the annual maximum load change rate in 2018–2019. The experimental test shows that the model has a better forecasting effect when the number of trees in random forest is 300 and the splitting feature is 3.
When measuring the forecasting effect, the load change rate value predicted by numerical forecasting model for group objects is converted into the actual values of the annual maximum load, the absolute percentage error of each distribution transformer forecasting result can be calculated, and the error box diagram can be drawn. At the same time, calculate the Mean Absolute Percentage Error of the entire distribution transformer set, and count the number of distribution transformers in different error intervals.
Firstly, the load trend forecasting link adopts Attention + Improved CNN model to forecast, Random Forest Regression (RFR), BP neural network (BP) and Decision Tree (DTR), and Support Vector Regression (SVR) are respectively used to forecast the change rate in numerical forecasting link, and the forecasting results are compared.
It can be seen from Figure 10 that when the RFR method is used in the numerical forecasting of load change rate, the error box of the group forecasting results is lower than that of other methods. As shown in Table 2 and Table 3, the calculated Mean Absolute Percentage Error of the group forecasting results is 13.68%. In order to avoid the influence of individual large forecasting error on Mean Absolute Percentage Error, the median error of different methods are calculated. It can be seen that the median error of the RFR method is 9.65%, which is also lower than other methods.
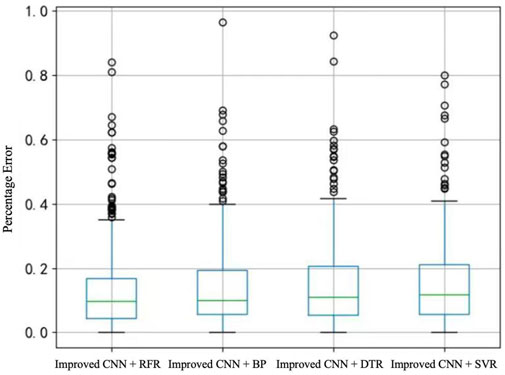
FIGURE 10. Error box diagram of forecasting results by different numerical forecasting methods.

TABLE 2. The median error of different numerical forecasting methods.

TABLE 3. The Mean Absolute Percentage Error of different numerical forecasting methods.
The group forecasting results are obtained from the load change rate numerical forecasting link, and the number of distribution transformers whose forecasting results fall in each error interval can be obtained. As shown in Table 4 and Figure 11, when RFR method is adopted, the number of forecasting errors in (0, 15%) is more than that of other methods, accounting for 69.83%. It shows that the forecasting error of most distribution transformers can be controlled in a small range. To sum up, when the performance of load trend forecasting link is consistent, the comprehensive performance of RFR method in the load change rate numerical forecasting link is better.

TABLE 4. The proportion of distribution transformer number in the error interval of 0–15%.
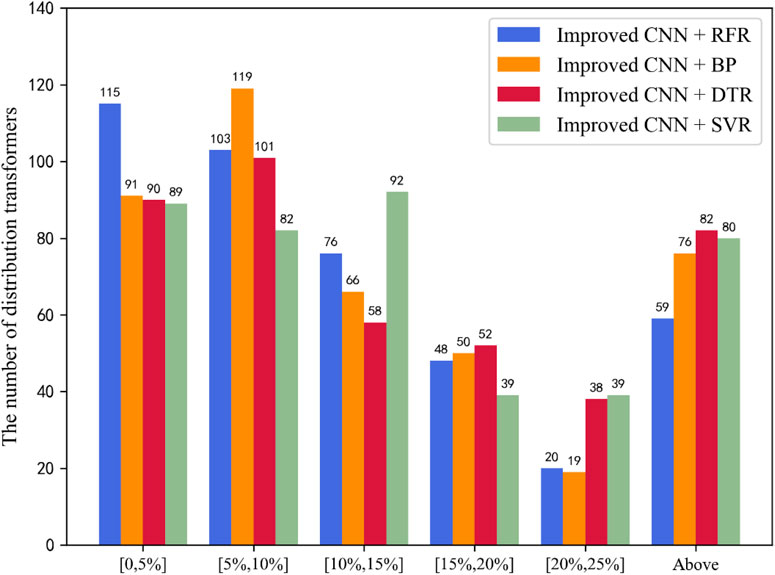
FIGURE 11. The number of distribution transformer in different error interval.
Comparative Analysis of the Overall Forecasting Results of Different Methods
After decoupled into two parts, the forecasting process can be flexibly combined with the methods which perform better under the current data distribution, so as to effectively improve the forecasting performance. Attention + Improved CNN and RFR methods are the best in their respective forecasting links, so they are combined and compared with Linear regression forecasting method, Fixed growth rate forecasting method and Moving average forecasting method applied in engineering.
As can be seen from the Figure 12, although the load trend judgment accuracy of Moving average forecasting method is higher than that of Linear regression forecasting method, the error box of the forecasting results of Moving average forecasting method is larger, indicating a larger error distribution range. The error box of Fixed growth rate forecasting method is narrower than that of Linear regression forecasting method and Moving average forecasting method, and the overall error is smaller. However, the overall error of the forecasting results of the method proposed in this paper is the smallest, and the error box is the narrowest, indicating that most of the forecasting errors are concentrated in a small error interval. From the calculation results in Table 5 and Table 6, it can be seen that the Mean Absolute Percentage Error of the method proposed in this paper is smaller, and the median error is also the smallest.
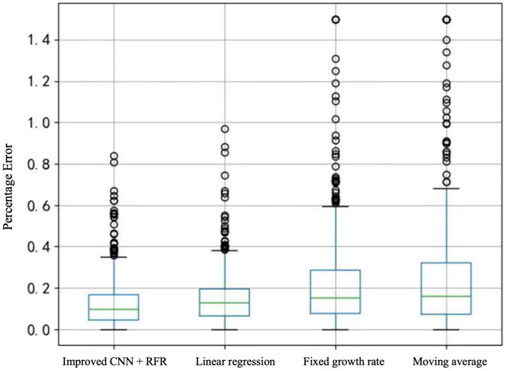
FIGURE 12. Error box diagram of forecasting results by different methods.

TABLE 5. The median error of different methods.

TABLE 6. The Mean Absolute Percentage Error of different methods.
The number of distribution transformers whose forecasting results fall in different error intervals is counted. It can be seen from Figure 13 and Table 7 that the number of forecasting results of this method in (0, 15%) small error interval is higher than other methods, accounting for 69.83%. The number of forecasting results of Fixed growth rate forecasting method in (0, 15%) accounted for 58.19%, while the number of Linear regression forecasting method and Moving average forecasting method results falling within each error interval is similar.
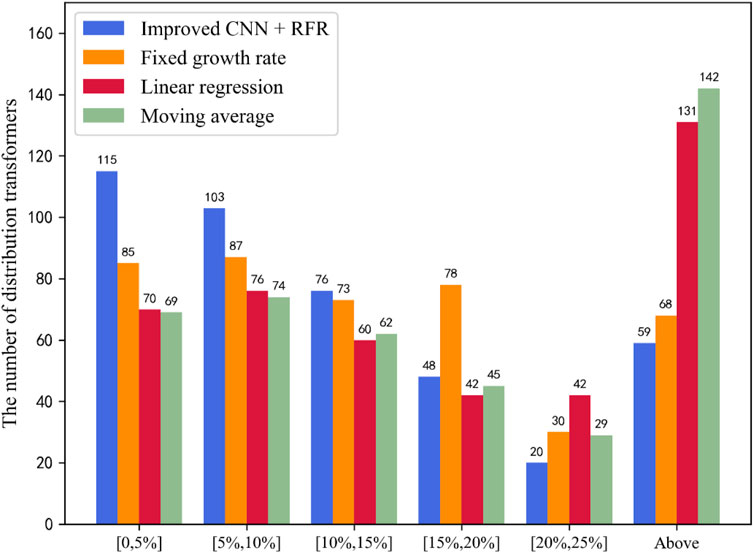
FIGURE 13. The number of distribution transformer in different error interval.

TABLE 7. The proportion of distribution transformer number in the error interval of 0–15%.
Therefore, the results show that the proposed method is superior to the existing distribution transformer forecasting methods.
Conclusion and Prospect
The medium-and long-term load forecasting of distribution transformer level has guiding significance for heavy overload warning and grid risk assessment, but the corresponding research is almost blank. Therefore, this paper proposes a medium-and long-term forecasting method for group objects based on Image Representation Learning, and this method has been piloted in the Southern Power Grid project. The method in this paper has the following advantages:
1) A new idea of decoupling forecasting is proposed to realize the decomposition of forecasting task. We can improve the forecasting methods used in different links according to different forecasting objectives, or replace the existing methods with other methods that can achieve the same prediction objectives under different data conditions, so as to realize the flexible combination of forecasting methods and improve the forecasting effect.
2) It can fully integrate and utilize the load data of daily and annual dimensions, and use the Image Representation Learning model to improve the forecasting ability of distribution transformer load trend.
3) Based on the stationarity of the overall change of group objects, the training data is expanded through data shape classification, The machine learning method of random forest regression is introduced to establish a Multiple Object-Population Forecasting model, which solves the data problem that restricts the application of machine learning method to the medium-and long-term forecasting of distribution network. At the same time, it can realizes the rapid forecasting of a large number of distribution transformation objects, and reduces the subjectivity of forecasting.
4) Compared with other medium-and long-term forecasting methods, the proposed method uses less data feature dimension and requires less recording time. By setting the forecasting process reasonably, the forecasting effect is better than the current engineering application methods.
After the group forecasting results of fine particle size are obtained, it is necessary to research on the method system of bottom-up superposition calculation, including how to reasonably solve the problem of simultaneous rate and error transfer, so as to obtain the load forecasting results of feeder, substation.
Data Availability Statement
The raw data supporting the conclusion of this article will be made available by the authors, without undue reservation.
Author Contributions
Conceptualization, DZ; Data curation, JY; Formal analysis, WG; Methodology, DZ; Project administration, DZ; Resources, TY; Visualization, WX; Writing, DZ.
Conflict of Interest
The authors declare that the research was conducted in the absence of any commercial or financial relationships that could be construed as a potential conflict of interest.
Publisher’s Note
All claims expressed in this article are solely those of the authors and do not necessarily represent those of their affiliated organizations, or those of the publisher, the editors and the reviewers. Any product that may be evaluated in this article, or claim that may be made by its manufacturer, is not guaranteed or endorsed by the publisher.
Acknowledgments
The authors gratefully acknowledge the support of The Natural Science Foundation of China- Smart Grid Joint Fund of State Grid Corporation of China (U2066212).
References
Alrashidi, M. R., and El-Naggar, K. M. (2010). Long term electric load forecasting based on particle swarm optimization. Appl. Energ. 87 (1), 320–326. doi:10.1016/j.apenergy.2009.04.024
Chang, Y.-C., and Huang, T.-C. (2018). An interactive smart grid communication approach for big data traffic. Comput. Electr. Eng. 67, 170–181. doi:10.1016/j.compeleceng.2018.03.024
Dong, M., and Grumbach, L. (2019). A Hybrid Distribution Feeder Long-Term Load Forecasting Method Based on Sequence Prediction. IEEE Trans. Smart Grid, 97–108.
Dong, X., Qian, L., and Huang, L. (2017). Short-term Load forecasting in smart grid: A combined CNN and K-means clustering approach. IEEE International Conference on Big Data & Smart Computing. New Jersey, United States: IEEE, 119–125.
Farrag, T. A., and Elattar, E. E. (2021). Optimized Deep Stacked Long Short-Term Memory Network for Long-Term Load Forecasting. IEEE Access 9, 68511–68522. doi:10.1109/access.2021.3077275
Gong, X., Cardenas-Barrera, J. L., Castillo-Guerra, E., Cao, B., Saleh, S. A., and Chang, L. (2019). Bottom-Up Load Forecasting with Markov-Based Error Reduction Method for Aggregated Domestic Electric Water Heaters. IEEE Trans. Ind. Applicat. 55 (6), 6401–6413. doi:10.1109/tia.2019.2936330
Islam, S. (2016). Digital applications in implementation of smart grid, 2016, 3–7. International Conference on Accessibility to Digital World (ICADW), Guwahati, India: Institute of Electrical and Electronics Engineers.
Jin, N., Flach, P., Wilcox, T., Sellman, R., Thumim, J., and Knobbe, A. (2014). Subgroup Discovery in Smart Electricity Meter Data. IEEE Trans. Ind. Inform. 10 (2), 1327–1336.
Kang, C., Xia, Q., and Zhang, B. (2004). Review of power system load forecasting and its development. Automation Electric Power Syst. 28 (17), 1–11.
Kang, C., Xia, Q., and Mei, L. (2007). Power System Load Forecasting. Beijing: China Electric Power Press.
Kang, J., and Zhao, H. (2012). Application of Improved Grey Model in Long-term Load Forecasting of Power Engineering. Syst. Eng. Proced. 3, 85–91. doi:10.1016/j.sepro.2011.11.012
Kaytez, F. (2020). A hybrid approach based on autoregressive integrated moving average and least-square support vector machine for long-term forecasting of net electricity consumption. Energy, 197.
Kazemzadeh, M. R., Amjadian, A., and Amraee, T. (2020). A hybrid data mining driven algorithm for long term electric peak load and energy demand forecasting. Energy, 204.
Li, Y., Han, D., and Yan, Z. (2018). Long-term system load forecasting based on data-driven linear clustering method. J. Mod. Power Syst. Clean. Energ. 6 (2), 306–316. doi:10.1007/s40565-017-0288-x
Liu, Y., Luo, H., and Zhao, B. (2018). Short-Term Power Load Forecasting Based on Clustering and XGBoost Method. 2018 IEEE 9th International Conference on Software Engineering and Service Science. Beijing, China: ICSESS. doi:10.1109/icsess.2018.8663907
McLoughlin, F., Duffy, A., and Conlon, M. (2011). Characterising domestic electricity consumption patterns by dwelling and occupant socio-economic variables: An Irish case study. Energy & Buildings 43 (1), 240–248.
Munshi, A. A., and Mohamed, Y. A.-R. I. (2017). Big data framework for analytics in smart grids. Electric Power Syst. Res. 151, 369–380. doi:10.1016/j.epsr.2017.06.006
Sun, W., and Zhao, W. (2010). Mid-long term power Load forecasting Based on MG-CACO and SVM method. 2010 2nd International Conference on Future Computer and Communication, V1-118–V1-121.
Wang, Y., Chen, Q., Gan, D., Yang, J., Kirschen, D. S., and Kang, C. (2018). Deep Learning-Based Socio-demographic Information Identification from Smart Meter Data. IEEE Trans. Smart Grid, 1, 1.
Wang, Y., Chen, Q., Sun, M., Kang, C., and Xia, Q. (2018). An Ensemble Forecasting Method for the Aggregated Load with Subprofiles. IEEE Trans. Smart Grid 9 (4), 3906–3908. doi:10.1109/tsg.2018.2807985
Wen, Z., Xie, L., Fan, Q., and Feng, H. (2020). Long term electric load forecasting based on TS-type recurrent fuzzy neural network model. Electric Power Syst. Res. 179, 106106. doi:10.1016/j.epsr.2019.106106
Xi, L., Yu, T., Yang, B., Zhang, X., and Qiu, X. (2016). A wolf pack hunting strategy based virtual tribes control for automatic generation control of smart grid. Appl. Energ. 178, 198–211. doi:10.1016/j.apenergy.2016.06.041
Yang, B., Jiang, L., Yao, W., and Wu, Q. H. (2015). Perturbation estimation based coordinated adaptive passive control for multimachine power systems. Control. Eng. Pract. 44, 172–192. doi:10.1016/j.conengprac.2015.07.012
Zhang, C., and Li, R. (2020). A Novel Closed-Loop Clustering Method for Hierarchical Load Forecasting. IEEE Trans. Smart Grid (99), 1, 1.
Zhang, K., Cao, Z., and Wu, J. (2020). Circular Shift: An Effective Data Augmentation Method For Convolutional Neural Network On Image Classification. IEEE International Conference on Image Processing. Ontario: ICIP. doi:10.1109/icip40778.2020.9191303
Zhang, X., Tan, T., Zhou, B., Yu, T., Yang, B., and Huang, X. (2021). Adaptive distributed auction-based algorithm for optimal mileage based AGC dispatch with high participation of renewable energy. Int. J. Electr. Power Energ. Syst. 124, 106371. doi:10.1016/j.ijepes.2020.106371
Zhang, X., Yu, T., Yang, B., and Li, L. (2016). Virtual generation tribe based robust collaborative consensus algorithm for dynamic generation command dispatch optimization of smart grid. Energy 101, 34–51. doi:10.1016/j.energy.2016.02.009
Keywords: distribution network, medium-and long-term load forecasting, image representation learning, group objects, data shape
Citation: Zhang D, Guan W, Yang J, Yu H, Xiao W and Yu T (2021) Medium—And Long-Term Load Forecasting Method for Group Objects Based on the Image Representation Learning. Front. Energy Res. 9:739993. doi: 10.3389/fenrg.2021.739993
Received: 12 July 2021; Accepted: 20 July 2021;
Published: 26 August 2021.
Edited by:
Bo Yang, Kunming University of Science and Technology, ChinaReviewed by:
Yiyan Sang, Shanghai University of Electric Power, ChinaYixuan Chen, The University of Hong Kong, Hong Kong, SAR China
Copyright © 2021 Zhang, Guan, Yang, Yu, Xiao and Yu. This is an open-access article distributed under the terms of the Creative Commons Attribution License (CC BY). The use, distribution or reproduction in other forums is permitted, provided the original author(s) and the copyright owner(s) are credited and that the original publication in this journal is cited, in accordance with accepted academic practice. No use, distribution or reproduction is permitted which does not comply with these terms.
*Correspondence: Tao Yu, dGFveXUxQHNjdXQuZWR1LmNu