 Stefan Pielsticker
 Benjamin Gövert1
 Kentaro Umeki
- 1Institute of Heat and Mass Transfer (WSA), RWTH Aachen University, Aachen, Germany
- 2Division of Energy Science, Department of Engineering Sciences and Mathematics, Luleå University of Technology, Luleå, Sweden
Biomass is a complex material mainly composed of the three lignocellulosic components: cellulose, hemicellulose and lignin. The different molecular structures of the individual components result in various decomposition mechanisms during the pyrolysis process. To understand the underlying reactions in more detail, the individual components can be extracted from the biomass and can then be investigated separately. In this work, the pyrolysis kinetics of extracted and purified cellulose, hemicellulose and lignin are examined experimentally in a small-scale fluidized bed reactor (FBR) under N2 pyrolysis conditions. The FBR provides high particle heating rates (approx. 104 K/s) at medium temperatures (573–973 K) with unlimited reaction time and thus complements typically used thermogravimetric analyzers (TGA, low heating rate) and drop tube reactors (high temperature and heating rate). Based on the time-dependent gas concentrations of 22 species, the release rates of these species as well as the overall rate of volatiles released are calculated. A single first-order (SFOR) reaction model and a 2-step model combined with Arrhenius kinetics are calibrated for all three components individually. Considering FBR and additional TGA experiments, different reaction regimes with different activation energies could be identified. By using dimensionless pyrolysis numbers, limits due to reaction kinetics and heat transfer could be determined. The evaluation of the overall model performance revealed model predictions within the ±2σ standard deviation band for cellulose and hemicellulose. For lignin, only the 2-step model gave satisfying results. Modifications to the SFOR model (yield restriction to primary pyrolysis peak or the assumption of distributed reactivity) were found to be promising approaches for the description of flash pyrolysis behavior, which will be further investigated in the future.
1 Introduction
As fixed in the Paris agreement, the majority of the world’s countries have committed themselves to reduce their anthropogenic greenhouse gas emissions in order to reach the goal of at most 1.5°C temperature increase compared to the pre-industrial level. The replacement of fossil fuels by biomass-derived renewable alternatives represents one key element in many decarbonization strategies. Typical fields of application for biomass are the substitution of coal in large-scale power plants and other carbon-based processes such as cement or iron production [all three compatible with technologies for bioenergy with carbon capture and storage (BECCS) integration] and the substitution of liquid fuels such as gasoline or jet fuels in the mobility sector (Intergovernmental Panel on Climate Change, 2018).
Pyrolysis—the thermal decomposition in the absence of oxygen—occurs in all processes, whether as a sub-step of combustion or as a stand-alone process for biofuel production. The process parameters define the product composition: The liquid bio-oil yield can be maximized by applying high heating rates, moderate temperatures and short gas residence times, while higher temperatures and longer residence times favor higher gas yields and slow heating at low temperatures results in higher char yields (Bridgwater, 2012). A fundamental understanding of the underlying chemical reactions during biomass pyrolysis forms the basis of model developments required for the design and optimization of industrial-scale processes (Hameed et al., 2019).
Lignocellulosic biomass consists of the three components cellulose, hemicellulose and lignin which, in total, account for more than 90% of the dry mass. The remaining fraction is composed of organic extractives (e.g. resins, tannins, phenols, waxes, lipids and proteins) and inorganic mineral components Debiagi et al. (2015). To reduce the complexity of biomass pyrolysis, one of the three basic components can be extracted from raw biomass and investigated separately.
Overall volatile and specific light gas yields have been studied at different temperature ranges using thermogravimetric analysis (Yang et al., 2007; Yu et al., 2017), tube furnaces (Lv et al., 2013; Carrier et al., 2017) or a drop tube reactor (Trubetskaya et al., 2020). While there is a consensus regarding the higher char yields for hemicellulose and lignin compared to cellulose, the volatiles of cellulose pyrolysis were either found as condensate (e.g. levoglucosan) (Lv et al., 2013; Yu et al., 2017) or gas (Trubetskaya et al., 2020) depending on temperature and residence time. Main light gases have been identified as CO for cellulose, CO2 for hemicellulose and CH4 for lignin. For flash pyrolysis conditions, a sufficient superposition of the basic components could be achieved to predict the behavior of real biomass (Zhang et al., 2015; Trubetskaya et al., 2020).
Systematic studies on the reaction kinetics including all three components and an analysis of potential interactions have been undertaken only with TGA (Liu et al., 2011; Zhou et al., 2013; Zhao et al., 2018; Zhu and Zhong, 2020). The corresponding temperature of the maximum release rate increases from hemicellulose to cellulose to lignin while the peak rate decreases from cellulose over hemicellulose to lignin. While Zhu and Zhong (2020) and Zhou et al. (2013) observed a suitable superposition for synthetically mixed samples, Liu et al. (2011) and Zhao et al. (2018) identified significant interactions in the hemicellulose/lignin mixture (Liu et al. (2011) additionally in the cellulose/hemicellulose mixture and Zhao et al. (2018) additionally in the cellulose/lignin mixture, respectively). Further on, Zhou et al. (2013) obtained an increasing variety of extracted basic components from cellulose to hemicellulose to lignin which can be traced back to their molecular structure. To the authors’ best knowledge, there is no study on reaction kinetics that includes all three components and is carried out at flash pyrolysis conditions (high heating rate, high temperature).
Hameed et al. (2019) review the current state of biomass pyrolysis modeling. The authors point out, that most of the models assume a superposition of the three pseudo-components cellulose, hemicellulose and lignin with independent reaction progress and no interaction between either educts or products. This assumption may lead to deviations, since in real biomass, interactions between the components may occur during the reaction progress. Interactions may also be influenced by catalytically active minerals (Hameed et al., 2019). Studies from Couhert et al. (2009a), Couhert et al. (2009b) demonstrate two essential findings: It is neither possible to extract lignocellulosic basic components with the same properties from different types of biomass, nor to predict the pyrolysis product yields of mixed samples through superposition of product yields from the pseudo-components. The authors attribute this to interactions between the reaction products occurring in the gas phase (and partly inside the particle) as well as minerals in the particle acting as catalysts (Couhert et al., 2009b).
The present study aims to quantify the kinetic behavior of the extracted biomass basic components cellulose, hemicellulose and lignin individually under flash pyrolysis conditions realized by a small-scale fluidized bed reactor. The experimentally obtained volatile release behavior is modeled with either the single first-order reaction model or a more complex 2-step model with intermediate species formation. Kinetic parameters of additional TGA experiments are used to evaluate limitations due to either reaction kinetics or heat transfer. A final holistic model performance analysis evaluates the model prediction quality and forms the basis for assessing whether the derived kinetics parameters can describe the pyrolysis behavior of the individual components. The generated data set also forms the basis for future investigations of whether real biomass flash pyrolysis kinetics can be modeled via superposition of the isolated basic components.
2 Material and Methods
2.1 Lignocellulosic Components
To better understand biomass pyrolysis, the three main components of biomass—cellulose, hemicellulose and lignin—are investigated separately. For this purpose, extracted and purified components have been purchased from commercial suppliers. Cellulose (product number: 22182, Sigma Aldrich) was produced from spruce by acid washing with a final purity of >99.99%. Xylan from beechwood (purity >95%) was used as a model compound for hemicellulose (Product code: P-XYLNBE, Megazyme Ltd.). Alkali lignin was purchased from Sigma Aldrich (product number: 370959).
The pulverized materials were classified into different mesh size fractions, whereof the size fraction 90–125 µm was used for the pyrolysis experiments in the FBR. Due to the limited availability of sample material for xylan, only the size fraction 60–90 µm could be used. Table 1 provides information from ultimate, proximate and microscopic particle size analysis for all three components.
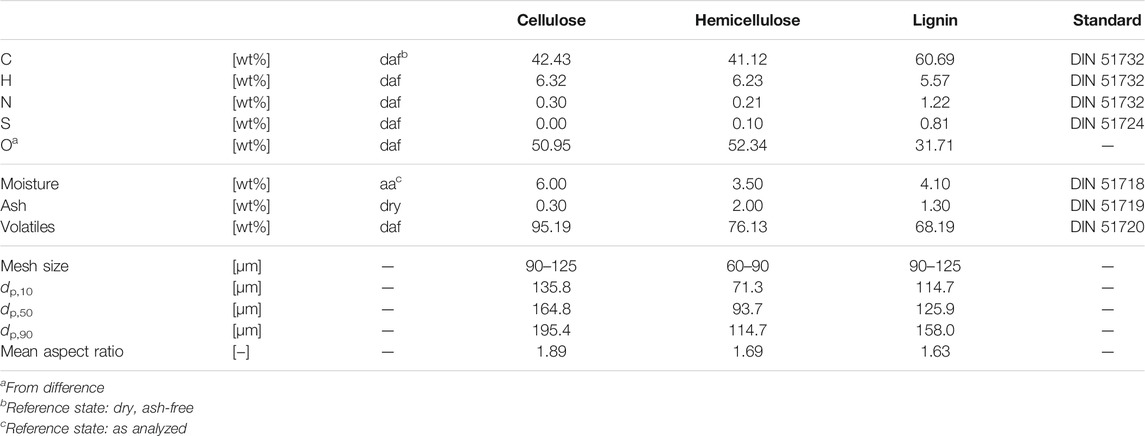
TABLE 1. Physical and chemical properties of investigated lignocellulosic particles according to ultimate, proximate and microscopic particle size analysis.
2.2 Thermogravimetric Analysis
The pyrolysis kinetics of lignocellulosic components for low temperature and heating rate conditions are determined by thermogravimetric analyses (TGA) with a TGA8000 from PerkinElmer Inc. Pulverized particles with the size below 75 µm are used to minimize the deviation from the intrinsic kinetics due to the limitation in heat conduction. Around 0.8–1.2 mg of sample mass is loaded and spread at the bottom of an alumina crucible (7 mm diameter and 2 mm height) as a thin layer to minimize the effect of bulk diffusion. The reaction analyzer is purged with N2 (purity >99.996%) in the vertical direction down to the crucible through the balance chamber. The gas flow rate is kept constant at 50 ml min−1 at standard conditions (25°C and 105 kPa). The sample is heated from 303 to 1173 K with a constant heating rate of 5 K min−1.
2.3 Fluidized Bed Reactor
In the fluidized bed reactor (FBR), the pyrolysis kinetics are derived from the time-resolved volatile release rate. The release rate is calculated from a mass balance around the system. For this balance, the gas inflow is regulated and the exhaust gas species concentrations are continuously measured using a Fourier-transform infrared spectrometer. The FBR combines high particle heating rates around 104 K s−1 with moderate temperatures in the range from TFB = 573–973 K.
A sketch of the reactor system can be found in Figure 1. The reactor itself consists of two coaxial, vertically mounted ceramic pipes positioned in an electrically heated furnace. The fluidized bed, representing the reaction zone at position ①, is generated by a nitrogen gas flow passing through a porous sintered glass plate. The bed is formed by inert Al2O3 particles in the size range of 112–180 µm. The empty volume above the bed is blocked by a ceramic filling to suppress diffusion processes and to guarantee a quick transport of all gases from the reaction zone to the gas analyzer. The reactor temperature is regulated through the electric furnace and is continuously monitored with a thermocouple immersed in the bed, to ensure constant and homogeneous reaction conditions.
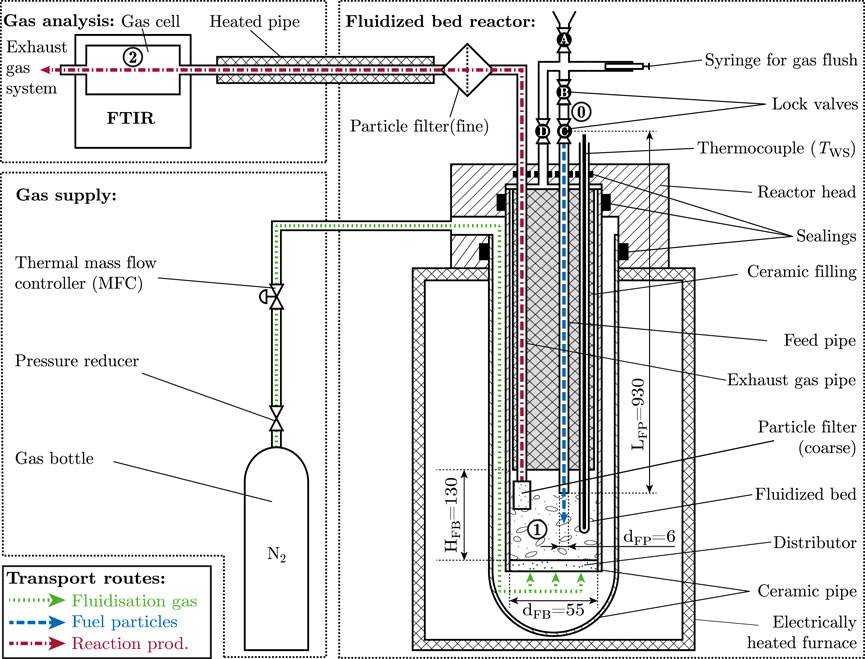
FIGURE 1. Sketch of the fluidized bed reactor setup with transport routes of fluidizing gas, fuel particles and reaction products: Fuel particles are injected from the lock and react inside the reaction zone ①. The reaction gases are analyzed ex situ.
Small amounts of fuel (15–50 mg) are injected batch-wise into the fluidized bed from the top. To ensure a consistent and controlled atmosphere in the reactor, the fuel is introduced through a double-lock system (position ⓪), which is purged at each time with gas from the fluidized bed before injection. To enhance the transport of all fuel particles from the lock to the reaction zone, a gas flush of 40 ml N2 is used. This reduces the sticking of particles to the feed pipe walls and reduces residence times under non-isothermal boundary conditions during the feed process. Particles arrive in the bed approximately 150 ms after feeding has been initiated and instantly start to devolatize. Released gaseous reaction products mix with the fluidizing gas and the gas mixture leaves the reactor through the exhaust gas pipe.
The full gas flow is analyzed with an Agilent Cary 670 Fourier-transform infrared (FTIR) spectrometer at position ②. The FTIR is equipped with a PIKE Technologies gas cell with 2.4 m optical path length and 100 ml volume. The cell and the exhaust gas pipe connecting it to the reactor are heated to a temperature of 453 K to prevent tar and water vapor condensation within the equipment. The infrared spectra are recorded with a frequency of 10 Hz and a spectral resolution of 4 cm−1 before being analyzed in the wavenumber region from 600 to 6500 cm−1 using multivariate regression analysis. The regression analysis relies on measured reference spectra of single species with known volume fractions to determine the pyrolysis gas composition φi(t) for 22 different gas species (Pielsticker et al., 2017).
Based on the measured volume fractions and a mass balance around the reactor system, the volatile release rate can be derived with Equation 1, which on the right hand side is structured in three terms:
The first term contains constants (N2 density at standard conditions
Further details on the reactor setup, its implicit limits and the execution of experiments (Pielsticker et al., 2019a), the evaluation routine (Gövert et al., 2017; Pielsticker et al., 2019a), as well as the imposed limits of the gas transport on the detectable reaction rates (Pielsticker et al., 2018a; Pielsticker et al., 2019a), can be found in the given references.
2.4 Modeling
Two empirical models of different complexity are used to approximate the pyrolysis process of biomass and its basic components: The single first-order reaction (SFOR) model and the two-step model with intermediate formation (2-step). As the decomposition of biomass is a very complex process with more than several hundred reactions and species being involved, both empirical models are not able to describe the pyrolysis process in detail. Nonetheless, the models can adequately approximate the volatile release characteristics as shown in previous studies (Ontyd et al., 2020; Pielsticker et al., 2018b; Pielsticker et al., 2019a). Both models can be calibrated using data from the ex-situ gas analysis. Model types that require information regarding the time-dependent change of the solid phase are not applicable for the FBR setup as char sampling during the pyrolysis process is not possible. Empirical pyrolysis models with a limited number of equations bring the advantage of low numerical effort and thus are frequently used in large-scale CFD simulations (e.g. Nicolai et al. (2020)).
2.4.1 Single First-Order Reaction (SFOR) Model
The single first-order reaction model describes pyrolysis as a direct decomposition of the solid into volatiles via a single-step reaction path (cmp. Figure 2). The release rate of volatiles
at time t is given by the characteristic reaction rate rSFOR and the reaction potential is given by the difference of the current char mass fraction ychar and char mass fraction at completed pyrolysis ychar,∞. Instead of using the constant proximate analysis value (cf. Table 1), a temperature-dependent model is used to describe the final volatile yield ychar,∞ (cf. section 3.1). Taking into account the mass balance of the particle, the volatile and char mass fractions are linked:
The temperature dependency of the characteristic reaction rate is modeled via an Arrhenius approach
with the pre-exponential factor Ai, the activation energy Ea, i and the universal gas constant R. The i denotes that the approach is not only used for the SFOR model but also for the primary and secondary reaction rates in the following 2-step model.

FIGURE 2. Reaction scheme of SFOR and 2-step model.
2.4.2 Two-step Model With Intermediate Species Formation (2-Step Model)
The empirical two-step model with intermediate species formation (2-step model) is a two-step pyrolysis model with a total of three different components. In the primary reaction step, both primary volatiles and an intermediate are formed from the solid with the primary reaction rate rprim. The intermediate species is then decomposed into secondary volatiles in the secondary pyrolysis step with the reaction rate rsec (cmp. Figure 2).
The temperature-dependent factor ϕint(T) indicates the proportion of intermediate in relation to the total pyrolysis products. The reaction rate rsec, which is decisive for decomposition of intermediate, is determined at the particle temperature TP. The secondary decomposition step is therefore not equal to the tar cracking described in many multi-step models, for which the gas temperature TG is relevant (Di Blasi, 2008). Rather, the intermediate resembles the metaplast bound in the particle comparable to formulations found in pyrolysis network models such as the CPD model (Fletcher et al., 1992). The volatiles resulting from the secondary reaction step can be calculated via the differential equation
Combined with the primary volatile components, they form the sum of released pyrolysis products.
3 Results
The following sections present the results of the pyrolysis experiments focussing on the final volatile yield (section 3.1), the gas composition (section 3.2), modeling of reaction kinetics via the SFOR model (section 3.3) and the 2-step model (section 3.4), and the overall modeling accuracy (section 3.5) combining yield and kinetic modeling.
3.1 Final Yield
Figure 3 shows the final volatile yield yvol,∞,i(T) of the three components cellulose, hemicellulose and lignin at different temperatures determined by integrating Equation 1 over the full range t ∈ [0, ∞]. In the practical application, the experiment is stopped when the measured concentrations fall below a certain threshold. While for cellulose and hemicellulose, the gas concentrations level out around zero, for lignin the concentrations of H2O, CO2, and CO stay constantly above zero indicating that decomposition reactions still take place. As a consequence, the calculated “final yield” can strongly depend on the integration time and should thus be treated with caution. This effect is also visible in the peak yield shown in Figure 3: the mass fraction of the primary reaction peak (yvol,exp,peak) sometimes accounts for less than 50% of the total mass released.
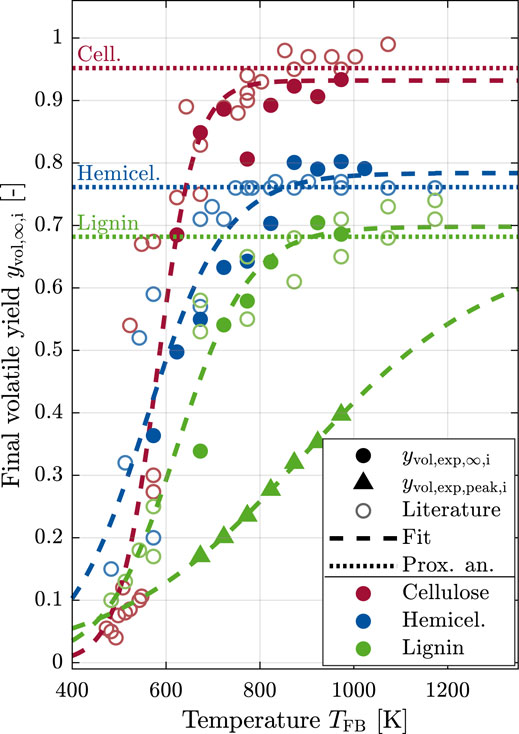
FIGURE 3. Final volatile yield determiend in the FBR as a function of temperature: Own data marked with filled symbols, while literature data is depicted with open symbols. All data is used for the calibration of the modified logistic distribution function. Literature references: Cellulose: Piskorz et al. (1986), Wang et al. (2017), Chen et al. (2018), Shen et al. (2010), Broido and Nelson (1975), Ansari et al. (2019), Hemicellulose: Piskorz et al. (1986), Wang et al. (2017); Chen et al. (2018), Shen et al. (2010), Broido and Nelson (1975), Ansari et al. (2019), Lignin: Shen et al. (2010), Lv et al. (2013), Chen et al. (2018).
For all three components, the total yield of volatile products increases with temperature, showing a degressive characteristic approaching the volatile yield of the proximate analysis. Typically, yields from fast pyrolysis are slightly above the volatile content from the proximate analysis. Thus, a small increase is expected for temperatures above the current range. The final mass fractions experimentally determined in this work are within the scatter band of measured data available in the literature for comparatively fast pyrolysis1 of cellulose, hemicellulose and lignin.
For modeling the temperature-dependent final volatile release, a modified logistic distribution function
is used, whose coefficients C1–C5 are determined by minimizing the squared errors between the model and the experimental data (own experiments and literature) and are summarized in Table 2. Using also experimental data from literature—especially in the low-temperature region—is necessary to obtain stable fit results. The corresponding curve in Figure 3 shows that the model can adequately represent the temperature dependence of the final volatile release (R2 = 0.892, 0.832, and 0.946 for cellulose, hemicellulose and lignin) and that the model also allows stable extrapolations for higher and lower temperatures.
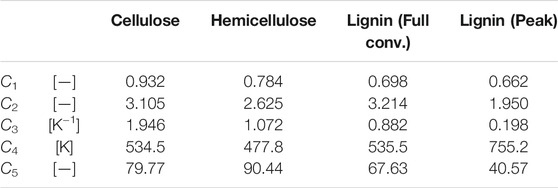
TABLE 2. Parameters of modified logistic function fit to approximate final volatile yield.
3.2 Product Composition
The mass fractions of the analyzed light gas species are summarized in Figure 4. As evident from the figure, H2O, CO2, and CO constitute the largest yield fractions for all three fuels at all temperatures. This is not surprising, considering that (hemi-)cellulose comprises around 50 wt% oxygen and lignin about 30 wt% (cmp. fuel analysis in Table 1). Hence, many of the complex hydrocarbon molecules cracked during pyrolysis are instantly attacked by oxygen radicals also formed in this process and thereby oxidized. The absolute yields of H2O and CO2 (not shown in Figure 4) fluctuate between experiments and operating points but show no clear trend with temperature. As the absolute yields of most other gases, including CO and CH4, increase with temperature, the combined yield fractions of H2O and CO2 show a slow and steady decline over T.
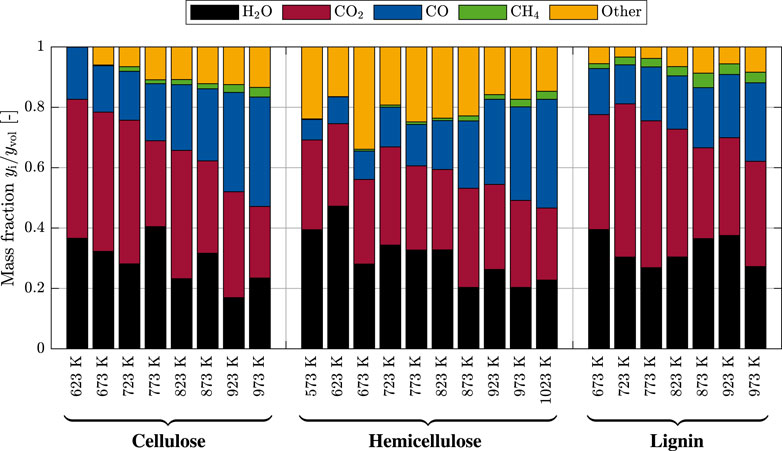
FIGURE 4. Relative volatile composition of cellulose, hemicellulose and lignin detected at different bed temperatures in the FBR.
The absolute and relative yields of CH4 are similar for cellulose and lignin, while hemicellulose releases less CH4 at all temperatures and especially below 873 K. The combined yield fraction of other gases—mostly short-chained hydrocarbons—is highest for hemicellulose, followed by cellulose and then lignin. For the latter two, the fractional and the absolute yield of other gases increase with temperature, while they stagnate for hemicellulose.
Comparing the results presented in Figure 4 with literature is not trivial. The available literature revolving around “fast pyrolysis” is using very different experimental setups, ranging from tube furnaces (Lv et al., 2013) over fixed beds and Py-GC/MS devices (Zhao et al., 2018) to TGAs and film or wire mesh heaters (Hoekstra et al., 2012; Ansari et al., 2019). Heating rates in those experimental setups vary over a wide range and are often significantly lower than those achieved in the FBR used in this study—ranging from 1 to 100 K min−1 in TGAs over estimated 10000 K min−1 in tube furnaces (Lou and Wu, 2011) to as high as 7000 K s−1 on a wire mesh (Hoekstra et al., 2012). Data on water and hydrogen yields are often missing in the reported datasets.
Nonetheless, global trends are often comparable: Lv et al. (2013) report the same order for CH4 yields at 873 K and above, where yCH4,Lig > yCH4,Cel > yCH4,Hem. Lv et al. (2013) and Zhou et al. (2014) equally find, that the CO yield is highest for cellulose. Lv et al. (2013) further reports that the yields of short-chained hydrocarbons are small below 873 K but continuously increase with temperature, as found in this work. Concerning CO2 yields, there is no consensus amongst the sources listed in this chapter: some report continuous increases with temperature (Scott et al., 1988; Lv et al., 2013), others report CO2 yield maxima around 773–873 K for one or multiple of the investigated biomass components (Lou and Wu, 2011; Lv et al., 2013). It is unclear whether these differences are attributable to different primary decomposition steps or an effect of secondary gas-phase reactions.
3.3 Single First-Order Reaction Model
As outlined in section 2.4, the single first-order reaction model has one adjustable parameter, the characteristic reaction rate rSFOR at a given reaction temperature. If this dependency is modeled using an Arrhenius approach (Equation 4), the modeling is based on two parameters, the pre-exponential factor A and the activation energy Ea. The following two sections illustrate how those kinetic parameters are determined from the experimental results obtained in the TGA and FBR setups.
3.3.1 Thermogravimetric Analyzers
Figure 5 shows the solid conversion rates of the three extracted species measured individually under constant heating rate conditions. The diversity of available chemical bonds in the material influences the peak height and the onset temperature of the reaction. The linear polymer cellulose with the lowest number of different bonds shows the sharpest peak and the latest onset of reaction. With the increasing complexity of the molecular structure and corresponding increase of bond strength diversity from cellulose over hemicellulose to lignin, the onset temperature shifts towards lower temperatures and the entire conversion process takes place over a broader temperature range while at the same time the observed maximum mass loss intensity decreases.
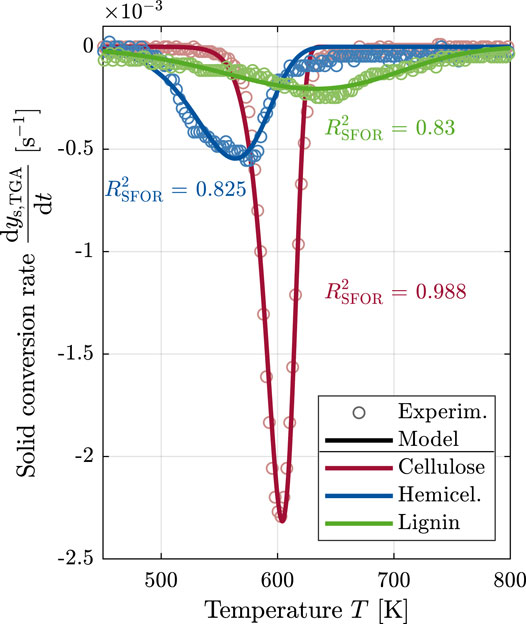
FIGURE 5. Solid conversion rates obtained via TGA at a constant heating rate of 5 K min−1 in comparison with the fitted model prediction from the SFOR model combined with an Arrhenius approach.
In the TGA experiments, the pre-exponential factor A and the activation energy Ea are determined by a direct fitting procedure. Thereby, the combination of the SFOR model (Equation 2) and the Arrhenius approach (Equation 4) is solved numerically to calculate ychar(t), then differentiated and finally compared with experimental data in a least-squares procedure. Obtained best-fitting values for all three components are listed in Table 3 and will be discussed and compared to literature data in section 3.3.3 together with the FBR-derived kinetic parameters.
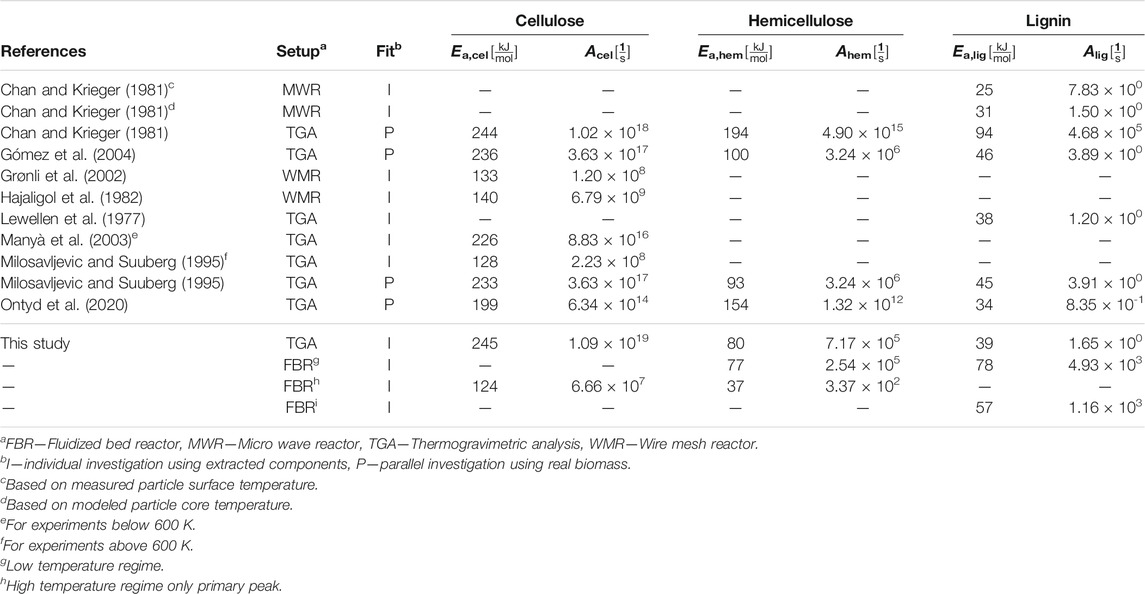
TABLE 3. Kinetic parameters of the SFOR model derived from TGA and FBR in comparison with literature data of pure extracted components (individial fit—I) or real biomass (parallel fit—P).
3.3.2 Fluidized Bed Reactor
The determination of kinetic parameters from the FBR experimental data is a two-step process: In the first step, the characteristic reaction rate r is determined via a least-squares fit algorithm for every single experiment. In the second step, the mean r-values of experiments at each temperature are used to calculate the activation energy and the pre-exponential factor which describe the evolution of r over T.
Figure 6 shows exemplarily the experimental volatile release rate of one single experiment measured individually at a fixed reactor temperature of TFB = 773 K for all three components. The solid lines represent the best-fitting approximation by the SFOR model fitted to the shown experiment. For all experiments, a constant reaction temperature of TFB is assumed over time. As the reaction zone (position ① in Figure 1) and the gas analysis (position ②) are separated, gas transport and mixing effects have to be considered with a convolution approach based on the theory from Abad et al. (2005) with more details given in Pielsticker et al. (2019a).
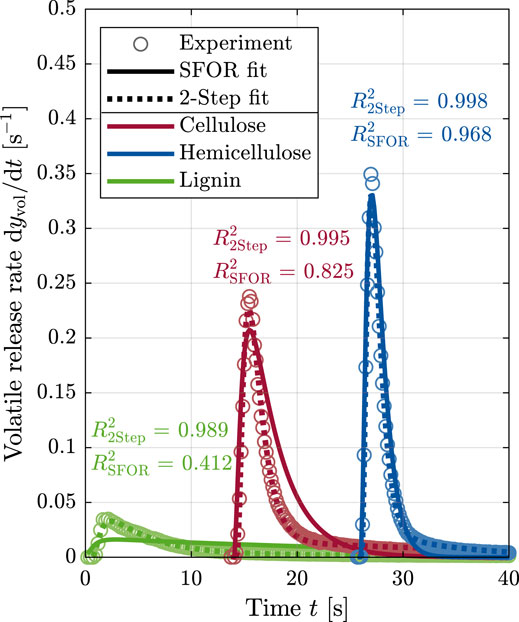
FIGURE 6. Experimentally derived volatile release rates in the FBR at TFB = 773 K with the least-squares fit approximation given by SFOR and 2-step model (experiments individually shifted in time for better readability).
The curves for the three different components reveal a typical shortcoming of the SFOR model: The fit quality strongly depends on the obtained peak shape. The sharper the observed peak and the lower the intensity in the post-peak period, the better the SFOR model can approximate the volatile release rate indicated by the given R2 values decreasing from hemicellulose over cellulose to lignin. In particular, the pyrolysis process of lignin under high heating rate conditions seems to be more complex than being represented by the SFOR model and thus the observed kinetic parameters of the SFOR model should only serve as a rough estimation of affected reaction time scales (for more details see section 3.5). In the low-temperature range, the observed release rate evolution for hemicellulose also indicates a superposition of different reactions (e.g., several explicit peaks or plateaus in the release rate), which does not agree with the approach of the SFOR model. Similar findings also result from the studies of Orfão et al. (1999). Whether the multiple-peak characteristic can be attributed to polymer cleavage and side-chain split-off reactions or the decomposition of different functional groups can not be answered within the current study.
3.3.3 Arrhenius Kinetics
Figure 7 shows the determined reaction rates at different reactor temperatures in the FBR as well as the Arrhenius kinetic derived from these data. Additionally, the Arrhenius kinetics fitted to the non-isothermal TGA experiments and from different literature sources are shown.
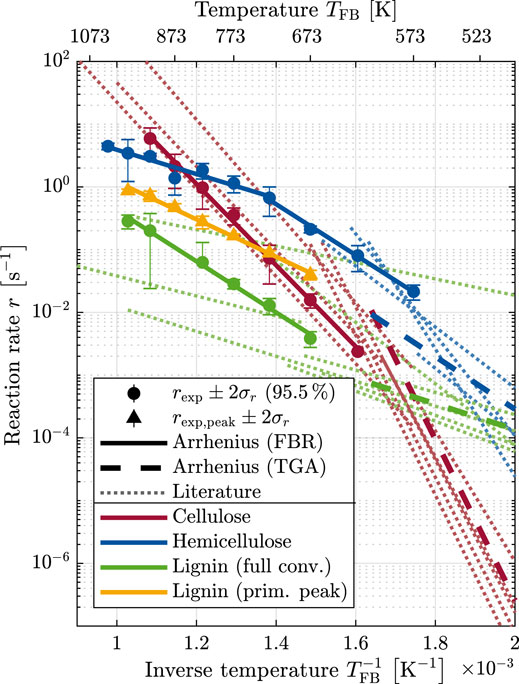
FIGURE 7. Arrhenius diagram of the characteristic reaction rate of the SFOR model: Experimental data from FBR, TGA and literature (details in Table 3) are compared.
Overall, the temperature dependence of the characteristic reaction rate determined in the FBR can be described in good approximation via Arrhenius approaches for the three basic components. In contrast to cellulose and lignin, hemicellulose shows two different reaction regimes (indicated by different slopes) with a shift around 723 K. Corresponding parameters for activation energy Ea,i and pre-exponential factor Ai resulting from an individual least-square fit in each regime are listed in Table 3.
The kinetic parameters obtained from the TGA experiments are well within the range of data available in the literature. In contrast to this study, most of the available literature studies estimate the kinetic parameters of the three pseudo-species from the simultaneous decomposition in real biomass and thereby indirectly assume that a linear superposition is valid. Nevertheless, kinetic parameters derived from the pure extracted components cellulose and lignin are very close to those obtained in the real biomass experiments. Only those for hemicellulose show a larger deviation. Reasons might be different hemicellulose types and the fact that the reaction behavior of hemicellulose seems to be too complex to be described by the SFOR model (cmp. Figure 5). The combination of FBR and TGA data suggests a change of the reaction regime also for cellulose around 650 K, which is the transition point of the two operation ranges of FBR and TGA.
A change of reaction regime for cellulose has been reported by various research groups. The phenomenon was first mentioned by Milosavljevic and Suuberg (1995), but the authors did not give an explanation for it. In the following years, different hypotheses have been proposed: Orfão et al. (1999) suspected charring reactions to take place at lower temperatures resulting in a material transformation with less reactivity. Antal and Várhegyi (1995) saw an unmet extraordinary heat demand (e.g. due to heat transfer intrusions) for the endothermic pyrolysis reactions as an explanation for the lowering of the apparent activation energy. For hemicellulose, no regime change has been reported so far.
To identify whether a reaction is controlled by reaction kinetics or by heat transfer, the dimensionless pyrolysis numbers PyI and PyII are used:
gives the ratio of reaction and conduction time scales, while
describes the ratio of reaction and convection time scales, respectively (Paulsen et al., 2013). The numbers depend on the particle thermal conductivity λp, particle density ρp, particle heat capacity cp, particle diameter dp, characteristic reaction rate r and the heat transfer coefficient α with the following assumptions been made for the calculations:
• Properties: N2 from National Institute of Standards and Technology (2018), cp(T) from Merrick (1983), λp = 0.1 W m−1 K−1, ρp = 600 kg m−3 as mean values from SriBala et al. (2019).
• Particle diameter: dp = dp,50 from Table 1
• Reaction kinetics: SFOR parameters for cellulose from TGA, parameters for hemicellulose and lignin from FBR low temperature regime
• Heat transfer: Correlation for α from Gunn (1978).
Figure 8 shows the temperature dependency of both pyrolysis numbers for the three biomass components. A pyrolysis number larger than one indicates a reaction kinetic limitation, while Py < 1 indicates a limitation due to the heat transfer, either convection on the particle surface or conduction inside the particle. An influence on the observed reaction is expected when both time scales have the same order of magnitude in the transition region. As indicated by very similar trends for PyI and PyII (equally to Bi = 1), timescales of convection and conduction are always in the same range. The upper limit of the transition region can be used as an indicator, where the pyrolysis process switches from the pure reaction kinetic control towards a heat transfer control.
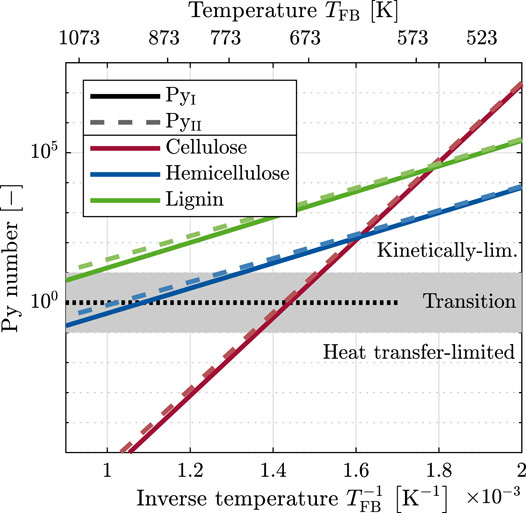
FIGURE 8. Dimensionless pyrolysis numbers to estimate reaction control by either reaction kinetics or heat transfer.
Theoretical transition temperatures of approximately 660, 750 and 1030 K are calculated for cellulose, hemicellulose and lignin, respectively. These transition temperatures correlate well with the obtained reaction regime changes derived from the experimental reaction rates as depicted in Figure 7 (Cel.: 623 K, Hem.: 723 K and no change for lignin up to 973 K). Furthermore, the activation energy in the high-temperature regime is approximately half of that in the low-temperature regime. For heterogeneous gas-solid reactions, a halving of the effective activation energy can be shown analytically at the transition between the purely kinetically controlled regime and the pore-diffusion-controlled regime (Levenspiel, 1999). Thus, it is very likely that the observed change in activation energy is an apparent effect that can be traced back to the transition from a solely reaction kinetic controlled regime to a partly heat transfer limited reaction regime. The slight deviation of ≈20–50 K might originate from the endothermic nature of the pyrolysis reaction and the parameter uncertainties. The choice of a suitable reaction kinetic should therefore be made based on the boundary conditions, so that, for e.g. pulverized fuel combustion or high-temperature flash pyrolysis, the high-temperature kinetic data should be used (Milosavljevic and Suuberg, 1995).
3.4 Two-step Model With Intermediate Species Formation
As described in section 2.4.2, the 2-step model has three adjustable parameters, the two reaction rates of the primary (rprim) and secondary (rsec) decomposition as well as the share of intermediate formed (ϕint). Similar to the SFOR model, these parameters are determined from single experiments at fixed fluidized bed temperatures via a least-squares fit algorithm. The additional fit parameters lead to a better overall approximation of the volatile release rate of cellulose and hemicellulose (
Figure 9 shows the temperature dependency of the primary and secondary reaction rate in an Arrhenius diagram (Figure 9A) and the intermediate fraction (Figure 9B). The Arrhenius diagram reveals two distinguished reaction rates with different orders of magnitude for each component within the investigated temperature range. Similar to the SFOR model, a transition between two reaction regimes is visible for hemicellulose while cellulose and lignin appear to react in the same reaction regime over the entire range of investigated temperatures in the FBR. The calculated Arrhenius parameters are listed in Table 4.
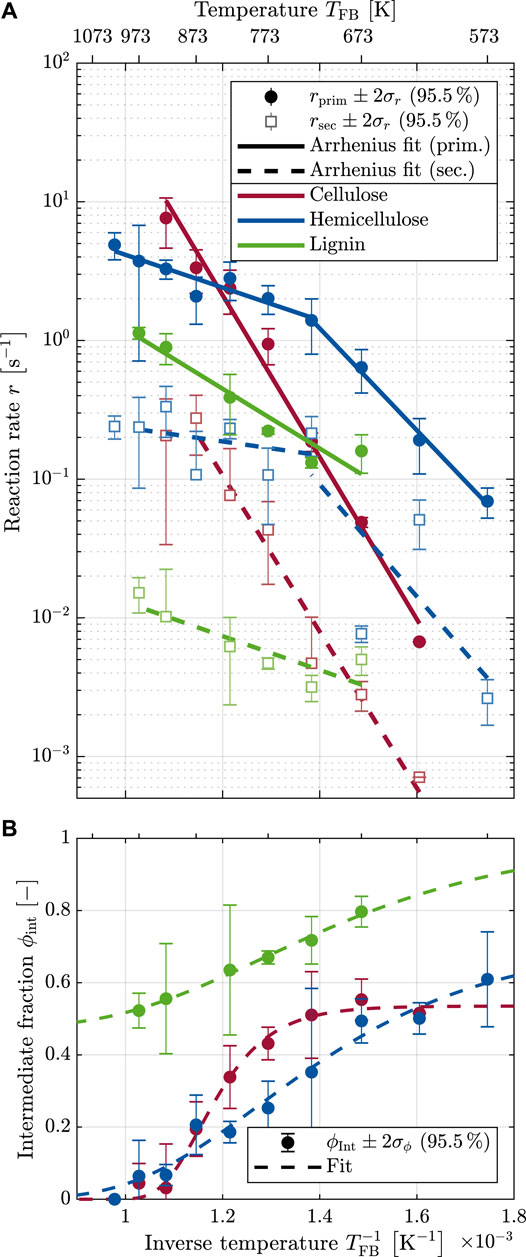
FIGURE 9. Kinetic parameters of the 2-step model: (A) Arrhenius diagram with characteristic reaction rates of primary and secondary reaction (B) Intermediate fraction.

TABLE 4. Kinetic parameters of 2-step model.
The intermediate fraction shown in Figure 9B shows similar trends for all three components: the lower the temperature, the higher the fraction of intermediate formed. Consequently, the overall release rate is more strongly controlled by the secondary reaction step for low temperatures, while the first reaction is the deciding factor for higher temperatures. For cellulose and hemicellulose, the influence of the secondary reaction even vanishes completely above 873 K. In the case of negligible intermediate fractions also values of the secondary reaction rate become arbitrary and are not considered in the Arrhenius fit. The distributions of ϕint(T) are modeled with a double exponential function:
This approach is comparable to the description used by Nunn et al. (1985) to approximate the temperature-dependent mass release in their study and has already been proven to be suitable to model the intermediate fraction (Pielsticker et al., 2019b). All parameters for the modeling of ϕint,i(T) are also given in Table 4.
3.5 Overall Model Accuracy
To evaluate the overall model’s accuracy, a suitable quality criterion must be defined. The investigation of different criteria has identified the weighted, normalized absolute error
as the most meaningful quality measure. It simultaneously is highly sensitive to the maximum reactivity (highest intensity of release rate) while being robust to non-reaction-related influences like measurement frequency, recorded duration of the experiment or signal intensity.
The overall model performance is calculated using the final yield model in combination with both reactivity models. Figure 10 shows the calculated values of the quality criterion in logarithmic space. To make the numerical values tangible, reference values are determined using the experimental standard deviation σ and multiples of it. The resulting ranges of log(W*) are given in Figure 10 as areas of different grayscale. Desirable is an overall model performance within the ±2σ range corresponding to values of log(W*) < −0.75.

FIGURE 10. Overall model performance evaluated via the quality criterion log(W*).
For cellulose and hemicellulose, most of the points fulfill the aspired criterion log(W*) < −0.75 and all model predictions fall within the ±3σ range. The two highest temperatures for cellulose and the highest one for hemicellulose have been discarded from the analysis. At these conditions, the chemical reaction and the enlarged gas volume flow due to the gas flush during fuel injection act on the same time scale. Since the convolution function only works with a constant volume flow, it is impossible to reflect the effect of an unsteady volume flow during the flush. Cellulose reveals a slightly better prediction with the 2-step model (log(W*) = −1.09) compared to the SFOR model (log(W*) = −0.93) and an overall slightly worse approximation than hemicellulose. For hemicellulose, no significant difference regarding the model selection can be obtained (SFOR: −1.26, 2-step: −1.26). For lignin, the largest difference between both model approaches is visible: While the SFOR model—especially at lower temperatures—gives the worst prediction (log(W*) = −0.71), the 2-step model (log(W*) = −1.46) is well suited to describe the flash pyrolysis process of lignin.
By comparing the prediction behavior of the SFOR model with the experimental results for lignin in detail (Figure 11), it turned out that the SFOR model underpredicts the conversion in the beginning and overpredicts the release rate in the late phase of the reaction. Two modifications to the original (overall) SFOR model formulations are investigated to analyze whether an improvement can be obtained and how these improvements compete with the 2-step prediction:
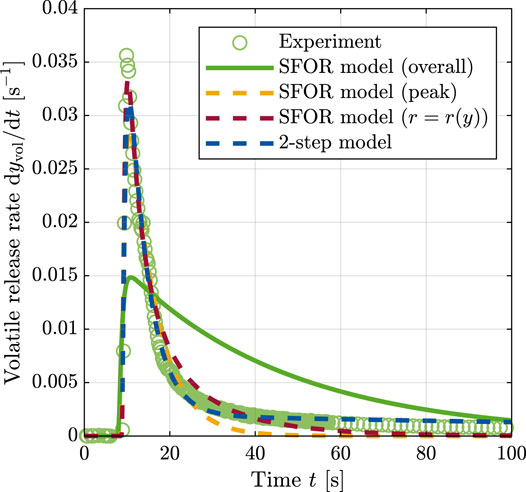
FIGURE 11. Effect of SFOR model modifications to improve the model predictivity during lignin flash pyrolysis (TFB = 773 K).
The first modification confines the region of interest to the primary peak and thereby avoids the overpredicted late phase. Instead of the final volatile yield, only the mass fraction released in the primary peak region (cmp. triangle symbols in Figure 3) is considered in Equation 2. The kinetic parameters have been adjusted accordingly (Figure 7 and Table 3). The modification allows for a good representation of the peak reaction behavior but predicts a completed reaction shortly after the peak. Consequently, this approach reflects the reaction behavior of only parts of the lignin. Nevertheless, this approach might be a suitable compromise if only short residence times are of interest (e.g. pulverized fuel combustion).
The second modification implements a logic that reduces the reaction rate depending on the reaction progress. The idea of this approach is equivalent to the assumption that the reacting material consists of many different partial masses, which react individually with an individual reaction rate. Typically the different reaction rates are expressed via a distribution function. In this case, a Gaussian normal distribution—with mean value μr and standard deviation σr as fitting parameters—is used to approximate r(y):
The Matlab built-in function for inversion is used to determine r(y). Figure 11 shows, that this model approach is also much more suitable to predict the volatile release compared to the standard SFOR model. It has the advantage that it can correctly predict both, the peak reactivity and the final volatile yield. Nevertheless, in comparison with the prediction of the 2-step model, larger deviations to the measured conversion rates in the late phase of the experiment are revealed. Despite this, the SFOR model with distributed reactivity represents a good alternative to the 2-step model. This proposed approach is comparable to the frequently used distributed activation energy model (DAEM) so far only calibrated with TGA data (Cai et al., 2014). In future works, it needs to be investigated to what extent mean value μr and standard deviation σr of the reaction rate show temperature-dependent behaviors, whether these can be modeled and a determination of DAEM kinetic parameters (mean value and standard deviation of the activation energy) is possible.
4 Conclusion
Pyrolysis experiments of the extracted biomass components cellulose, hemicellulose and lignin have been carried out under different thermal boundary conditions using thermogravimetric analysis and a fluidized bed reactor setup. The measured final volatile yield as a function of temperature followed an S-type characteristic and has been successfully modeled with a modified logistic distribution function, which additionally considers literature values. Global trends for the gas composition were found to be in good agreement with literature values, while the absolute yields differ between the experimental setups and boundary conditions used. The experimentally obtained volatile release has been modeled using the single first-order reaction (SFOR) model and a 2-step model with intermediate species formation. The combination of TGA and FBR kinetic data revealed different reaction regimes with different activation energies. By using the dimensionless pyrolysis numbers, the transitions of the reaction regime could be traced back to a transition of reaction kinetic controlled conditions to heat transfer limiting conditions. The overall model performance—evaluated as a combination of the final yield model with the reaction kinetic model—identified both, the SFOR and the 2-step model, being suitable to model the pyrolysis behavior of cellulose and hemicellulose. For lignin, only the 2-step model could correctly reproduce the measured data, while the SFOR model could only be used to estimate the relevant time scales. The usage of a distributed reaction rate depending on the reaction progress led to significantly better results and suggests that a model with distributed activation energies (DAEM) can correctly describe the flash pyrolysis process of lignin. To determine the kinetic parameters of the DAEM for flash pyrolysis conditions, a future extension of the evaluation routine is planned.
Data Availability Statement
The datasets presented in this study can be found in online repositories. The names of the repository/repositories and accession number(s) can be found below: https://doi.org/10.18154/RWTH-2021-05544.
Author Contributions
SP: conceptualization, experimental investigation, original draft; BG: data evaluation, original draft, KU: experimental investigation, review and editing RK: supervision, review and editing. All authors approved the manuscript for publication.
Funding
This work has been funded by the Deutsche Forschungsgemeinschaft (DFG, German Research Foundation)—215035359—SFB/TRR 129 “Oxyflame”.
Conflict of Interest
The authors declare that the research was conducted in the absence of any commercial or financial relationships that could be construed as a potential conflict of interest.
Publisher’s Note
All claims expressed in this article are solely those of the authors and do not necessarily represent those of their affiliated organizations, or those of the publisher, the editors and the reviewers. Any product that may be evaluated in this article, or claim that may be made by its manufacturer, is not guaranteed or endorsed by the publisher.
Acknowledgments
The authors want to thank Charlotte Löffler and Simon Galle for supporting this study with their experimental work within their theses.
Footnotes
1No data from TGA experiments has been used. In the temperature range up to 600 K, mainly measured data from studies on torrefaction have been considered as experimental reference data
References
Abad, A., Cardona, S. C., Torregrosa, J. I., López, F., and Navarro-Laboulais, J. (2005). Flow Analysis Deconvolution for Kinetic Information Reconstruction. J. Math. Chem. 38, 271–292. doi:10.1007/s10910-005-5422-8
Ansari, K. B., Arora, J. S., Chew, J. W., Dauenhauer, P. J., and Mushrif, S. H. (2019). Fast Pyrolysis of Cellulose, Hemicellulose, and Lignin: Effect of Operating Temperature on Bio-Oil Yield and Composition and Insights into the Intrinsic Pyrolysis Chemistry. Ind. Eng. Chem. Res. 58, 15838–15852. doi:10.1021/acs.iecr.9b00920
Antal, M. J. J., and Várhegyi, G. (1995). Cellulose Pyrolysis Kinetics: The Current State of Knowledge. Ind. Eng. Chem. Res. 34, 703–717. doi:10.1021/ie00042a001
Bridgwater, A. V. (2012). Review of Fast Pyrolysis of Biomass and Product Upgrading. Biomass and Bioenergy 38, 68–94. doi:10.1016/j.biombioe.2011.01.048
Broido, A., and Nelson, M. A. (1975). Char Yield on Pyrolysis of Cellulose. Combustion and Flame 24, 263–268. doi:10.1016/0010-2180(75)90156-X
Cai, J., Wu, W., and Liu, R. (2014). An Overview of Distributed Activation Energy Model and its Application in the Pyrolysis of Lignocellulosic Biomass. Renew. Sust. Energ. Rev. 36, 236–246. doi:10.1016/j.rser.2014.04.052
Carrier, M., Windt, M., Ziegler, B., Appelt, J., Saake, B., Meier, D., et al. (2017). Quantitative Insights into the Fast Pyrolysis of Extracted Cellulose, Hemicelluloses, and Lignin. ChemSusChem 10, 3212–3224. doi:10.1002/cssc.201700984
Chan, R. W.-C., and Krieger, B. B. (1981). Kinetics of Dielectric-Loss Microwave Degradation of Polymers: Lignin. J. Appl. Polym. Sci. 26, 1533–1553. doi:10.1002/app.1981.070260510
Chen, D., Gao, A., Cen, K., Zhang, J., Cao, X., and Ma, Z. (2018). Investigation of Biomass Torrefaction Based on Three Major Components: Hemicellulose, Cellulose, and Lignin. Energ. Convers. Manag. 169, 228–237. doi:10.1016/j.enconman.2018.05.063
Couhert, C., Commandré, J.-M., and Salvador, S. (2009a). Failure of the Component Additivity Rule to Predict Gas Yields of Biomass in Flash Pyrolysis at 950°C. Biomass and Bioenergy 33, 316–326. doi:10.1016/j.biombioe.2008.07.003
Couhert, C., Commandré, J.-M., and Salvador, S. (2009b). Is it Possible to Predict Gas Yields of Any Biomass after Rapid Pyrolysis at High Temperature from its Composition in Cellulose, Hemicellulose and Lignin? Fuel 88, 408–417. doi:10.1016/j.fuel.2008.09.019
Debiagi, P. E. A., Pecchi, C., Gentile, G., Frassoldati, A., Cuoci, A., Faravelli, T., et al. (2015). Extractives Extend the Applicability of Multistep Kinetic Scheme of Biomass Pyrolysis. Energy Fuels 29, 6544–6555. doi:10.1021/acs.energyfuels.5b01753
Diblasi, C. (2008). Modeling Chemical and Physical Processes of wood and Biomass Pyrolysis. Prog. Energ. Combustion Sci. 34, 47–90. doi:10.1016/j.pecs.2006.12.001
Fletcher, T. H., Kerstein, A. R., Pugmire, R. J., Solum, M. S., and Grant, D. M. (1992). Chemical Percolation Model for Devolatilization. 3. Direct Use of Carbon-13 NMR Data to Predict Effects of Coal Type. Energy Fuels 6, 414–431. doi:10.1021/ef00034a011
Gómez, C. J., Manyà, J. J., Velo, E., and Puigjaner, L. (2004). Further Applications of a Revisited Summative Model for Kinetics of Biomass Pyrolysis. Ind. Eng. Chem. Res. 43, 901–906. doi:10.1021/ie030621b
Gövert, B., Pielsticker, S., Kreitzberg, T., Habermehl, M., Hatzfeld, O., and Kneer, R. (2017). Measurement of Reaction Rates for Pulverized Fuel Combustion in Air and Oxyfuel Atmosphere Using a Novel Fluidized Bed Reactor Setup. Fuel 201, 81–92. doi:10.1016/j.fuel.2017.03.009201
Grønli, M. G., Várhegyi, G., and Di Blasi, C. (2002). Thermogravimetric Analysis and Devolatilization Kinetics of Wood. Ind. Eng. Chem. Res. 41, 4201–4208. doi:10.1021/ie0201157
Gunn, D. J. (1978). Transfer of Heat or Mass to Particles in Fixed and Fluidised Beds. Int. J. Heat Mass Transfer 21, 467–476. doi:10.1016/0017-9310(78)90080-7
Hajaligol, M. R., Howard, J. B., Longwell, J. P., and Peters, W. A. (1982). Product Compositions and Kinetics for Rapid Pyrolysis of Cellulose. Ind. Eng. Chem. Proc. Des. Dev. 21, 457–465. doi:10.1021/i200018a019
Hameed, S., Sharma, A., Pareek, V., Wu, H., and Yu, Y. (2019). A Review on Biomass Pyrolysis Models: Kinetic, Network and Mechanistic Models. Biomass and Bioenergy 123, 104–122. doi:10.1016/j.biombioe.2019.02.008
Hoekstra, E., van Swaaij, W. P. M., Kersten, S. R. A., and Hogendoorn, K. J. A. (2012). Fast Pyrolysis in a Novel Wire-Mesh Reactor: Decomposition of pine wood and Model Compounds. Chem. Eng. J. 187, 172–184. doi:10.1016/j.cej.2012.01.118
Intergovernmental Panel on Climate Change (2018). Global Warming of 1.5◦C: An IPCC Special Report on the Impacts of Global Warming of 1.5◦C above Pre-industrial Levels and Related Global Greenhouse Gas Emission Pathways, in the Context of Strengthening the Global Response to the Threat of Climate Change, Sustainable Development, and Efforts to Eradicate Poverty. IPCC Special Report.
Lewellen, P. C., Peters, W. A., and Howard, J. B. (1977). Cellulose Pyrolysis Kinetics and Char Formation Mechanism. Symp. (International) Combustion 16, 1471–1480. doi:10.1016/S0082-0784(77)80429-3
Liu, Q., Zhong, Z., Wang, S., and Luo, Z. (2011). Interactions of Biomass Components during Pyrolysis: A TG-FTIR Study. J. Anal. Appl. Pyrolysis 90, 213–218. doi:10.1016/j.jaap.2010.12.009
Lou, R., and Wu, S.-b. (2011). Products Properties from Fast Pyrolysis of Enzymatic/mild Acidolysis Lignin. Appl. Energ. 88, 316–322. doi:10.1016/j.apenergy.2010.06.028
Lv, G., Wu, S., Yang, G., Chen, J., Liu, Y., and Kong, F. (2013). Comparative Study of Pyrolysis Behaviors of Corn Stalk and its Three Components. J. Anal. Appl. Pyrolysis 104, 185–193. doi:10.1016/j.jaap.2013.08.005
Manyà, J. J., Velo, E., and Puigjaner, L. (2003). Kinetics of Biomass Pyrolysis: a Reformulated Three-Parallel-Reactions Model. Ind. Eng. Chem. Res. 42, 434–441. doi:10.1021/ie020218p
Merrick, D. (1983). Mathematical Models of the thermal Decomposition of Coal1. The Evolution of Volatile Matter. Fuel 62, 534–539. doi:10.1016/0016-2361(83)90222-3
Milosavljevic, I., and Suuberg, E. M. (1995). Cellulose Thermal Decomposition Kinetics: Global Mass Loss Kinetics. Ind. Eng. Chem. Res. 34, 1081–1091. doi:10.1021/ie00043a009
Nicolai, H., Wen, X., Miranda, F. C., Zabrodiec, D., Massmeyer, A., di Mare, F., et al. (2021). Numerical Investigation of Swirl-Stabilized Pulverized Coal Flames in Air and Oxy-Fuel Atmospheres by Means of Large Eddy Simulation Coupled with Tabulated Chemistry. Fuel 287, 119429. doi:10.1016/j.fuel.2020.119429
Nunn, T. R., Howard, J. B., Longwell, J. P., and Peters, W. A. (1985). Product Compositions and Kinetics in the Rapid Pyrolysis of Sweet Gum Hardwood. Ind. Eng. Chem. Proc. Des. Dev. 24, 836–844. doi:10.1021/i200030a053
Ontyd, C., Pielsticker, S., Yildiz, C., Schiemann, M., Hatzfeld, O., Ströhle, J., et al. (2021). Experimental Determination of walnut Shell Pyrolysis Kinetics in N2 and CO2 via Thermogravimetric Analysis, Fluidized Bed and Drop Tube Reactors. Fuel 287, 119313. doi:10.1016/j.fuel.2020.119313
Orfão, J. J. M., Antunes, F. J. A., and Figueiredo, J. L. (1999). Pyrolysis Kinetics of Lignocellulosic Materials-Three Independent Reactions Model. Fuel 78, 349–358. doi:10.1016/S0016-2361(98)00156-2
Paulsen, A. D., Mettler, M. S., and Dauenhauer, P. J. (2013). The Role of Sample Dimension and Temperature in Cellulose Pyrolysis. Energy Fuels 27, 2126–2134. doi:10.1021/ef302117j
Pielsticker, S., Gövert, B., Umeki, K., and Kneer, R. (2021). Flash Pyrolysis Kinetics of Extracted Lignocellulosic Biomass Components – Supplementary Dataset. doi:10.18154/RWTH-2021-05544
Pielsticker, S., Gövert, B., Kreitzberg, T., Habermehl, M., Hatzfeld, O., and Kneer, R. (2018a). Development of a Rapidly Responding Fluidized Bed Reactor by Theoretical and Experimental Evaluation of Combustion Reactions. Fuel 223, 462–469. doi:10.1016/j.fuel.2018.02.171
Pielsticker, S., Gövert, B., Kreitzberg, T., Habermehl, M., Hatzfeld, O., and Kneer, R. (2017). Simultaneous Investigation into the Yields of 22 Pyrolysis Gases from Coal and Biomass in a Small-Scale Fluidized Bed Reactor. Fuel 190, 420–434. doi:10.1016/j.fuel.2016.10.085
Pielsticker, S., Schlögel, K., Kreitzberg, T., Hatzfeld, O., and Kneer, R. (2019a). Biomass Pyrolysis Kinetics in a Fluidized Bed Reactor: Measurements and Plausibility Verification for Reaction Conditions. Fuel 254, 115589. doi:10.1016/j.fuel.2019.05.172
Pielsticker, S., Schlögel, K. U., Kreitzberg, T., Hatzfeld, O., and Kneer, R. (2018b). Measurement of Beech wood Pyrolysis Kinetics in a Fluidized Bed Reactor. Sorrent (Italy): Joint Meeting the German and Italian Sections of the Combustion Institute.
Pielsticker, S., Senneca, O., Kreitzberg, T., Cerciello, F., Hatzfeld, O., and Kneer, R. (2019b). Comparability and Validity Range of Pyrolysis Kinetics from Chinese Coals Obtained with Different Experimental Setups. In 9th International Symposium on Coal Combustion, Qingdao, China.
Piskorz, J., Radlein, D., and Scott, D. S. (1986). On the Mechanism of the Rapid Pyrolysis of Cellulose. J. Anal. Appl. Pyrolysis 9, 121–137. doi:10.1016/0165-2370(86)85003-3
Scott, D. S., Piskorz, J., Bergougnou, M. A., Graham, R., and Overend, R. P. (1988). The Role of Temperature in the Fast Pyrolysis of Cellulose and wood. Ind. Eng. Chem. Res. 27, 8–15. doi:10.1021/ie00073a003
Shen, D. K., Gu, S., and Bridgwater, A. V. (2010). The thermal Performance of the Polysaccharides Extracted from Hardwood: Cellulose and Hemicellulose. Carbohydr. Polym. 82, 39–45. doi:10.1016/j.carbpol.2010.04.018
SriBala, G., Carstensen, H.-H., van Geem, K. M., and Marin, G. B. (2019). Measuring Biomass Fast Pyrolysis Kinetics: State of the Art. Wires Energ. Environ 8, e326. doi:10.1002/wene.326
Teng, H., and Wei, Y.-C. (1998). Thermogravimetric Studies on the Kinetics of Rice Hull Pyrolysis and the Influence of Water Treatment. Ind. Eng. Chem. Res. 37, 3806–3811. doi:10.1021/ie980207p
Trubetskaya, A., Timko, M. T., and Umeki, K. (2020). Prediction of Fast Pyrolysis Products Yields Using Lignocellulosic Compounds and Ash Contents. Appl. Energ. 257, 113897. doi:10.1016/j.apenergy.2019.113897
Wang, S., Dai, G., Ru, B., Zhao, Y., Wang, X., Xiao, G., et al. (2017). Influence of Torrefaction on the Characteristics and Pyrolysis Behavior of Cellulose. Energy 120, 864–871. doi:10.1016/j.energy.2016.11.135
Yang, H., Yan, R., Chen, H., Lee, D. H., and Zheng, C. (2007). Characteristics of Hemicellulose, Cellulose and Lignin Pyrolysis. Fuel 86, 1781–1788. doi:10.1016/j.fuel.2006.12.013
Yu, J., Paterson, N., Blamey, J., and Millan, M. (2017). Cellulose, Xylan and Lignin Interactions during Pyrolysis of Lignocellulosic Biomass. Fuel 191, 140–149. doi:10.1016/j.fuel.2016.11.057
Zhang, J., Choi, Y. S., Yoo, C. G., Kim, T. H., Brown, R. C., and Shanks, B. H. (2015). Cellulose-Hemicellulose and Cellulose-Lignin Interactions during Fast Pyrolysis. ACS Sust. Chem. Eng. 3, 293–301. doi:10.1021/sc500664h
Zhao, S., Liu, M., Zhao, L., and Zhu, L. (2018). Influence of Interactions Among Three Biomass Components on the Pyrolysis Behavior. Ind. Eng. Chem. Res. 57, 5241–5249. doi:10.1021/acs.iecr.8b00593
Zhou, H., Long, Y., Meng, A., Li, Q., and Zhang, Y. (2013). The Pyrolysis Simulation of Five Biomass Species by Hemi-Cellulose, Cellulose and Lignin Based on Thermogravimetric Curves. Thermochim. Acta 566, 36–43. doi:10.1016/j.tca.2013.04.040
Zhou, H., Wu, C., Meng, A., Zhang, Y., and Williams, P. T. (2014). Effect of Interactions of Biomass Constituents on Polycyclic Aromatic Hydrocarbons (PAH) Formation during Fast Pyrolysis. J. Anal. Appl. Pyrolysis 110, 264–269. doi:10.1016/j.jaap.2014.09.007
Keywords: pyrolysis, biomass components, fluidized bed reactor, FTIR gas analysis, kinetic modeling
Citation: Pielsticker S, Gövert B, Umeki K and Kneer R (2021) Flash Pyrolysis Kinetics of Extracted Lignocellulosic Biomass Components. Front. Energy Res. 9:737011. doi: 10.3389/fenrg.2021.737011
Received: 06 July 2021; Accepted: 16 August 2021;
Published: 10 September 2021.
Edited by:
Antonio Soria-Verdugo, Universidad Carlos III de Madrid, SpainReviewed by:
Xi Yu, Aston University, United KingdomFabrizio Scala, University of Naples Federico II, Italy
Copyright © 2021 Pielsticker, Gövert, Umeki and Kneer. This is an open-access article distributed under the terms of the Creative Commons Attribution License (CC BY). The use, distribution or reproduction in other forums is permitted, provided the original author(s) and the copyright owner(s) are credited and that the original publication in this journal is cited, in accordance with accepted academic practice. No use, distribution or reproduction is permitted which does not comply with these terms.
*Correspondence: Stefan Pielsticker, cGllbHN0aWNrZXJAd3NhLnJ3dGgtYWFjaGVuLmRl