- 1Department of Statistics, University of Science and Technology, Bannu, Pakistan
- 2Department of Quantitative Methods, School of Business, King Fahad University, Al-Ahsa, Saudi Arabia
- 3Institute of Education and Research (IER), University of Science and Technology, Bannu, Pakistan
This study analyzes a dynamic long-run and short-run causal nexus between energy consumption and economic growth in the presence of capital, labor, and urbanization over the period 1971–2014, in Malaysia. The stationarity issue was tested using augmented Dickey–Fuller (ADF), Kwiatkowski–Phillips–Schmidt–Shin (KPSS), and Ng–Perron tests. However, a dynamic long-run co-integration relation between variables was checked through the ARDL technique. An unrestricted vector error correction model (MUVECM) was used to estimate the short-run and long-run dynamic relations between the parameters and the Engle–Granger method was used for causality analysis. Results of statistical analysis confirmed that all variables were found to be I (1) except variable labour was I(0) and none of the variables was I(2). Total energy consumption Granger caused GDP in one direction over the period 1992-2010 in the case of Croatia. However, labor and urbanization impacts were mixed. The Granger causality analysis confirmed mixed results in the short run and the long run. Moreover, estimated results confirmed a feedback hypothesis between income and capital was in the short term and the long run. The short-run and long-run causal effects of labor force on economic growth were confirmed. This study provides important insights to policymakers and energy economists. Prudent energy conservation policies and economically improved measures would be of great help. However, demand-side management-based policies would have no adverse effect on the economic performance of Malaysia.
Introduction
Energy as a factor of production has been considered one of the dominant contributors in the growth process. In the existing energy economics literature, this issue has been extensively debated. The neo-classical economists have conflicting views. On the one end, neo-classical growth theorists acknowledged and valued labor and capital as the fundamental growth components; on the other end, they considered the role of energy as neutral by bringing it as a secondary factor in the production process. The biophysicists and ecologists have a strong view of the importance of energy and its role in income determination. Thus, the energy-dependent economies are greatly affected by energy consumption’s variations (Cleveland et al., 1984; Dale et al., 2012; Cleveland, 1999). The traditional neo-classical growth model considered energy as an intermediate component of production. No engineering production is possible without energy consumption; therefore, energy is crucial for production (Beaudreau, 1995; Ozturk, 2010).
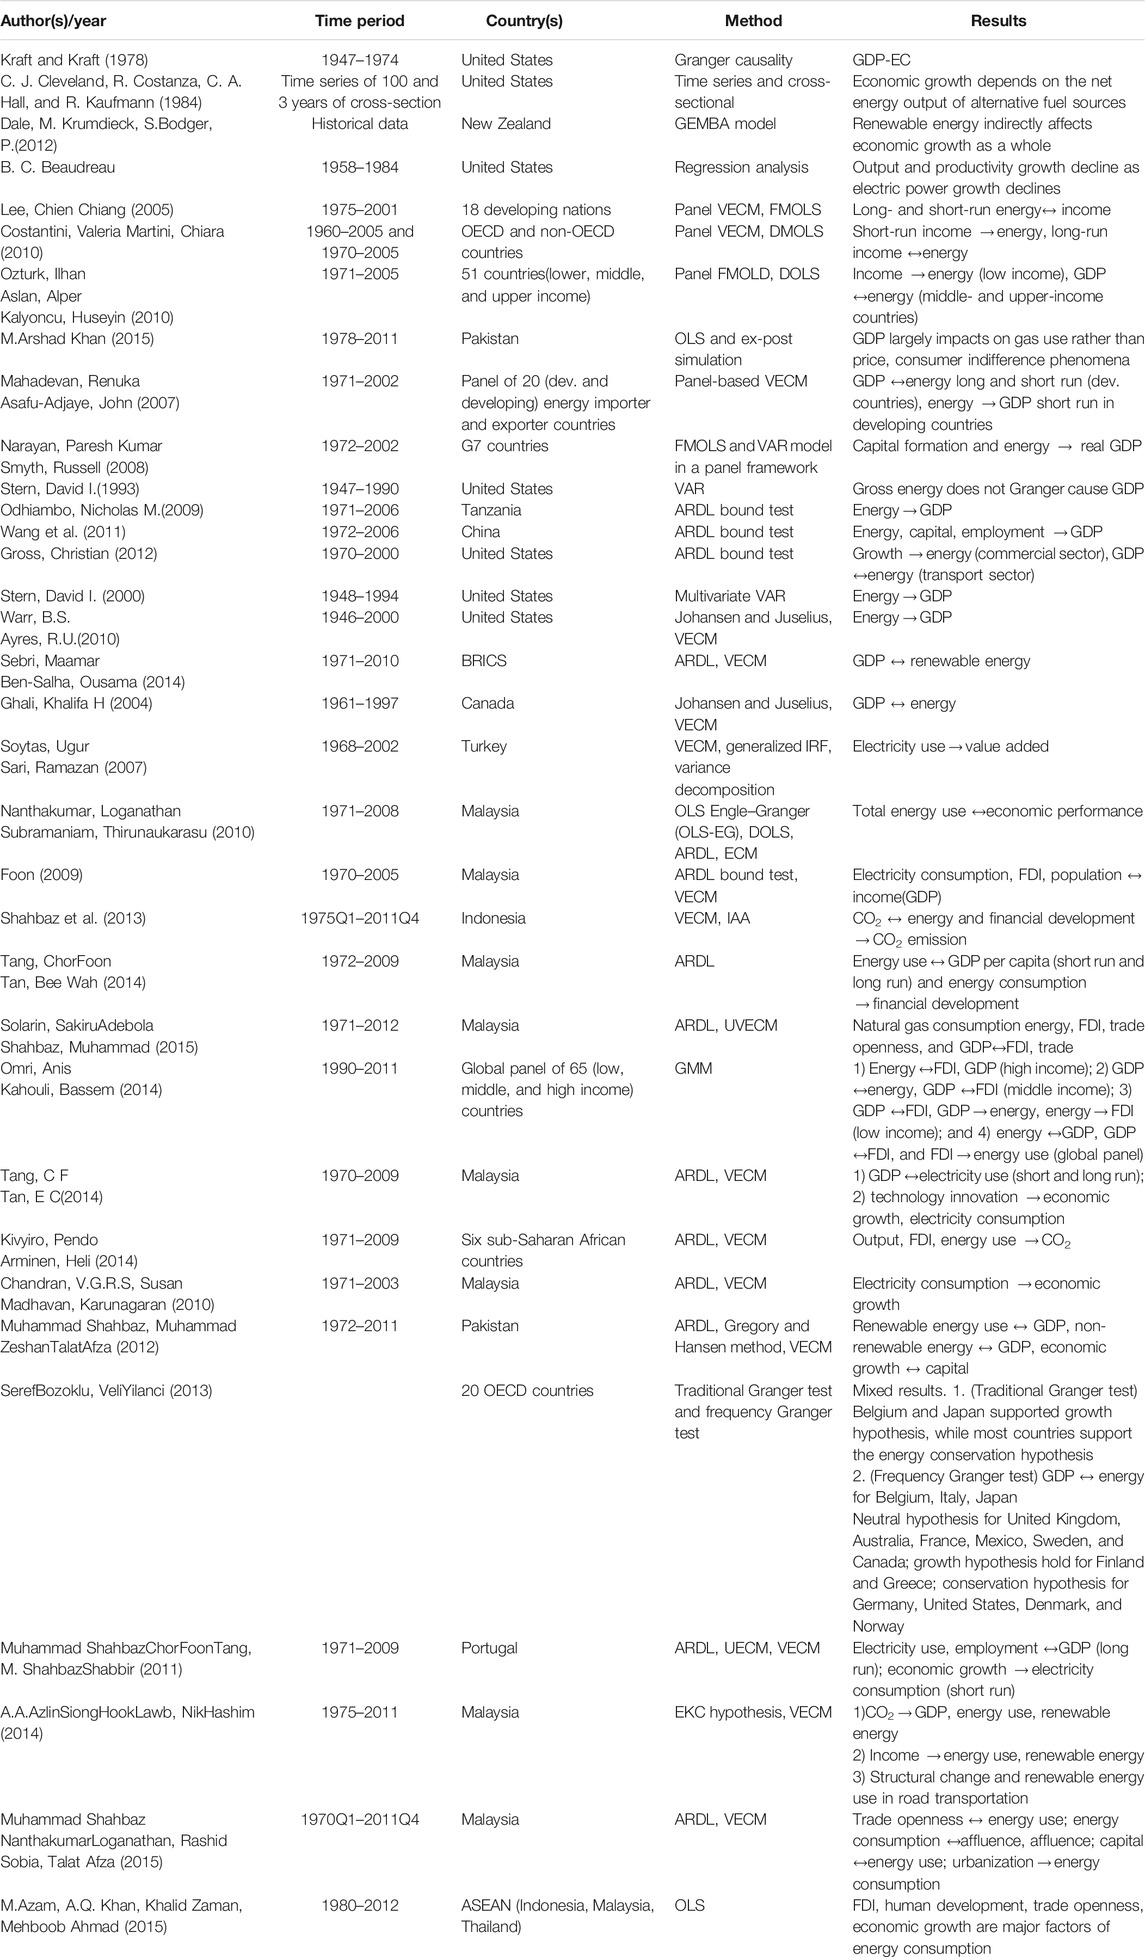
A large body of literature produced controversial empirical investigations into the importance of energy. In this regard, the seminal work of Kraft and Kraft (1978) has opened a new avenue for discussion. An extensive body of research has been carried out to empirically assess the role of energy in the economic growth (GDP) perspective by applying various econometric techniques such as co-integration and causality analysis across countries (Lee, 2005; Costantini and Martini, 2010; Ozturk et al., 2010; Khan, 2015). Critical literature review still showed inconclusive evidence on the role of energy consumption in economic development (Costantini and Martini, 2010; Mahadevan and Asafu-Adjaye, 2007; Narayan and Smyth, 2008; Zamani, 2007). Previous studies based on the multivariate framework on small sample data were having serious statistical issues, i.e., variable omission bias. Due to this issue, some of the unobservable relationships have not been observed, causing misleading results and inferences (Stern, 1993; Odhiambo, 2009; Wang et al., 2011; Gross, 2012). Other studies based on causality analysis either on energy use and GDP or on electricity use and GDP also reported inconclusive findings concerning policy-related implications across countries (Ozturk, 2010). Subsequent studies in the literature used a multivariate approach by correcting weaknesses of the bivariate framework by investigating the energy and growth relationship such as Stern, 1993; Stern, 2000; Warr and Ayres, 2010; Sebri and Ben-Salha, 2014; Wang et al., 2011. Current literature on the topic usually has lacked theoretical foundations in multivariate and causality analysis. Different macroeconomic variables have been used to examine the mutual relationships among the variables, for example, reviewing causal links between energy use and output, a multivariate approach in their work on the basis of the neo-classical theory by Ghali and El-Sakka (2004) and Soytas and Sari (2007); however, the results of the study failed to accept the neo-classical growth model of the neutrality assumption of energy in economic growth.
Malaysia is one of the rapidly growing upper-middle economies within the ASEAN region with a total of 2,126.8 billion kWh estimated electricity production, 118.5 billion kWh electricity consumption, and 12 million kWh calculable electricity exports (est. 2012). Out of the total installed capacity (est. 2012) in Malaysia, electricity was 87.6% from fossil fuels, 11.6% from hydroelectric plants, zero percent from atomic energy, and 0.8% from alternative renewable resources (cia.gov., 2013). Malaysia’s total primary energy supply growth was recorded at 5.9%, with the final energy use of 7.5%, showing Malaysia’s economic growth as energy-dependent and attributed to more energy consumption in the industrial sector. In 2012, Malaysia exported liquefied natural gas (LNG) to various neighboring countries, including Japan (62%), Korea (17%), Taiwan (12%), and China (9%). The final energy consumption recorded in 2012 was 7.5%. The highest energy demand of 36.8% was recorded in the transport sector, followed by the industrial sector with 29.8%, the non-energy sector with 16.0%, the residential and commercial sector with 15.1%, and the agricultural sector with 2.3%. There was an upward and rapid trending pattern of growth in energy; however, the trend in non-energy consumption, industrial, and agricultural sectors was upward but slower. Moreover, the initiation and progress of many infrastructures related projects under the umbrella of the Economic Transformation Programme (ETP), for example, MY Rapid Transit, providing significantly and positively noteworthy spill-over impacts to activities in the local manufacturing and services segments. In 2012, healthy growth in the construction sector was a reflection of these developments (Energy Commissiom, 2012).
Energy has been considered a vital and fast driver of social and economic development. Effectiveness and economic levels of energy consumption in numerous sectors determine the economic prosperity of a nation. The quickly growing industrialization and better living standards of Malaysian people have considerably inflated energy consumption. In the last three decades, increasing urbanization and rapidly growing industrial growth in Malaysia have increased the combined demand for energy consumption (National Energy Balance Malaysia, 2009). The average energy consumption demand of 5% in 1980 rose to 12% in 2009 (Nanthakumar and Subramaniam, 2010). Thus, the growing energy use and its adverse environmental effects in Malaysia have increased the issues regarding the subject. To attenuate the speedy increase in energy consumption and safeguard the surroundings from its harmful effects, utilization of energy resources with the best economical means is of prime importance (Nanthakumar and Subramaniam, 2010; Razali et al., 2015; Shahbaz et al., 2013; Tang and Tan, 2014; Razali et al., 2015; Solarin and Shahbaz, 2015; Omri and Kahouli, 2014; Tang and Tan, 2013; Kivyiro and Arminen, 2014).
The current paper attempts to investigate a multivariate dynamic causal link between energy consumption and GDP through the ARDL technique in Malaysian economy over an extended time from 1971 to 2014, to find new alternatives for efficient use of energy resources to attenuate the rapidly growing energy consumption, and to suggest policy implications. This study contributes to the existing literature in two directions: 1) Compared to the other studies of Malaysia, see, for example, Razali et al., 2015; Shahbaz et al., 2013; Tang and Tan, 2014; Solarin and Shahbaz, 2015, this research based on an extended period up to 2014 with the longer justification period may explore the time series of the data in a better way and provide statistically reliable results if appropriately analyzed. 2) The portfolio of the exogenous variables used in this research distinguishes this paper from the earlier available research studies carried out in the area concerning Malaysia’s context (Omri and Kahouli, 2014; Shahbaz et al., 2013; Tang and Tan, 2013; Kivyiro and Arminen, 2014; Chandran et al., 2010). The remaining paper consists of the following sections.
Literature Review discusses previous literature. Data collection, model specification, and methodology are presented in Model Specification, Methodological Framework, and Collection of Data. Results and discussion are part of Results and Discussion. Conclusion and Policy Implications concludes with some policy implications.
Literature Review
Many studies are available to investigate the causal relationship between energy consumption and GDP at an individual country level and in a panel of countries. The economists and the environmental experts examined the causal nexus of income and energy consumption because the investigation and direction of causation between the variables have practical importance concerning policy implications to the policymakers for formulating appropriate policies associated with energy–growth and sustainable economic development of a country (Tang and Tan, 2013). Mainly, these studies can be categorized into two strands. The first strand of studies applied various co-integration and causality techniques in a bivariate framework to obtain the final results, while other strands of researchers incorporated other determining factors into a multivariate model to appropriately model the causal relationship, avoid the omitted variable bias problem, and give extensive policy suggestions to the policymakers. Thus, we considered some recent studies on the subject in general and more specifically on the Malaysian context because the paper is specific to Malaysia to shed light on the subject and to discuss the recent development on energy–growth causal relationship.
The seminal work of Kraft and Kraft (1978) opened a new debate for the researchers on the subject by conducting a study in the United States to determine the empirical relationship between gross energy inputs and gross national product (GNP) to investigate a causal link between the variables. The estimated results of the research showed a causal link running from GNP to gross energy in one direction, but the inverse was not valid. The researcher concluded that, in the case of the United States, the common belief of the researchers that energy conservation adversely influenced economic development was not true.
Previous papers based on the bivariate framework attempted to find the causal relationship between energy use and GDP and provided varied results in respect of causality, for example, Ebohon, 1996; Ayres et al., 2007; Ocal and Aslan, 2013; Erdal et al., 2008; Zhang, 2011. Energy consumption and real per capita GDP were found to be co-integrated and causality running in both directions (Erdal et al., 2008); bidirectional causality was found between technological progression and air pollution in top 10 polluted MENA countries; divergent causal relation between energy consumption and economic growth, urbanization, and energy use revealed N shape relation (Sinha et al., 2020; Sinha et al., 2018; Sinha et al., 2017), and renewable energy and carbon dioxide showed negative association for Indian economy (Sinha and Shahbaz, 2018). In the case of Russia, a study confirmed a dynamic long-run relationship between energy consumption and per capita GDP. It also showed a bidirectional causal link between variables (Zhang, 2011). One should be more cautious while suggesting policy implications explicitly based on the bivariate relationship between energy use and economic growth (Zhang, 2011; Zachariadis, 2007); renewable energy causes GDP per capita but no reverse causation from income to renewable energy in the case of Turkey (Ocal and Aslan, 2013). The causality of renewable energy to income was not uniform between countries. For some countries, energy stimulates economic growth and economic growth increases energy use such as in Switzerland, but in the case of Pakistan, France, Korea, Germany, and Belgium, only one-way causation was found. Total energy consumption analysis by Granger causes GDP in one direction over the period 1992–2010 in the case of Croatia (Yoo and Ku, 2009; Borozan, 2013). Technological innovations play a key role in sustainability and energy efficiency for MENA countries (Chen et al., 2021). Economic growth, energy use, and trade openness showed asymmetric impact on CO2 emission in Indian economy, showing that the prevailing growth pattern of India is non-sustainable (Shahbaz et al., 2021).
Energy–Growth Nexus and the Case of Malaysia
The current study is Malaysia specific; therefore, we discuss here the available literature on the subject both in the bivariate and in the multivariate framework concerning Malaysia. A multivariate study was conducted by Tang and Tan (2013) on energy–growth nexus by including energy prices and technological innovation in the model to investigate the causal relationship between the variables from 1970 to 2009. The estimated results of the study showed a long-run positive impact of income on electricity consumption, while energy prices and technology innovation negatively influenced electricity consumption in the long run. The causality was running from innovative technology to electricity consumption and economic growth in Malaysia in the long run, while energy consumption and income showed bidirectional causal association in both the long run and the short run. A study was conducted by Chandran et al. (2010) in both bivariate and multivariate environments using the ARDL bound test over the period 1971–2003, and electricity consumption caused GDP in the short run. Economic Growth Granger caused electricity generation in uni-direction, but a causal relationship was evidenced between prices and GDP (Lean and Smyth, 2010), over the period 1971–2008. In a multivariate research framework, Azlina and Mustapha (2012) investigated a relationship between energy utilization, economic growth, and CO2 by applying the VECM on annual data over the period 1970–2010 and concluded that causality was running from energy consumption to GDP and from CO2 to energy consumption as well as economic growth in Malaysia. The ARDL bound test, DOLS test, and SLM U (Sasabuchi–Lind–Mehlum U) test confirmed that energy consumption/capita and GDP (Chen et al., 2021) per capita have positive impact on CO2, but the impact of population growth was non-significant in Malaysia (Begum et al., 2015). A multivariate study conducted by Razali et al. (2015) over the period 1971–2013 using VAR and VECM procedures, in the case of Malaysia, concluded that a long-run relationship was present between energy consumption, income per capita, population growth, and trade openness.
Model Specification, Methodological Framework, and Collection of Data
Modeling Economic Growth and Energy Consumption
This study aimed to empirically investigate the dynamic association between energy consumption and income per capita in Malaysia, using yearly data series ranging from 1971 to 2014. To this end, we used Cobb–Douglas function by incorporating capital, labor, and urbanization as added inputs to determine the links between energy use and real GDP per capita. The Cobb–Douglas production function has the following general form:
Here, O is real per capita GDP, used as a proxy for economic growth; A is technology; E is energy; C is capital; L is labor; and U is urbanization, respectively. The small letter, e, is residual and is assumed to be i.i.d.(0,
Methodology
Augmented Dickey–Fuller (ADF) (Shahbaz et al., 2021), Kwiatkowski–Phillips–Schmidt–Shin (KPSS) (Lean and Smyth, 2010), and Ng–Perron tests were applied.
Keeping in mind the objectives of this paper and the nature of the data, we tested unit root issues, if any of the variable(s) has. The time of the data is longer, so is a likelihood that the series exhibit upward or downward trends. The trending behavior of the data indicates that location and scale parameters are time-dependent. In such cases, the estimated results of ordinary regression proved to be spurious. Inferences based on these results mislead and are detrimental to both short-term and long-term policies. Thus, to empirically check the stationarity issue, various unit root tests, such as ADF (Shahbaz et al., 2021), KPSS (Lean and Smyth, 2010), and Ng–Perron tests, were applied. The ARDL bound test developed by Azlina and Mustapha (2012) was applied to test the long-run co-integration between the variables. For investigation of the long- and short-run relationships between series energy consumption and real per capita GDP, the following equations specified:
Here,
For optimal lag of the first difference regression, we used the Akaike information criterion (AIC) and SBC. The F-distribution can be calculated appropriately. Once the appropriate lag orders of the included series are determined, then F-statistics are used. The joint significance of the coefficients of lagged variables is tested by F-test (Pesaran et al., 2001), with the null (no long-run relationship) and alternative hypotheses as
For investigating the co-integration relationship between variables, two separate, asymptotic critical values were calculated: one for a lower critical bound (LCB) and the other for an upper critical bound (UCB) (Pesaran et al., 2001). The series is assumed to be I(0), in the case of LCB; however, in the case of UCB, all the variables of the series are assumed to be I(1). The value may likely be anywhere in these two bounds. Thus,
1. If
2. If
3. If LCB <
Yoo and Ku (2009) provided biased estimates (Borozan, 2013). Chen et al. (2021). Since our study has only one I(0) variable, we set that variable as exogenous and the rest of all variables as endogenous. For a small sample, the critical values of Pesaran et al. (2001) are biased estimates. However, for the large sample values within a range of t = 500–4,000, they are more appropriate3. We tested variables, real per capita GDP, income per capita, energy consumption, capital, labor, and urbanization for causality once co-integration was confirmed. The computed value and estimated results of co-integration guide us toward the application of an appropriate econometric technique. If ARDL results showed co-integration, then the error correction model (ECM) is appropriate. But if some of the variable(s) are found to be of order zero, i.e., I(0), and the VECM4 is applied, then those variables be set exogenous (Granger, 1969). Since our study has only one I(0) variable, we have set that variable as exogenous and the rest of all variables as endogenous. The VECM for the variables can be written as
where Δ = differenced operator and Errort-1= error term assumed to be i.i.d.(0,
The significance of the error term (Errort-1) suggests that a long-run relation is present in the given variables. It also suggests that the specified models can get adjusted from the short-term shocks in the long run, if any. A significant negative error term shows that the variables are correlated in the long run and the system converges to equilibrium. The differenced form of models investigates the short-run causality. In this study, the coefficients
Data Collection and Variable Measurement
For the current research, we used yearly data over the period 1971–2014. Data were collected on real per capita GDP, per capita energy consumption, capital, labor, and urbanization. The real per capita GDP data were measured in constant 2005 prices, in local currency. The measurement of energy consumption was tons of oil equivalents. We extracted data on GDP per capita, capital, and labor from the World Development Indicators (WDI, 2015) database. However, we gathered data on urbanization and energy consumption from SESRIC (the Statistical, Economic and Social Research and Training Centre for Islamic Countries). We used the natural logarithm to transform the variables to get results in direct elasticity form. Independent variables were selected on the basis of theoretical and practical relations to the dependent variable. Theoretically, it has been observed that the higher the level of GDP, the greater the use of energy. Higher GDP leads to more energy consumption at household and aggregate levels. Rapid urbanization also causes increase in energy consumption as more people wish to live comfortable lives and gain maximum facilities for their livelihood. Urbanization also leads to increase in GDP because more educated and technically skilled persons enter into services and other sectors of the economy, leading to increased production levels. Skilled labors boost up GDP by actively participating in the labor market.
Results and Discussion
Unit Root Testing
The ARDL bound test was used to find the long-run co-integration association between the variables. As one of the presumptions of the ARDL test is that a series be a mixture of I(1) and I(0), and no variable(s) is to be I(2). For this purpose, we used ADF, KPSS, and Ng–Perron unit root techniques to find the unit root behavior of variables and the integrated orders of the variables. All these tests confirmed first-order stationary behavior (at first difference stationary) of the variables except labor which was level stationary, and no variable was found to be I(2). The ADF and Ng–Perron tests are based on the null hypothesis (H0) of non-stationarity versus Ha of no unit root. However, the KPSS test is based on the null hypothesis of stationarity against the alternative hypothesis of non-stationarity5.
Unrestricted error correction models (UECMs) were formulated from Eq. 3 to Eq. 7—particular types of ARDL models for the study. Next, the AIC and Schwarz criterion (SC) lag order selection was used to choose optimal lags of the regressand and the regressors to capture the dynamic links and select a better ARDL model for estimation. The ADF and Ng–Perron tests are based on the null hypothesis (H0) of a unit root versus the alternative hypothesis (Ha) of no unit root. However, the KPSS test is assumed H0 stationary against Ha non-stationary.
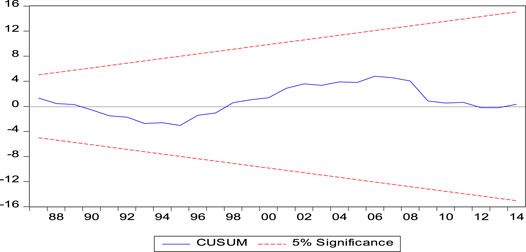
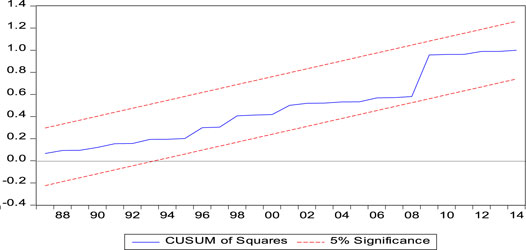
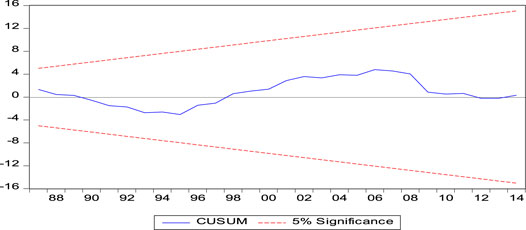
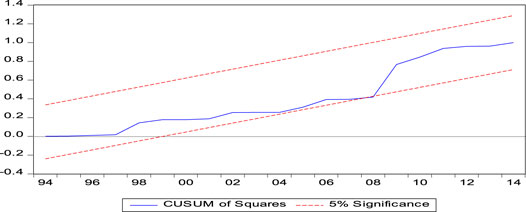
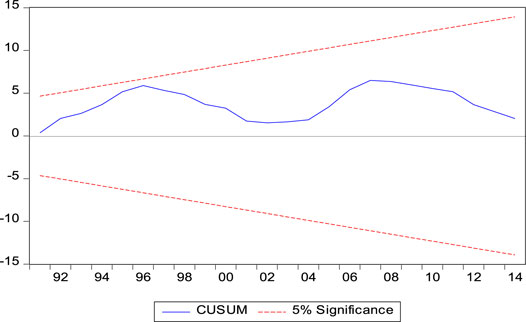
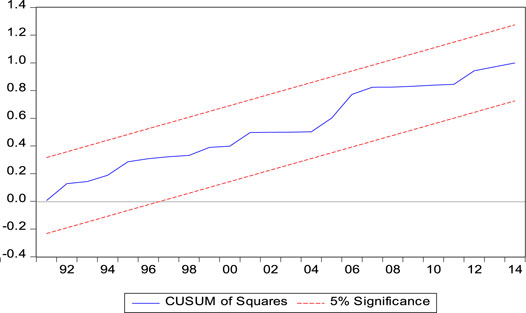
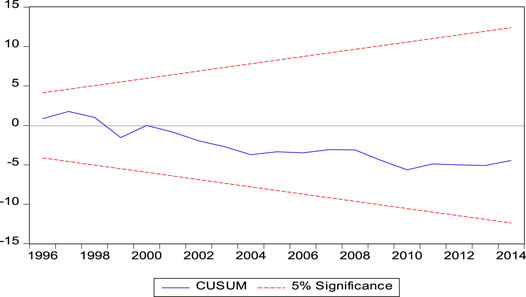
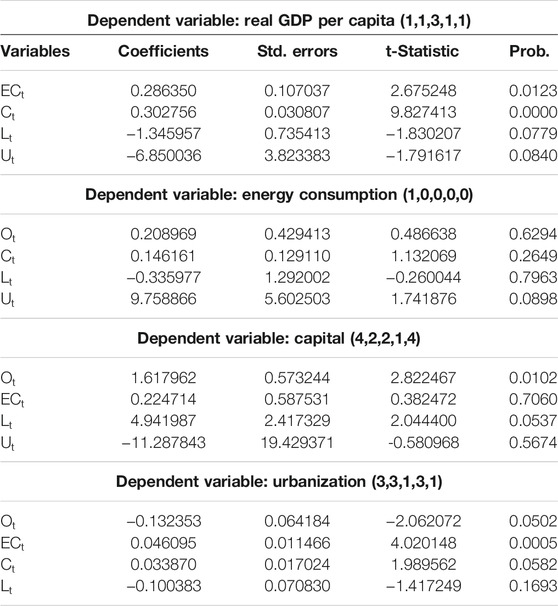
Equations 3, 7 were specified to allow the presence of long-run equilibrium by taking output, energy use, capital and urbanization as endogenous variables by estimating the short-run and long coefficients through ARDL Bound test and Error Correction Model (ECM) technique for the extended period of 1971-2014. We used the AIC and SB maximum lag length selection criteria of optimal lag length of the variables. For the final model specification, the selected optimal lags for each variable are separately reported in Table 16. The estimated long-run and short-run coefficients (elasticities) along with the t-ratios are presented in Tables 3, 4, respectively. Tables 3, 4 are divided into sub-sections such as Tables 3A–D, respectively, to better explain the estimated results of the models. For model stability and correct functional form specification of the model, we used the CUSUM test, CUSUMSQR test, and Ramsey RESET test.
4.2 Co-Integration
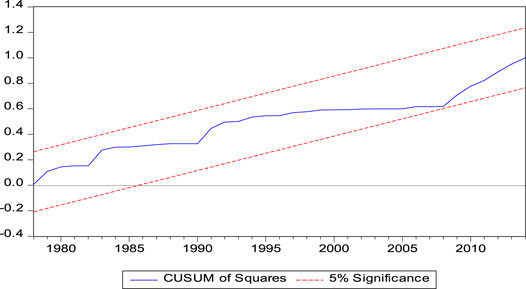
In the next step, we applied the ARDL bound F-test to investigate the long-run association between real-term GDP per capita, energy use, capital, labor, and urbanization. Table 2 reports the ARDL bound test statistic–estimated co-integration results along with the upper and lower asymptotic critical bound values on the left-hand side (LHS) and various diagnostic test results on the right-hand side (RHS). Table 2 reports bound test results showing the long-run co-integration relationship between GDP per capita and other variables (energy consumption, capital, labor, and urbanization) as the computed F-value 4.032 was > the 5% upper critical bound value of 3.05. The model passed the relevant diagnostic tests as shown on the RHS of the table. The model was free of serial correlation and heteroskedasticity problems. We used the Ramsey RESET test to get the correct functional form and CUSUM and CUSUMSQR for analyzing the stability of the model. Figures 1, 2 suggest that the model was stable for the short and the long run as the blue line is within the 5% red band of the test. This means that the specified model can observe shocks if any, and the results would not change due to such changes. Similarly, the other models were checked for and analyzed for structural stability. All the specified models were found stable. All these models may observe any shock(s) if appeared and results would not be changed for such structural changes. The models stability to shocks can be seen from the Figures 3‐8, as all the blue lines are within the red bends of the CUSUM and CUSUMS. Taking energy consumption as a dependent variable and other variables as exogenous in the model FEC(EC/O,C,L,U), it was confirmed that the variables have a long-run co-integration relationship, as the F-value 5.75 exceeded the 5% asymptotic ARDL bound critical value of 3.49. In the same table, the model FC(C/O,EC,L,U), with computed F-value 8.09>3.97 tabulated value, shows significant long-run co-integration association between the variables at 5% significant ARDL bound test value. Furthermore, the model FU(U/O,EC,C,U) results also confirmed a long-run co-integration. For this model, the reported calculated F-statistic value 7.26 > 3.97 tabulated value of ARDL bound test at 5% clearly represents long-run co-integration between the variables. Similarly, the other variable FO(O/EC,C,L,U) when treated as endogenous also confirmed a long-run co-integration relationship as the F-calculated values are larger than the reported ARDL bound test critical values at the given 5% upper bound.
Based on Table 3A, estimated results of the long-term real GDP per capita elasticity value turned out positive and statistically significant at a 5% significance level for the Malaysian economy as was generally expected. The estimated long-run elasticity of 0.28635 showed that keeping all else constant, a 1% increase in energy consumption increased GDP per capita by 0.29% in real terms. It means that energy use is an important driver and a source of economic growth in Malaysia. It also implies that Malaysia’s economy is energy-dependent, and hence, the economic growth of the country would be adversely affected if the economy gets any energy supply shock or if conservation policies are adopted. The government in her Ninth Malaysia Plan initiated various energy-saving programs to economically utilize the energy resources to minimize the adverse environmental effects. These programs were centric on industrial, transportation, and commercial sectors. However, the industrial sector was restricted to adopt energy-saving programs and improve installed plants and equipment in the production processes. If these programs are implemented as mandatory, it would probably adversely affect the industrial growth of the country. Being an industrial revolutionary country, policymakers should devise economic growth-friendly policies regarding energy conservation and implementing bodies should implement such policies with caution so that economic growth is not affected. Our study’s estimated results were in line with the earlier studies’ estimated results, for example, Tang and Tan, 2013; Zachariadis, 2007; Wang et al., 2011; Ocal and Aslan, 2013; Yoo and Ku, 2009; Borozan, 2013. However, a little trade-off effect was found between energy consumption reduction and adopting new and efficient technologies (Chen et al., 2021). The long-run effect of capital on real-term output was also positive and significant at a 5% significance level over the period for the sampled economy. The estimated elasticity coefficient of capital 0.303 indicated that a 1% change in gross fixed capital formation enhanced economic growth by 0.303% in the long run. This result indicated that capital was recognized as an important contributor that determines Malaysian economic growth. The possible reason could be that Malaysia is a highly attractive investment economy because of its consistent and better economic performance based on sound economic buildings and having more openness to trade policies. Next, the economy has a good macro policy in terms of growth in the pro-private sector form. Furthermore, the country has a well-developed, efficient capital market and bank as well as having the best physical and telecom systems with good infrastructure and matured industrial foundations. However, the other variables such as labor and urbanization showed non-significant influence on the real-term output of the country over the study period. In contrast to Table 3A, the estimated long-run results of Table 3B are non-significant for all the variables.
The observed long-run results of Table 3C between output in real-term per capita and labor were positively and significantly influencing the dependent variable capital. The elasticities for output and labor were 1.62 and 4.94, respectively. A 1% increase in fixed gross capital formation rose real per capita GDP out of the country to 1.62% points. Similar results were obtained in previous literature, for example, Shahbaz et al., 2021; Lean and Smyth, 2010. However, the other variables showed non-significant implications.
In the last part of Table 3D, the long-run association between real per capita GDP and urbanization was reported as significant but negative, which was in contradiction to the economic expectation. The possible reason could be that rapid urbanization growth might slow down the economic growth of a country for the sample data over the specified period. The other reason might be improper urban planning of the country, or it could be that urbanization has marginally influenced economic growth negatively. This result of the study was inconsistent with the results of the previous study (Shahbaz et al., 2021). However, the influence of energy consumption was estimated as positive and significant with the elasticity value of 0.0461, which indicated that growing urbanization increased energy use as people demanded more energy for houses, offices, restaurants, business points, shopping malls, etc. Previous studies’ results supported our study’s estimated results, see Azlina and Mustapha, 2012; Shahbaz et al., 2021; Lean and Smyth, 2010.
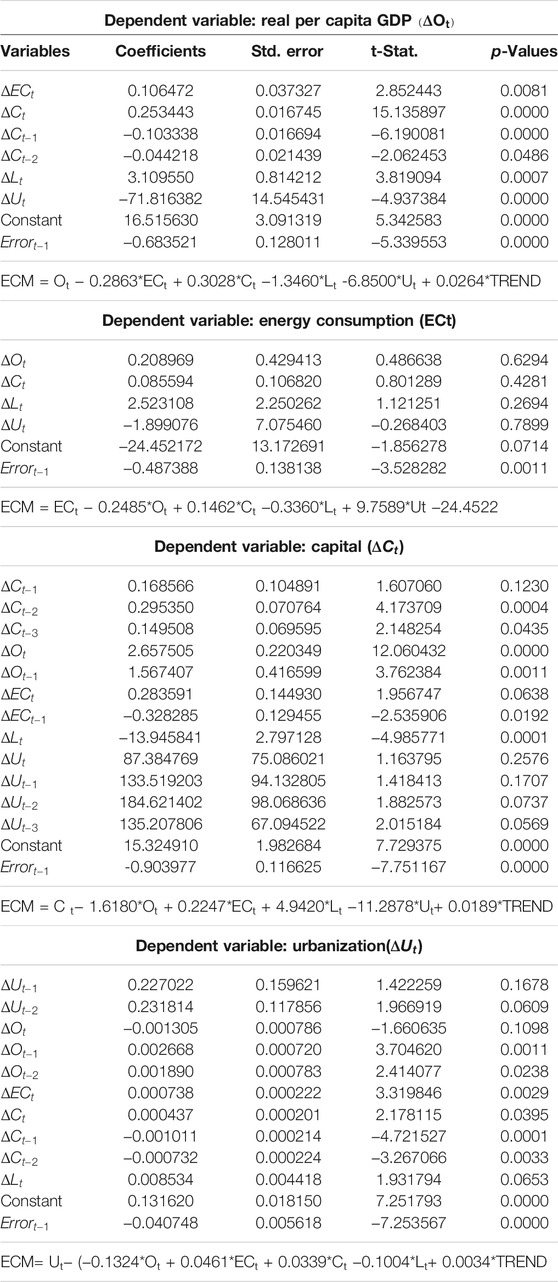
Table 4 reports estimated results of short-term equilibrium dynamic association established in Eq. 8–Eq. 11. The estimated coefficients, t-ratios, and corresponding probabilities along with lagged error terms and error correction model results are presented in the table as well.
Considering the estimated results of Table 4A, while taking differenced real per capita output as a dependent variable and other differenced variables as exogenous, it was revealed all the exogenous variables in the short run influenced real per capita GDP. The one-period lagged error term was found to be significant and negative as was the presumption of the model. The negative and significant error term is technically called the speed of adjustment, which measures the rate of convergence of the endogenous variable to adjust to its equilibrium position when the model gets exogenous shocks. The highly significant negative value -0.68 of the error term showed that the real per capita GDP has a relatively quick adjustment of 0.68% to converge to equilibrium when the model got extraneous shocks in the form of exogenous variables. Table 4B reports no short-run relationship between energy consumption and other regressors of the model. However, the error term was found to be negative and significant with an estimated value of 0.49, as was expected. Looking at the estimated results of Table 4C, it is shown that the first period lagged value does not affect the current value of capital; however, the second and third period own lagged values of capital positively and significantly affect the current value of the capital in the short run. Moreover, short-term gross fixed capital formation and real per capita GDP at the current level as well as the past one period have a positive and significant relationship. It means that, in the short run, capital was positively and significantly influenced by current and past one-period real outputs. In the model, impact of current energy consumption was non-significant; however, the last period of energy use has a positive and significant effect on the gross fixed capital formation. The short-term error term was negative and significant, which showed that the model gets adjusted to its equilibrium relatively at a quicker rate of 0.90% speed in the short run. Keeping in view the reported results of Table 4D, by taking differenced urbanization as a dependent variable and other differenced predictor variables as exogenous, it was revealed all the exogenous variables in the short run influenced urbanization except difference of output and difference of labor. The highly significant negative value -0.041 of the error term showed that urbanization has relatively a bit slow adjustment of 0.041% to converge to equilibrium when the model got extraneous shocks in the form of exogenous variables.
In Table 4, it can be seen that capital and labor were found statistically significant for the dependent variable output at 1 and 5% significance levels. This significance of the variables showed a short-run causal link between the variables. Similarly, taking capital as a dependent variable and other variables as independent variables, output revealed statistical significance at a 1% significance level, so short-run causality existed between the variables.
Once the estimated results of the ARDL bound test confirmed the co-integration, in the next step, we tested the variables for causality for both the short and the long run. The ARDL bound test results showed co-integration behavior, so we applied the VECM framework for Granger causality. The VECM provided us with information about the short-run and long-run causality among energy consumption, income, capital, labor, and urbanization. The negative and significant one-period lagged value of the error term indicated a long-run causal relationship, while the joint significance values of the exogenous variables showed the short causation between the variables. We report causality analysis results in Table 5. Real per capita GDP and capital showed a bidirectional short run and long run, while labor Granger causes income in one direction in both the short run and the long run. Moreover, all other variables were Granger caused long run, and causality was running in both directions.
Conclusion and Policy Implications
Meeting objectives of the current research, the variables income, energy consumption, capital, urbanization, and labor are the mixture of I(1) and I(0); none of them is I(2) and have a long-run co-integration relationship in the case of Malaysia, thus allowing us to apply the ARDL test as an appropriate technique for the current data of the variables and their distributional properties. The computed results also signify the Granger causality test within the vector error correction model (VECM), instead of using the first difference VAR. Contrary to the available previous studies, the findings of the current study further suggest a bidirectional short-run and long-run causal association between income and capital. The results also show a long-run two-way causality running from energy consumption to real per capita GDP, capital, labor, and urbanization, suggesting that the variables have the predicting power to forecast each other in a long-run sampled period. However, there is one-way causality running from labor to per capita GDP in the short run and the long run. This implies that labor may be a significant and useful driver in forecasting Malaysian economic growth in both the short and the long run over the study period.
Suggestively, the study results indicate mixed and contradictory causal investigations between the short run and the long run. Varying results of Granger causality between the short and the long term suggest a time-specific policy adoption. In the short run, no causal relationship is found between output and energy consumption. The results also portray that, in the short term, prudent energy conservation policies and economically improved measures would be of great help and policies based on demand-side management would have no adverse effects on the economic performance of Malaysia. However, energy-dependent and industrialized economy of Malaysian economic growth process can be slowed down in the long run if energy conservation policies of this kind are adopted continuously in the short term. Ordinary people consume electricity for daily routine businesses and livelihood as an input in all sectors of the economy. Consistent with this fact, this empirical result also indicates that energy use and real per capita GDP Granger cause each other in two directions in the long term. Keeping this in mind, and for the stabilization of the long-term clean environment and economic growth relation, alternative and new environmentally friendly energy resources such as renewable energy including solar energy and wind power energy resources should be explored to replace traditional energy resources such as fossil fuels. More R&D investments in the energy sector to design new efficient long-term energy-saving technologies and minimize energy use without any adverse effects on the economic development process be focused. The current research studies the energy–growth causal relationship using a linear ARDL method in the case of Malaysia; however, potential researchers are encouraged to carry out both linear and non-linear relations between the variables. Apart from this, researchers may involve in finding the impact of the policy variable on the relationship.
Data Availability Statement
The original contributions presented in the study are included in the article/Supplementary Material, and further inquiries can be directed to the corresponding author.
Author Contributions
All authors listed have made a substantial, direct, and intellectual contribution to the work and approved it for publication.
Conflict of Interest
The authors declare that the research was conducted in the absence of any commercial or financial relationships that could be construed as a potential conflict of interest.
Publisher’s Note
All claims expressed in this article are solely those of the authors and do not necessarily represent those of their affiliated organizations, or those of the publisher, the editors, and the reviewers. Any product that may be evaluated in this article, or claim that may be made by its manufacturer, is not guaranteed or endorsed by the publisher.
Footnotes
1In the empirical estimation of model (2), technology has been kept constant.
2In such a case, the error correction method (ECM) is suggested and is one of the ways to move further to test for co-integration.
3Taking into account the sample size of our study, we have checked our results with both the Pesaran (2001) LCB and UCB critical values and the critical values of Narayan (Narayan, 2005) (which as reported are suitable for small sample size (30–80) (Shahbaz et al., 2012)), but our study results were not much more different.
4Once co-integration is found in the series and causal relation running from at least one direction, then Granger causality through the VECM is a useful tool to be used for causal link. Moreover, the VECM is a useful method as it differentiates between short- and long-term causal association between variables and helps us to detect joint causality as well (Shahbaz et al., 2012).
5As per the journal requirements to save space and word count, details of the unit root tests and their values in the table form have not been reported here in the text of the paper. However, these details and the computed values can be provided on request from the corresponding author.
6Results can be provided on request from the corresponding author.
References
Ayres, R., Turton, H., and Casten, T. (2007). Energy Efficiency, Sustainability and Economic Growth. Energy 32 (5), 634–648. doi:10.1016/j.energy.2006.06.005
Azlina, a. a., and Mustapha, N. H. N. (2012). Energy, Economic Growth and Pollutant Emissions Nexus: The Case of Malaysia. Proced. - Soc. Behav. Sci., 65, 1–7. doi:10.1016/j.sbspro.2012.11.082
Beaudreau, B. C. (1995). The Impact of Electric Power on Productivity. Energ. Econ. 17, 231–236. doi:10.1016/0140-9883(95)00025-p
Begum, R. A., Sohag, K., Abdullah, S. M. S., and Jaafar, M. (2015). CO2 Emissions, Energy Consumption, Economic and Population Growth in Malaysia. Renew. Sustainable Energ. Rev. 41, 594–601. doi:10.1016/j.rser.2014.07.205
Borozan, D. (2013). Exploring the Relationship between Energy Consumption and GDP: Evidence from Croatia. Energy Policy 59, 373–381. doi:10.1016/j.enpol.2013.03.061
Chandran, V. G. R., Sharma, S., and Madhavan, K. (2010). Electricity Consumption-Growth Nexus: The Case of Malaysia. Energy Policy 38 (1), 606–612. doi:10.1016/j.enpol.2009.10.013
Chen, M., Sinha, A., Hu, K., and Shah, M. I. (2021). “Impact of Technological Innovation on Energy Efficiency in Industry 4.0 Era: Moderation of Shadow Economy in Sustainable Development,”. Technol. Forecast. doi:10.1016/j.techfore.2020.120521
cia.gov (2013). cia.gov. Availableat: www.cia.gov/library/publications/the-world-factbook/geos/my.
Cleveland, C. J., Costanza, R., Hall, C. A. S., and Kaufmann, R. (1984). Energy and the U.S. Economy: a Biophysical Perspective. Science 225 (4665), 890–897. doi:10.1126/science.225.4665.890
Cleveland, C. J. (1999). “Biophysical Economics : From Physiocracy to Ecological Economics and Industrial Ecology. Bioeconomics Sustain. Essays Honor Nicholas Georg. 617, 125–154., no.
Costantini, V., and Martini, C. (2010). The Causality between Energy Consumption and Economic Growth: A Multi-Sectoral Analysis Using Non-stationary Cointegrated Panel Data. Energ. Econ. 32 (3), 591–603. doi:10.1016/j.eneco.2009.09.013
Dale, M., Krumdieck, S., and Bodger, P. (2012). Global Energy Modelling - A Biophysical Approach (GEMBA) Part 2: Methodology. Ecol. Econ. 73, 158–167. doi:10.1016/j.ecolecon.2011.10.028
Ebohon, O. J. (1996). Energy, Economic Growth and Causality in Developing Countries. Energy Policy 24 (5), 447–453. doi:10.1016/0301-4215(96)00027-4
Erdal, G., Erdal, H., and Esengün, K. (2008). The Causality between Energy Consumption and Economic Growth in Turkey. Energy Policy 36 (10), 3838–3842. doi:10.1016/j.enpol.2008.07.012
Foon, T. C. (2009). Electricity Consumption, Income, Foreign Direct Investment, and Population in Malaysia. J. Econ. Stud. 36 (4), 371–382. doi:10.1108/01443580910973583
Ghali, K. H., and El-Sakka, M. I. T. (2004). Energy Use and Output Growth in Canada: a Multivariate Cointegration Analysis. Energ. Econ. 26, 225–238. doi:10.1016/s0140-9883(03)00056-2
Granger, C. W. J. (1969). Investigating Causal Relations by Econometric Models and Cross-Spectral Methods. Econometrica 37 (3), 424–438. doi:10.2307/1912791
Gross, C. (2012). Explaining the (Non-) Causality between Energy and Economic Growth in the U.S.-A Multivariate Sectoral Analysis. Energ. Econ. 34 (2), 489–499. doi:10.1016/j.eneco.2011.12.002
Heckman, J. J. (2008). Econometric Causality. Int. Stat. Rev 76 (1), 1–27. doi:10.1111/j.1751-5823.2007.00024.x
Khan, M. A. (2015). Modelling and Forecasting the Demand for Natural Gas in Pakistan. Renew. Sustainable Energ. Rev. 49, 1145–1159. doi:10.1016/j.rser.2015.04.154
Kivyiro, P., and Arminen, H. (2014). Carbon Dioxide Emissions, Energy Consumption, Economic Growth, and Foreign Direct Investment: Causality Analysis for Sub-saharan Africa. Energy 74, 595–606. doi:10.1016/j.energy.2014.07.025
Kraft, J., and Kraft, A. (1978). On the Relationship between Energy and GNP. J. Energ. Dev. 3 (2), 401–403.
Lean, H. H., and Smyth, R. (2010). Multivariate Granger Causality between Electricity Generation, Exports, Prices and GDP in Malaysia. Energy 35 (9), 3640–3648. doi:10.1016/j.energy.2010.05.008
Lee, C.-C. (2005). Energy Consumption and GDP in Developing Countries: A Cointegrated Panel Analysis. Energ. Econ. 27 (3), 415–427. doi:10.1016/j.eneco.2005.03.003
Mahadevan, R., and Asafu-Adjaye, J. (2007). Energy Consumption, Economic Growth and Prices: A Reassessment Using Panel VECM for Developed and Developing Countries. Energy Policy 35 (4), 2481–2490. doi:10.1016/j.enpol.2006.08.019
Nanthakumar, L., and Subramaniam, T. (2010). Dynamic Cointegration Link between Energy Consumption and Economic Performance: Empirical Evidence from Malaysia. Ijtef 1 (3), 261–267. doi:10.7763/ijtef.2010.v1.47
Narayan, P. K., and Smyth, R. (2008). Energy Consumption and Real GDP in G7 Countries: New Evidence from Panel Cointegration with Structural Breaks. Energ. Econ. 30 (5), 2331–2341. doi:10.1016/j.eneco.2007.10.006
Narayan, P. K. (2005). The Saving and Investment Nexus for China: Evidence from Cointegration Tests. Appl. Econ. 37 (17), 1979–1990. doi:10.1080/00036840500278103
National Energy Balance Malaysia (NEBM) (2009). Malaysian Green Technology Corporation. Peninsular, Malaysia.: Corp., 1–54.
Ocal, O., and Aslan, A. (2013). Renewable Energy Consumption-Economic Growth Nexus in Turkey. Renew. Sustainable Energ. Rev. 28, 494–499. doi:10.1016/j.rser.2013.08.036
Odhiambo, N. M. (2009). Energy Consumption and Economic Growth Nexus in Tanzania: An ARDL Bounds Testing Approach. Energy Policy 37 (2), 617–622. doi:10.1016/j.enpol.2008.09.077
Omri, A., and Kahouli, B. (2014). Causal Relationships between Energy Consumption, Foreign Direct Investment and Economic Growth: Fresh Evidence from Dynamic Simultaneous-Equations Models. Energy Policy 67, 913–922. doi:10.1016/j.enpol.2013.11.067
Ozturk, I. (2010). A Literature Survey on Energy-Growth Nexus. Energy Policy 38 (1), 340–349. doi:10.1016/j.enpol.2009.09.024
Ozturk, I., Aslan, A., and Kalyoncu, H. (2010). Energy Consumption and Economic Growth Relationship: Evidence from Panel Data for Low and Middle Income Countries. Energy Policy 38 (8), 4422–4428. doi:10.1016/j.enpol.2010.03.071
Pesaran, M. H., Shin, Y., and Smith, R. J. (2001). Bounds Testing Approaches to the Analysis of Level Relationships. J. Appl. Econ. 16 (3), 289–326. doi:10.1002/jae.616
Razali, R., Shafie, A., Hassan, A. R., and Khan, H. (2015). A Multivariate Study of Energy Consumption. Urbanizatio , Trade Openness Econ. Growth Malaysia 10 (21), 10275–10280.
Sebri, M., and Ben-Salha, O. (2014). On the Causal Dynamics between Economic Growth, Renewable Energy Consumption, CO 2 Emissions and Trade Openness: Fresh Evidence from BRICS Countries. Renew. Sustainable Energ. Rev. 39, 14–23. doi:10.1016/j.rser.2014.07.033
Shahbaz, M., Hye, Q. M. A., Tiwari, A. K., and Leitão, N. C. (2013). Economic Growth, Energy Consumption, Financial Development, International Trade and CO2 Emissions in Indonesia. Renew. Sustainable Energ. Rev. 25, 109–121. doi:10.1016/j.rser.2013.04.009
Shahbaz, M., Sharma, R., Sinha, A., and Jiao, Z. (2021). Analyzing Nonlinear Impact of Economic Growth Drivers on CO2 Emissions: Designing an SDG Framework for India. Energy Policy. doi:10.1016/j.enpol.2020.111965
Shahbaz, M., Zeshan, M., and Afza, T. (2012). Is Energy Consumption Effective to spur Economic Growth in Pakistan? New Evidence from Bounds Test to Level Relationships and Granger Causality Tests. Econ. Model. 29 (6), 2310–2319. doi:10.1016/j.econmod.2012.06.027
Sinha, A., Shah, M. I., Sengupta, T., and Jiao, Z. (2020). Analyzing Technology-Emissions Association in Top-10 Polluted MENA Countries: How to Ascertain Sustainable Development by Quantile Modeling Approach. J. Environ. Manage. doi:10.1016/j.jenvman.2020.110602
Sinha, A., Shahbaz, M., and Balsalobre, D. (2017). Exploring the Relationship between Energy Usage Segregation and Environmental Degradation in N-11 Countries. ” J. Clean. Prod. doi:10.1016/j.jclepro.2017.09.071
Sinha, A., and Shahbaz, M. (2018). Estimation of Environmental Kuznets Curve for CO2 Emission: Role of Renewable Energy Generation in India. Renew. Energ. doi:10.1016/j.renene.2017.12.058
Sinha, A., Shahbaz, M., and Sengupta, T. (2018). Renewable Energy Policies and Contradictions in Causality: A Case of Next 11 Countries. ” J. Clean. Prod. doi:10.1016/j.jclepro.2018.06.219
Solarin, S. A., and Shahbaz, M. (2015). Natural Gas Consumption and Economic Growth: The Role of Foreign Direct Investment, Capital Formation and Trade Openness in Malaysia. Renew. Sustainable Energ. Rev. 42, 835–845. doi:10.1016/j.rser.2014.10.075
Soytas, U., and Sari, R. (2007). The Relationship between Energy and Production: Evidence from Turkish Manufacturing Industry. Energ. Econ. 29 (6), 1151–1165. doi:10.1016/j.eneco.2006.05.019
Stern, D. I. (2000). A Multivariate Cointegration Analysis of the Role of Energy in the US Macroeconomy. Energ. Econ. 22 (2), 267–283. doi:10.1016/s0140-9883(99)00028-6
Stern, D. I. (1993). Energy and Economic Growth in the USA. Energ. Econ. 15, 137–150. doi:10.1016/0140-9883(93)90033-n
Tang, C. F., and Tan, B. W. (2014). The Linkages Among Energy Consumption, Economic Growth, Relative price, Foreign Direct Investment, and Financial Development in Malaysia. Qual. Quant. 48 (2), 781–797. doi:10.1007/s11135-012-9802-4
Tang, C. F., and Tan, E. C. (2013). Exploring the Nexus of Electricity Consumption, Economic Growth, Energy Prices and Technology Innovation in Malaysia. Appl. Energ. 104, 297–305. doi:10.1016/j.apenergy.2012.10.061
Wang, Y., Wang, Y., Zhou, J., Zhu, X., and Lu, G. (2011). Energy Consumption and Economic Growth in China: A Multivariate Causality Test. Energy Policy 39 (7), 4399–4406. doi:10.1016/j.enpol.2011.04.063
Warr, B. S., and Ayres, R. U. (2010). Evidence of Causality between the Quantity and Quality of Energy Consumption and Economic Growth. Energy 35 (4), 1688–1693. doi:10.1016/j.energy.2009.12.017
Yoo, S.-H., and Ku, S.-J. (2009). Causal Relationship between Nuclear Energy Consumption and Economic Growth: A Multi-Country Analysis. Energy Policy 37 (5), 1905–1913. doi:10.1016/j.enpol.2009.01.012
Zachariadis, T. (2007). Exploring the Relationship between Energy Use and Economic Growth with Bivariate Models: New Evidence from G-7 Countries. Energ. Econ. 29, 1233–1253. doi:10.1016/j.eneco.2007.05.001
Zamani, M. (2007). Energy Consumption and Economic Activities in Iran. Energ. Econ. 29 (6), 1135–1140. doi:10.1016/j.eneco.2006.04.008
Keywords: energy, economic growth, unit root, co-integration, causality
Citation: Khan HN, Alrasheedi M and Shahzada G (2021) A Dynamic Multivariate Causality Analysis of Energy–Growth Nexus Using ARDL Approach: A Malaysian Energy Policy Perspective. Front. Energy Res. 9:735729. doi: 10.3389/fenrg.2021.735729
Received: 03 July 2021; Accepted: 31 July 2021;
Published: 26 November 2021.
Edited by:
Avik Sinha, Goa Institute of Management, IndiaReviewed by:
Muhammad Ibrahim Shah, BRAC University, BangladeshMuntasir Murshed, North South University, Bangladesh
Copyright © 2021 Khan, Alrasheedi and Shahzada. This is an open-access article distributed under the terms of the Creative Commons Attribution License (CC BY). The use, distribution or reproduction in other forums is permitted, provided the original author(s) and the copyright owner(s) are credited and that the original publication in this journal is cited, in accordance with accepted academic practice. No use, distribution or reproduction is permitted which does not comply with these terms.
*Correspondence: Habib Nawaz Khan, aGFiaWJuYXdhemJudUBnbWFpbC5jb20=
 Habib Nawaz Khan
 Melfi Alrasheedi2