 Jianping Yang
 Yue Xiang
 Zeqi Wang
95% of researchers rate our articles as excellent or good
Learn more about the work of our research integrity team to safeguard the quality of each article we publish.
Find out more
ORIGINAL RESEARCH article
Front. Energy Res. , 30 July 2021
Sec. Smart Grids
Volume 9 - 2021 | https://doi.org/10.3389/fenrg.2021.728834
This article is part of the Research Topic The Emerging Form of Smart Grid: Smart Integrated Energy Systems and Prosumer Centred Energy Community View all 16 articles
Power grid enterprises are faced with a serious mismatch between limited investment capacity and numerous investment projects. How to accurately match the weak links with investment projects according to the power system diagnosis is the key to improve investment accuracy. On the basis of an investment-oriented label, a project portfolio optimization framework with coherent diagnosis–evaluation–optimization is proposed in this study. First, a two-layer index system for investment benefit evaluation is established, which considers unit investment efficiency and macroinvestment benefit. Second, by weighing the diagnosis results of power grid and the biased investment environment, the benefit evaluation of the project is implemented as the basis of project portfolio optimization. To meet different investment demands, two combination optimization models of maximizing investment benefit and minimizing investment cost are established considering the coupling benefit relationship and time series relationship between projects. Finally, a case study is conducted for a regional distribution network. The proposed framework has been proven to be able to effectively cope with different investment needs and realize the dynamic adjustment of the scheme in the whole investment cycle.
As a significant part to ensure safe and stable operation of power grids and improve power supply quality, the distribution network planning has become the focus of medium- and long-term investment of power enterprises. Taking China as an example, the scale of power grid investment has increased continuously from 344.8 billion yuan in 2010 to 460 billion yuan in 2020. At the same time, with the access to a high proportion of clean energy and the deepening of the interaction between supply and demand, the investment decision of distribution network involves new elements, such as clean energy (Telukunta et al., 2017; Erdiwansyah and Husin, 2021) installation and automation equipment so that grid investment faces a large number of investment projects of various types. In addition to the basic power supply level and quality, the unbalanced economic development between regions and the policy changes are also within the planning scope of the decision-making level. The traditional rough attribute association system is not conducive to quantifying the investment benefit of the project. Therefore, realizing fine fund allocation and accurate project investment by selecting targeted construction projects from planning projects for efficient investment is of great significance for decision-making departments.
A great deal of research has been conducted in establishing an index evaluation system to optimize distribution network projects. By sorting the investment scale and investment direction of distribution network, an accurate investment project was realized by Wang et al. (2019a). In a study by Liu et al. (2019a), on the basis of the historical power supply situation in a specific area, through the time series weight analysis of key indicators of the distribution network, the urgency consideration function of the feeder is established to optimize a reconstruction project. The entropy weight method is used to make up for the subjective defects in weighting, and the projects are evaluated on the basis of comprehensive quantitative indicators as given in Luo and Li (2013). On the basis of the ability of different attributes to improve existing problems of the distribution network, the optimization index of high- and medium-voltage distribution network is constructed in the study by Tang et al. (2018). The TOPSIS (Technique for Order Preference by Similarity to an Ideal Solution) method is introduced to sort the ideal solutions of the first- and second-level indicators of planning projects and guided the second ranking by project relevance and investment limit as given by Ye et al. (2019). However, the investment projects in the abovementioned models are mainly ranked by scores and lack specific optimization models. In this regard, predecessors have made progress in using optimization models to assist decision making. In the study by Li et al. (2018), a project optimization model combining investment quota and investment scale is constructed by associating the attributes of satisfying power supply demand, heavy load, and neck problem with a single planned project. By focusing on the spatial layout according to the impact of projects under construction on the whole or local distribution network, the dynamic planning of distribution network projects is realized by Fu et al. (2019). The investment efficiency of a single attribute is calculated through the historical investment effect, and the allocation iteration model is established to realize the investment management with different granularities in the work by Li et al. (2019). As given by Wang et al. (2019b), the quantitative and qualitative indexes of project evaluation are transformed into the numerical value of [−1, 1] interval, the subjective risk preference of decision makers is considered, and the maximum prospect optimization model is established. In the study by Huang et al. (2020), considering the random errors of distribution network indicators, a two-stage robust project optimization model under uncertain factors is constructed and the adaptability of the model is verified by the C&CG algorithm.
Besides, there are also studies conducting in-depth discussions based on data envelopment analysis (DEA) in project evaluation (Çelen and Yalçın, 2012; Gouveia et al., 2015; Oskuee et al., 2015; Arcos-Vargas et al., 2017; Mardani et al., 2017; Liu et al., 2019b). The above method builds the model according to the different project characteristics, but the whole system lacks the consideration of the coupling benefit relationship between the projects and fails to finely construct the necessary correlation constraints for the optimization of distribution network projects. In addition, the diagnosis–evaluation–optimization stages in the project optimization process are conducted independently, but a set of coherent project optimization methods is lacking.
In view of the above problems, the tool of investment-oriented label is introduced in this study. A two-layer index system for investment benefit evaluation of distribution network projects is first constructed to diagnose the development of power grids, which quantifies the efficiency of project funds based on the specific label. On the basis of constraints such as traditional total investment, power grid development demand, and portfolio return, combined with the project coupling benefit and timing correlation constraints in actual production, a distribution network portfolio optimization model aiming at maximizing comprehensive benefits and minimizing investment cost is established, respectively. Finally, with years of deduction and analysis of time series results, reference opinions can be provided for dynamic adjustment of investment schemes and improve the effectiveness of project construction.
The rest of the article is organized in the following manner. In the Label-Based Investment Decision Framework section, the investment decision-making framework based on project label is introduced. In the Multistage Project Selection Method Considering Coupling Benefit and Time Series Correlation section, the proposed project portfolio optimization method, considering the characteristics of coupling benefit and time series correlation, is described in detail. In the Case Study section, a case study is conducted for a regional distribution network. Conclusion section draws the conclusions.
China’s power grid investment plan usually takes five years as a cycle. The label-based investment decision process can be summarized as follows:
① Before the investment period, each region reports the project according to the current situation of the local power grid and the expected state of power grids. Because of the difference in specific construction contents, various projects usually have different functional directions, such as meeting the new load demand and strengthening the grid structure to solve heavy overload equipment.
② According to the distribution network construction list and the unit project cost in previous years, the required investment amount in the next planning period is calculated. Then, the project investment effect is estimated; a project label system including different kinds of information (e.g., project basic information, project investment information, project scope information, and project progress information) is also formed.
③ According to the given investment budget and the list of future construction in each region, on the premise of ensuring that the total distribution network investment in each region does not exceed the total investment budget, each investment project is evaluated and screened. The project optimization process is shown in Figure 1.
④ In the five-year cycle, to prevent the expected amount of project investment from changing due to the change of project plan and price level, reviewing and adjusting the investment plans and budgets of each city every year are necessary to ensure that the total project investment in the planning cycle meets expectations.
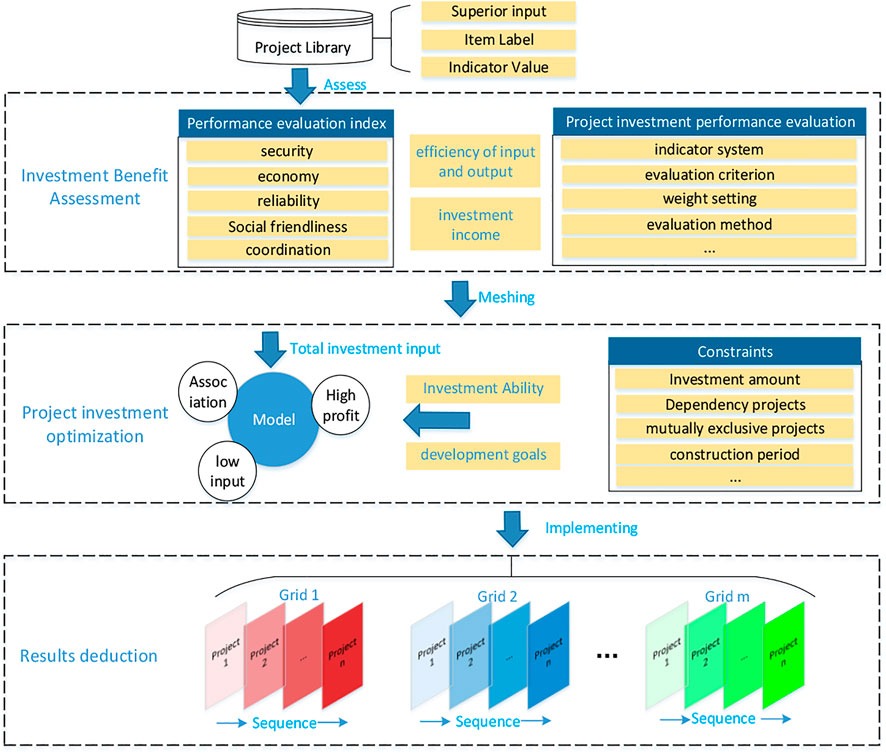
FIGURE 1. Label-based project optimization.
The whole project optimization process can be divided into three main stages: project diagnosis and comprehensive benefit evaluation, project portfolio optimization, and portfolio deduction analysis.
Step 1: project diagnosis and comprehensive benefit evaluation
On the basis of the project label system of distribution network planning, this study investigates the weighting mode of project weight coefficient; considers the development demand, investment expectation, and investment ability as a whole; and establishes an intelligent evaluation model aimed at the optimal comprehensive benefit of technology, economy, and society.
Step 2: optimal selection of project portfolio
Under the given investment capacity or development demand, an intelligent optimal selection model aiming at the optimal comprehensive benefit of technology, economy, and society can be established. Here, the objective function considers the coupling benefit characteristics and the constraints involve time series correlation characteristics among the projects.
Step 3: Analysis of portfolio deduction
The results deduction analysis considers the investment preference in different time periods and flexibly selects the appropriate investment decision model according to different investment needs. Through time series analysis, the investment scheme can be dynamically adjusted in the whole life cycle.
The next section describes the details of each phase.
The fundamental purpose of investment decision precision is to improve efficiency. A scientific and reasonable index evaluation system is the basis of analyzing the input and output of the distribution network. At present, relevant research (Mansor and Levi, 2017; Molina et al., 2017) has provided a comprehensive index evaluation system. To harmonize the results of portfolio investment benefit evaluation and power grid development diagnosis, the evaluation index system used in this study is divided into two layers which are shown in Table 1. The upper index is used to diagnose the current situation of power grid development to accurately sense the investment demand and determine the boundary conditions of the optimal selection model. The lower index is mainly used for the comprehensive benefit evaluation of the project through scoring to quantify the unit input–output benefits of different dimensions to provide a numerical basis for the optimal selection of project portfolio. In this research, considering the evaluation objectives, objectivity, and difficulty of data acquisition, the evaluation index system reference is given from five levels: grid strength, power supply safety quality, operation economy and efficiency, power supply coordination, and social friendliness. On the basis of the target layer index, according to the actual situation of the target distribution network, we can select the representative quite easily to quantify the index, such as voltage qualified rate and network loss rate. The index system includes the traditional dimensions of safety, economy, and reliability, considering the new characteristics of distributed energy and electric vehicles, focusing on the investment efficiency of the project.
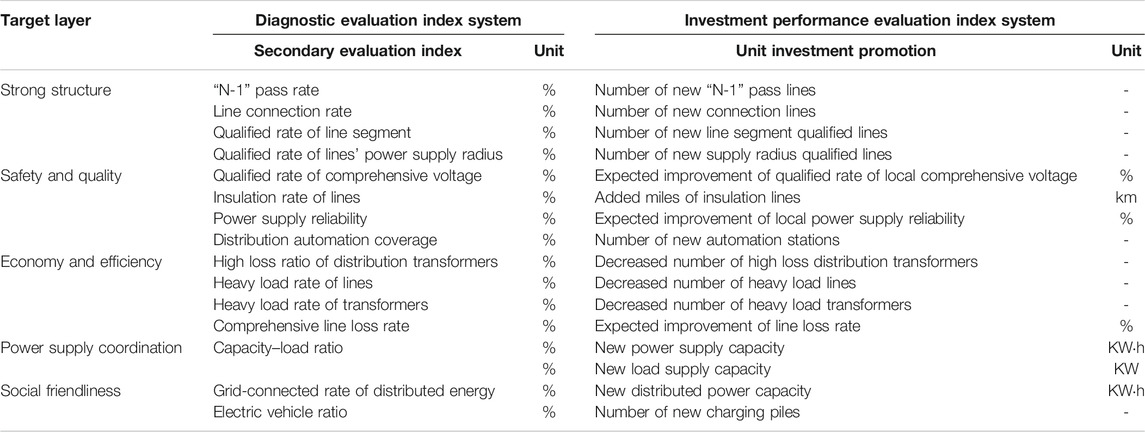
TABLE 1. Benefit index system of distribution network portfolio investment.
The evaluation index of different dimensions is usually reflected by the way of empowerment. However, the power grid investment decision is a complex decision-making process affected by multidimensional factors such as investment capacity and policy orientation. Subjective weighting (Shen et al., 2018; Alvarado et al., 2019) ignores the natural physical relationship among indicators, whereas objective weighting (Muñoz-Delgado et al., 2019; Verástegui et al., 2019) based on the data itself cannot consider the external environmental impact dominated by human factors. In this study, the index weight and investment weight are used to quantitatively evaluate the impact of the internal development of the power grid and the external complex environment on the key investment direction of the power grid.
On the one hand, with the results of power system diagnosis, the index weight w1 of different dimensions can be determined by the difference between the current development situation and the expected objectives, which can directly reflect the weak links of power grid development to screen the investment projects. Eq. 1 is the formula used for calculating the index weight as follows:
where
On the other hand, under the constraint of the total investment, the distribution network investment should also emphasize the investment bias and have a choice. In different periods, different regions may have different investment weights w2. For example, high requirements for power supply quality are demanded during the Olympic Games. w2 can be flexibly adjusted on the basis of w1 to meet different investment needs. In general, w2 is mainly given by experts’ experience according to the actual situation in a certain period, considering factors such as natural climate and environment and policy support. w2 can also be flexibly adjusted according to work priorities or experiences.
Finally, the comprehensive weight can be calculated as follows:
Considering the different dimensions and attributes of each index, initializing the data is necessary before the comprehensive scoring of the project is performed. According to the principle of preferred investment, the larger the output value of unit investment is, the more ideal it will be. The maximum value of the index in all projects is set to 100 points, whereas the minimum value is 0 points. The scores of each index are calculated as follows:
where si,j and li,j are the jth index scores and data values of the ith project and ljmax and ljmin represent the maximum and minimum values of the jth index in all projects, respectively.
The investment benefit score of a single project can be calculated using the following formula:
where Si is the comprehensive score of the ith investment project; si,j are the scores of the jth index; wm represents the weight of the kth objective criterion; and n represents the total number of indicators.
Some distribution network planning projects have the characteristics of matching and continuity (Shen et al., 2020). According to the benefit relationship from two projects or a single one, the project coupling benefit characteristics can be defined as compatibility and support. Figure 2 illustrates the diagram of both coupling benefit characteristics.
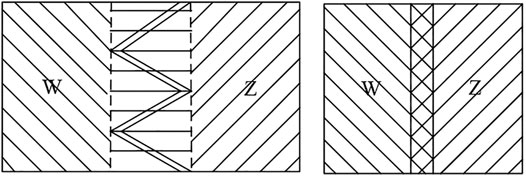
FIGURE 2. Coupling benefit relationship of projects.
In addition to the coupling benefit characteristics, time series correlation characteristics also exist among distribution network planning projects according to the construction requirements and time. Thus, some distribution network planning projects must be constructed according to certain timing construction, cannot be put into operation at the same time, or must be put into operation at the same time to be able to implement and play a role, respectively, defined as dependent, mutually exclusive, and complementary characteristics.
According to the difference in objective function, the investment decision problem in this study is divided into two categories: one is to improve the performance within a certain amount of investment, and the other is to minimize the total investment cost under certain security constraints. To improve the comprehensive investment benefit of distribution network and minimize the investment cost in the economic life cycle of equipment, the optimal selection model of the project is established.
The optimal performance improvement model mainly solves the problem of how to improve the performance index of the distribution network as much as possible under the condition that the total investment is certain. In Eq. 4,
where
where c represents the project investment cost and t represents the investment year.
The minimum investment cost model considers the problem of how to find the technical path with the minimum investment under certain performance index requirements. At this time, the model takes the minimum total investment amount as the objective function as follows:
where
where
In addition to the total investment constraints and performance constraints, the two models should meet other basic constraints, such as mutually exclusive and complementary project constraints.
Suppose
Suppose
Suppose
Given that the project selection process considers the multiyear timing relationship, to avoid the same project being selected multiple times in different years, the radio constraint should be added for each project and the function relationship can be expressed as follows:
where
Some logical constraints exist between the one-year selected state and the final selected state. No matter which year of project i is selected in the investment cycle, the project will be reflected as the final selection. That is, the project selected in a single year must be selected in the final project, expressed in mathematical terms as follows:
Taking a batch of investment plans of a county-level company as an example, the proposed model is verified. The annual power supply capacity of the company’s 35 kV and below distribution network is 2.101 billion kWh, the average annual load of the whole society is 119.92 MW, and 2,743 distribution transformers (including on-column transformers) and 180 medium-voltage distribution lines (35 and 10 kV) are installed. The electricity consumption of the secondary industry accounts for 60.13%, mainly textile and manufacturing industries, and the electricity consumption of the tertiary industry and residents accounts for 33.54%. In recent years, the electricity consumption of the service and commercial industries has increased rapidly and the annual load growth rate is expected to reach 5.3%. The electrification degree of terminal energy consumption in the county is high, and the proportion of electricity consumption in the tertiary industry is increasing year by year. The investment capital is planned to be 30 million yuan. Twenty key alternative projects exist in the project library, with a total capital demand of 52.6731 million yuan, far exceeding the existing investment capacity. This section assumes that the investment period is five years. First, the diagnosis and analysis process of power grid development is displayed on the basis of the project label, and the weights of various indicators are obtained by analyzing the weak links according to the diagnosis results. Second, taking the calculation of investment performance of a project as an example, the scoring method is expounded. Considering the coupling benefit and time series relationships of the project, the optimal multiyear portfolio investment scheme of the distribution network project in this region is also calculated. Last, to adapt to the changing investment demand in the whole life cycle, by setting different development scenarios, the project optimization scheme is extended and deduced on the basis of the proposed project optimization model for realizing the dynamic adjustment of the scheme.
The statistics of power grid development indicators in this area are shown in Table 2, in which the current power grid index values and expected index values are given.
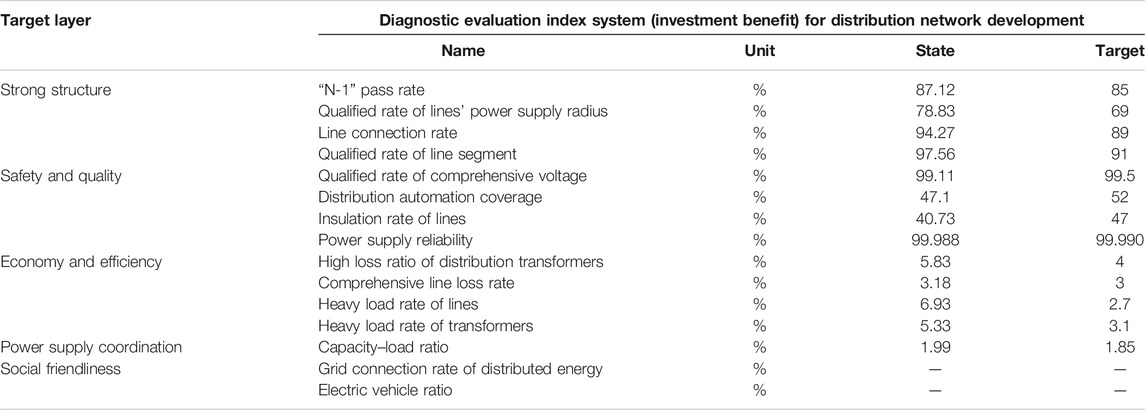
TABLE 2. Power system diagnosis results.
From the results of the diagnosis and analysis, all indicators meet the expected requirements; the qualified rate of line segmentation and line connection rate reach 97.56 and 94.27%, respectively, indicating that the network frame of the area is relatively strong. However, a huge gap is observed between the current and expected values of power supply safety and quality. For example, the coverage rate of distribution automation and the line insulation rate are only 47.1 and 40.73%, respectively, suggesting a gap with expectations. In addition, further optimization is needed for the equipment loss. Through the above analysis, the idea that the key points of regional investment should be concentrated on power safety and quality and on the economic and efficient operation can be concluded.
According to the method of determining the weight described in the Project Diagnosis and Comprehensive Benefit Evaluation section, the weight of the indicators shown in Table 3 is obtained.

TABLE 3. Setting of indicator weight.
Figure 3 shows the content and structure of the project label by taking Project 1 as an example. Four kinds of indicators, namely, project type, project correlation, project function, and project effectiveness, are distinguished by different colors. Reference information is also revealed by labels in different stages of project optimization.
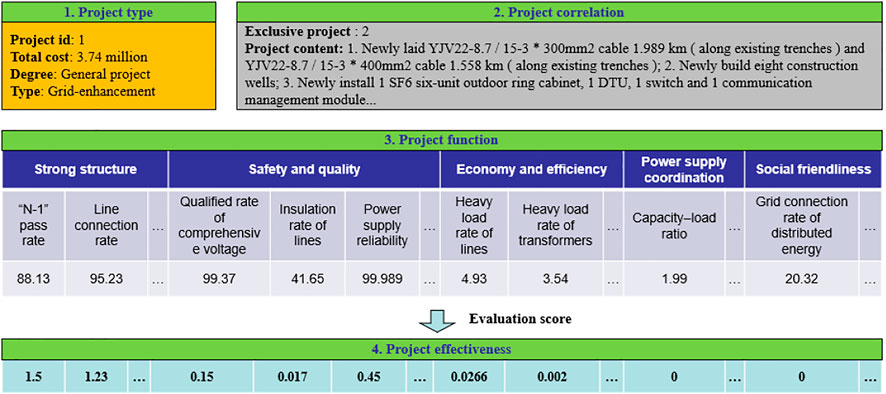
FIGURE 3. Example of project label content display.
Among them, the project type index describes the functional classification of the project; the project function index provides the estimated values of various diagnostic indicators after the implementation of the project; the project effectiveness index shows the unit investment return brought by construction project n on the basis of the project function index, which mainly provides data information for the evaluation and scoring of this project; the and project correlation index includes the construction urgency, mutually exclusive project, complementary project, and dependent project of Project 1, which provides constraint conditions for the combination optimization model. Based on the contents in the Project Diagnosis and Comprehensive Benefit Evaluation section, the scoring results of Project 1 are shown in Table 4.
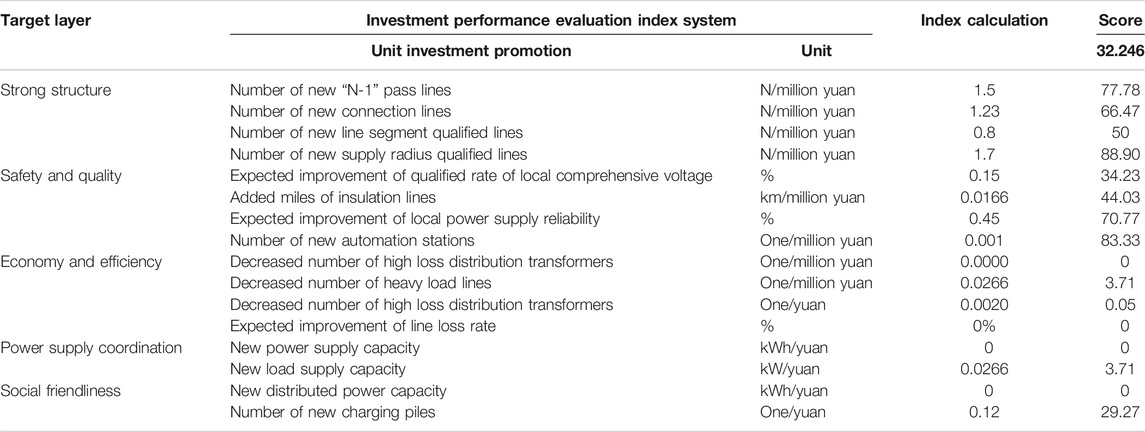
TABLE 4. Investment benefit score of Project 1.
The project properties of the label show that the project is mainly used to strengthen the grid structure, including the construction of new wells, underground cables, and new communication equipment. The qualified rate of subsection and the index of automatic distribution with per unit of line invested are excellent, the scores of which are 88.9 and 83.33, respectively. The underground cable laying not only effectively improves the poor insulation rate in the area but also further improves the power supply quality. Moreover, due to the implementation of the project, the comprehensive rate of voltage qualification in this area is expected to increase by 0.15% and the reliability of power supply will increase by 0.45%.
The five major categories of projects in the project library, namely, load-satisfaction, weakness-elimination, substation-supplementary, grid-enhancement, and overload-relief are evaluated in Table 5, where T1, T2, T3, T4, and T5 represent the five performance categories, namely, strong structure, safety and quality, economy and efficiency, power supply coordination, and social friendliness.
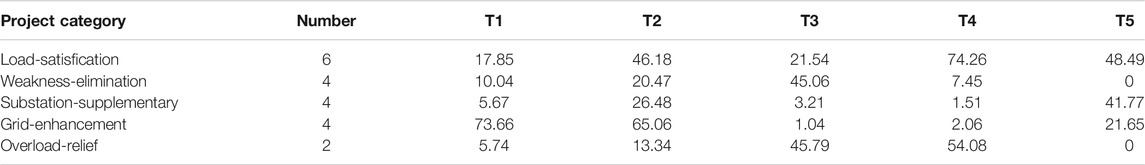
TABLE 5. Statistics of various projects.
The evaluation results based on the scoring standard will be compared and indicate the benefit contribution from various projects intuitively. The load-satisfaction projects that meet the added demand load mainly improve the indicators of power supply coordination, power supply safety, and social friendliness, and the average scores reach 74.26, 46.18, and 48.49, respectively. The weakness-elimination projects to eliminate hidden danger of equipment and overload-relief projects to solve line overload can significantly reduce the equipment loss and heavy load, and make great contributions to improve the economy and efficiency with the scores of 45.06 and 45.79, while the grid-enhancement projects is mainly conducive to the grid stability and power supply quality.
Considering the impact of uncertain load growth in the future, there is a preference in the setting of investment weights w2 which is given as
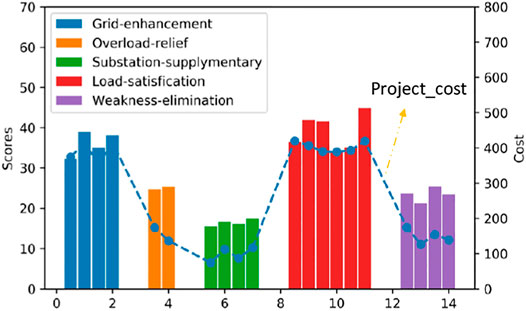
FIGURE 4. Cost-benefit display of various projects.
During the actual project optimization process, apart from the investment cost constraint, the investment benefit should also consider the time series correlation constraints, such as mutually exclusive, dependent, and complementary projects. The optimal portfolio cannot be selected simply by the score. On the basis of the project labels shown in the Power System Diagnosis and Analysis section, the coupling benefit relationship among various projects is given. The basic information is presented in Table 6. In particular, Project 11←Project 3 indicates that Project 11 depends on Project 3 to be implemented.
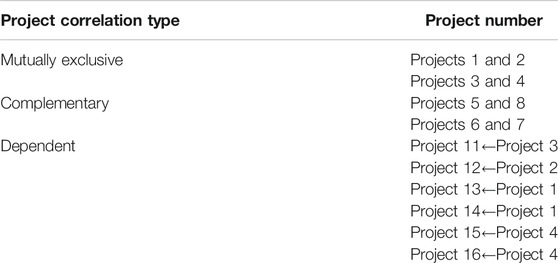
TABLE 6. Statistics of project time series correlation constraints.
According to the project optimization model proposed in this study, the optimization of the abovementioned project library is divided into the following three cases:
Case 1: given that the total investment limit of the region in the investment cycle is 30 million yuan, the goal is to maximize the investment benefit for five years in the whole investment cycle. The optimization process considers the project coupling benefit relationship and time series correlation relationship.
Case 2: Investment decisions are independent each year in the investment cycle, and investment optimization is performed on the basis of the previous year’s investment portfolio with the maximization of investment benefit as the objective function. For the convenience of comparative analysis, the total investment limit in the investment cycle of this region is set to be the same as case 1, and the total investment in each year is six, seven, six, five, and six million.
Case 3: Given the constraints of (1) meeting the annual maximum load growth of 5.3%, (2) the N-1 pass rate being increased to 90%, and (3) maintaining the proportion of heavy overload equipment below 3%, the investment ability is unknown and the goal is to minimize the total investment cost while meeting the performance requirements.
GUROBI is used to solve the problem, and the optimal portfolio scheme is obtained, as illustrated in Figure 5.
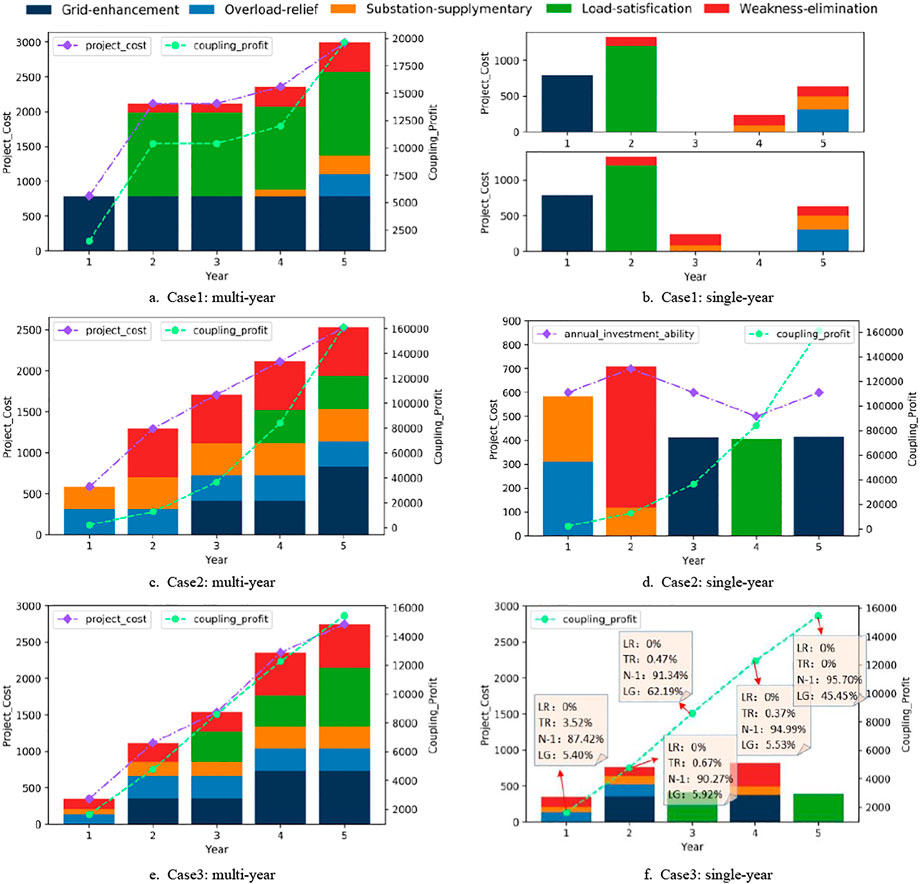
FIGURE 5. Optimal portfolio scheme under different cases.
Figure 5 displays the project portfolio schemes under different cases in which multiyear shows the total investment distribution and corresponding accumulated benefits as of each year, whereas single year shows the new projects and the investment proportion of various projects every year in the investment cycle. In addition, the single year in case 2 gives the investment ability of each year additionally. Also, the single year in case 3 indicates the index improvement value of each year. LR, TR, N-1, and LG, respectively, represent the heavy load rate of lines, the heavy load rate of transformers, the “N-1” pass rate, and the satisfied load growth rate.
As illustrated in Figure 5, cases 1 and 2 use the maximum investment benefit model, whereas case 3 uses the minimum investment cost model for project optimization. From the perspective of investment benefit, the benefits brought by case 1 are obviously higher than those of the two other cases, thereby maximizing the benefits of all cases. However, case 1 also has higher investment costs. As observed in the f in Figure 5, LR, TR, N-1, and LG of case 3, respectively, reached 0, 0, 95.7, and 45.45% in the fifth year, which met the performance requirements and ensured the economy well. This finding is consistent with the original intention of the model setting. By setting different models, the proposed model can flexibly meet different investment decision-making needs.
In addition, some details between cases 1 and 2 deserve further discussion. Although case 2 adopts the model of maximizing investment benefit, the ultimate benefit improvement is less than case 1. The reason is that the investment decision-making process is conducted every year, which is limited by the annual total investment. Moreover, the flexibility of the project portfolio decreases to a certain extent; thus, the optimal project portfolio scheme cannot be obtained. From this perspective, we can see that case 1 can make more effective use of funds and achieve better investment benefits. However, due to the influence of geographical environments, natural disasters, and policy requirements, determining the load growth and various unexpected situations in advance for the actual investment decision-making process is often difficult. In addition, the optimal investment portfolio scheme in the whole multiyear investment cycle can only be determined on the basis of the investment background of the first year, which makes the investment scheme deviate greatly from reality. Considering that case 1 takes the total investment benefit in the investment cycle as the objective function and lacks specific constraints on a single-year investment, no project may be selected in nth year. In this scenario, no essential difference is observed when n takes 3 or 4, and the optimal portfolio scheme may not be unique. However, during the actual process, the uncertainty of the scheme may bring different risks and benefits, which are often difficult to quantify. Coincidentally, case 2 can only effectively make up for the poor flexibility by making investment decisions separately. Through the combination of cases 1 and 2, various complex investment scenarios can be considered comprehensively, thus providing reference opinions for the dynamic adjustment of optimized portfolio in the whole investment cycle.
In view of the problems of extensive investment and low investment efficiency in the current power grid investment, this study integrates the stages of diagnosis–evaluation–optimization by introducing investment-oriented label and puts forward a decision-making framework for an accurate investment in distribution network, considering the coupling relationship of project benefit and time series correlation. The following conclusions are drawn through the case study:
1) The adoption of a two-layer index system can macroscopically analyze local investment demand and quantify the investment efficiency of a single project. By setting the two-layer weights of investment weight and index weight, the weak links of power grid development can be effectively matched with various investment projects. While considering the influence of external investment environment, the investment portfolio can also be targeted according to the actual situation which improves the investment accuracy.
2) By introducing the concept of investment-oriented label, the problems of inconsistent information and dimensions of various projects are solved; the coupling benefit relationship and time series relationship between various projects are also quantitatively considered during the project optimization process. The proposed method can well meet the investment demand under the two modes of maximizing investment benefit and minimizing investment cost.
3) By setting different cases, the advantages and disadvantages of two investment decision-making schemes based on single-year and multiyear investment are demonstrated. The results reveal that the multiyear investment scheme can make more effective use of funds and obtain better investment benefits, but it cannot cope with the investment capacity and the change of investment environment in the investment cycle. Moreover, a situation exists where the optimal scheme is not unique, which further brings different risks and benefits. The combination of the two schemes can consider various complex investment scenarios more comprehensively and realize the dynamic adjustment of the optimized portfolio in the whole investment cycle.
The original contributions presented in the study are included in the article/supplementary material; further inquiries can be directed to the corresponding author.
JY and YX: conceptualization and methodology; JY: writing—original draft preparation; YX: supervision; ZW, JD, and YW: writing—reviewing and editing.
This project was supported by the Young Elite Scientists Sponsorship Program by the Chinese Society of Electrical Engineering (CSEE-YESS-2018006) and the National Natural Science Foundation of China (U2066209).
The authors declare that the research was conducted in the absence of any commercial or financial relationships that could be construed as a potential conflict of interest.
All claims expressed in this article are solely those of the authors and do not necessarily represent those of their affiliated organizations, or those of the publisher, the editors and the reviewers. Any product that may be evaluated in this article, or claim that may be made by its manufacturer, is not guaranteed or endorsed by the publisher.
Alvarado, D., Moreira, A., Moreno, R., and Strbac, G. (2019). Transmission Network Investment with Distributed Energy Resources and Distributionally Robust Security. IEEE Trans. Power Syst. 34 (6), 5157–5168. doi:10.1109/tpwrs.2018.2867226
Arcos-Vargas, A., Núñez-Hernández, F., and Villa-Caro, G. (2017). A DEA Analysis of Electricity Distribution in Spain: an Industrial Policy Recommendation. Energy Policy 102, 583–592. doi:10.1016/j.enpol.2017.01.004
Çelen, A., and Yalçın, N. (2012). Performance Assessment of Turkish Electricity Distribution Utilities: an Application of Combined FAHP/TOPSIS/DEA Methodology to Incorporate Quality of Service. Utilities Policy 23 (4), 59–71. doi:10.1016/j.jup.2012.05.003
Erdiwansyah, Mahidin., and Husin, H. (2021). A Critical Review of the Integration of Renewable Energy Sources with Various Technologies. Prot. Control. Mod. Power Syst. V (1), 37–54.
Fu, G. H., Li, Q. Y., and Li, K. (2019). A Dynamic Project Selection Method Based on Network Analysis. Comput. Tech. Automation 38 (02), 51–57.
Gouveia, M. C., Dias, L. C., Antunes, C. H., Boucinha, J., and Inácio, C. F. (2015). Benchmarking of Maintenance and Outage Repair in an Electricity Distribution Company Using the Value-Based DEA Method. Omega 53, 104–114. doi:10.1016/j.omega.2014.12.003
Huang, J. Q., Zhang, Y. W., and He, J. F. (2020). A Robust Expansion Planning Method for Distribution Networks Considering Extreme Scenarios. Electric Power Construction 41 (07), 67–74.
Li, K., Fu, G. H., and Tian, C. Z. (2019). Distribution Network Investment Allocation and Project Optimization Method Considering the Historical Investment Effectiveness. Comput. Tech. Automation 38 (03), 33–38.
Li, w., Cui, W. T., and Feng, J. H. (2018). Investment Decision-Making Method of Medium Voltage Distribution Network Considering Project Attributes. Proc. CSU-EPSA 30 (05), 50–55+62.
Liu, H. F., Liu, H. P., and Zhang, Y. F. (2019). Auxiliary Decision-Making for Optimization of Distribution Network Reconstruction Projects. Rural Electrification 2019 (10), 14–16.
Liu, Y., Wang, M., Liu, X., and Xiang, Y. (2019). Evaluating Investment Strategies for Distribution Networks Based on Yardstick Competition and DEA. Electric Power Syst. Res. 174, 105868. doi:10.1016/j.epsr.2019.105868
Luo, Y., and Li, Y. L. (2013). Comprehensive Decision-Making of Transmission Network Planning Based on Entropy Weight and Grey Relational Analysis. Power Syst. Tech. 37 (01), 77–81.
Mansor, N. N., and Levi, V. (2017). Integrated Planning of Distribution Networks Considering Utility Planning Concepts. IEEE Trans. Power Syst. 32 (6), 4656–4672. doi:10.1109/tpwrs.2017.2687099
Mardani, A., Zavadskas, E. K., Streimikiene, D., Jusoh, A., and Khoshnoudi, M. (2017). A Comprehensive Review of Data Envelopment Analysis (DEA) Approach in Energy Efficiency. Renew. Sust. Energ. Rev. 70, 1298–1322. doi:10.1016/j.rser.2016.12.030
Molina, J. D., Contreras, J., and Rudnick, H. (2017). A Risk-Constrained Project Portfolio in Centralized Transmission Expansion Planning. IEEE Syst. J. 11 (3), 1653–1661. doi:10.1109/jsyst.2014.2345736
Muñoz-Delgado, G., Contreras, J., and Arroyo, J. M. (2019). Distribution System Expansion Planning Considering Non-Utility-Owned DG and an Independent Distribution System Operator. IEEE Trans. Power Syst. 34 (4), 2588–2597. doi:10.1109/tpwrs.2019.2897869
Oskuee, M. R. J., Babazadeh, E., and Najafi-Ravadanegh, S. (2015). Multi-Stage Planning of Distribution Networks with Application of Multi-Objective Algorithm Accompanied by DEA Considering Economical, Environmental and Technical Improvements. J. Circuits Syst. Comput. 25 (04), 1650025. Article 1650025.
Shen, M. Y., Hu, Z. S., Liu, Z. Y., Dai, P., Huang, J. J., and Yang, L. (2020). Optimal Multi-Stage Dual-Q Selection for Distribution Network Planning Projects Considering Benefit Coupling and Timing Correlation Characteristics. Electric Power Automation Equipment 40 (06), 22–2933.
Shen, X., Shahidehpour, M., Zhu, S., Han, Y., and Zheng, J. (2018). Multi-Stage Planning of Active Distribution Networks Considering the Co-Optimization of Operation Strategies. IEEE Trans. Smart Grid 9 (2), 1425–1433. doi:10.1109/tsg.2016.2591586
Tang, W., Zhang, H. H., and Xiao, S. (2018). Research on Accurate Investment Strategy of Distribution Network Based on Attribute Classification of Planning Projects. Sci. Tech. Industry 18 (01), 63–67.
Telukunta, V., Pradhan, J., Pradhan, J., Agrawal, A., Singh, M., and Srivani, S. G. (2017). Protection Challenges under Bulk Penetration of Renewable Energy Resources in Power Systems: A Review. Csee Jpes 3 (04), 365–379. doi:10.17775/cseejpes.2017.00030
Verástegui, F., Lorca, A., Olivares, D. E., Negrete-Pincetic, M., and Gazmuri, P. (2019). An Adaptive Robust Optimization Model for Power Systems Planning with Operational Uncertainty. IEEE Trans. Power Syst. 34 (6), 4606–4616. doi:10.1109/tpwrs.2019.2917854
Wang, Y. X., Fang, R. C., Zhang, J., Ge, T., and Chen, Y. B. (2019). Research on Investment Decision System of Distribution Network. distribution Netw. Technol. 47 (02), 56–62.
Wang, Z. C., Pan, X. P., and Ma, Q. (2019). Multi-Attribute Investment Ranking Method for Power Grid Project Construction Based on Improved Prospect Theory of “Rewarding Good and Punishing Bad” Linear Transformation. Power Syst. Tech. 43 (06), 2154–2164.
Keywords: investment decision, distribution network, power system diagnosis, project portfolio, evaluation
Citation: Yang J, Xiang Y, Wang Z, Dai J and Wang Y (2021) Optimal Investment Decision of Distribution Network With Investment Ability and Project Correlation Constraints. Front. Energy Res. 9:728834. doi: 10.3389/fenrg.2021.728834
Received: 22 June 2021; Accepted: 30 June 2021;
Published: 30 July 2021.
Edited by:
Chenghong Gu, University of Bath, United KingdomCopyright © 2021 Yang, Xiang, Wang, Dai and Wang. This is an open-access article distributed under the terms of the Creative Commons Attribution License (CC BY). The use, distribution or reproduction in other forums is permitted, provided the original author(s) and the copyright owner(s) are credited and that the original publication in this journal is cited, in accordance with accepted academic practice. No use, distribution or reproduction is permitted which does not comply with these terms.
*Correspondence: Yue Xiang, eGlhbmdAc2N1LmVkdS5jbg==
Disclaimer: All claims expressed in this article are solely those of the authors and do not necessarily represent those of their affiliated organizations, or those of the publisher, the editors and the reviewers. Any product that may be evaluated in this article or claim that may be made by its manufacturer is not guaranteed or endorsed by the publisher.
Research integrity at Frontiers
Learn more about the work of our research integrity team to safeguard the quality of each article we publish.