- 1College of Energy and Electrical Engineering, Hohai University, Nanjing, China
- 2Institution of Ocean and Offshore Engineering, Hohai University, Nantong, China
- 3Jiangsu Key Laboratory of Hi-Tech Research for Wind Turbine Design, Nanjing University of Aeronautics and Astronautics, Nanjing, China
Counter-rotating vortex generators (VGs) are typically employed to delay airflow separation on wind turbine blades. Large-size wind turbine blades equipped with small size VGs make the computational fluid dynamics (CFD) researches require a great deal of computational resources. Parametric models of VGs can effectively improve the numerical research efficiency of wind turbine blades with VGs. In order to improve the accuracy of such parametric models, this study proposed a series of modeling approaches to determine the positions of the adding source term in Cartesian coordinates, the VG vortex core radius, etc., on the wind turbine airfoils. These techniques are integrated with a maximum circulation algorithm by considering the interactions between VG pairs to predict the performance of a DU91-W2-250 blade section with VGs. The proposed parametric model and an entity model at different angles of attack (AoAs) are implemented on the blade section. Our approach is validated using experimental data. Comparisons demonstrate a strong agreement between the modelled and experimental results, proving the high accuracy of the two models. The numerical results of the models are then compared and analyzed at different incoming flow velocities and AoAs to verify the universality of the proposed parametric approaches. The results reveal a high consistency between the vortex structure, the velocity profile above the blade surface and the distribution of the pressure coefficient calculated by the two models. This proves the high universality of the proposed approaches and demonstrates the potential of the parametric model in replacing the VG entity model. The VG parametric model expresses VG parameters by program, which can improve the research efficiency of VG arrangement on wind turbine blades.
Introduction
The vortex generator (VG), initially proposed by Taylor (1947), is a passive flow control technology that can effectively improve the aerodynamic performance of wind turbine blades. An incidence angle is formed between the VG and the airstream as the latter flows through the former. The trailing vortices shedding from the trailing-edge of the VGs increase the mixing of the high-energy flow outside the boundary layer with the low-energy flow inside the boundary layer, enlarge the momentum and energy of the airflow within the boundary layer, and delay the airflow separation (Godard and Stanislas, 2006; Fernandez et al., 2012). VG can effectively control the air flow and enhance the power production of wind turbine (Astolfi et al., 2019), so it has recently been the focus of much research in the field of wind turbines.
Computational fluid dynamics (CFD) is key in the evaluation of the aerodynamic performance of wind turbines. However, small-sized VGs substantially increase the numerical cost of large-size wind turbine blades with VGs. In order to overcome this problem, numerous parametric models have been established related to flow and VG geometry parameters, replacing the physical VGs in CFD research. The BAY model is the earliest parametric model in which a small number of grid cells are employed to model the VGs, yet it is not able to precisely provide the grid cell locations representing the VGs (Bender et al., 1999). Thus, the jBAY model was developed to improve its predecessor by replacing the VGs with non-thickness mesh surfaces (Jirásek, 2004). However, these two models fail to substantially reduce the grid number in the VG region. An alternative parametric approach is to model the effect of the VG trailing vortex. Such parametric models contain two components: i) the simulation of the trailing vortex structure; and ii) the development of a maximum circulation algorithm for the VGs. These two components determine whether the effect of the VG trailing vortices can be accurately modeled by the parametric approach. Lamb-Oseen vortex model is considered as optimal for the first component. May (2001) first introduced the Lamb-Oseen vortex model into the calculation of the trailing vortices, demonstrating the accurate predictions by this model for the trailing vortices. Similar work was performed by Wendt and Bruce (2004), who confirmed the accuracy of the Lamb-Oseen vortex model. Wendt also analyzed the relationship between the circulation, VG geometry parameters and flow field parameters for the second component of the parametric model and proposed a formula for the VG circulation. Dudek (2006) employed Wendt’s algorithm to predict the performance of a rectangular Booker and Zhang (2009) proposed a circulation algorithm for large-scale VGs, in which the tangential velocity and axial velocity distribution are set in a cylinder region by the source term to model the topology structure of the trailing vortex. Based on the lifting-line and wing theories, Zhang et al. (2011) presented a method to calculate the circulation of triangular VGs, revealing further improvements in the evaluation accuracy compared to previous models. Velte and Hansen (2013), Velte et al. (2011, 2016) also implemented a parametric model for rectangular VGs. However, the aforementioned studies primarily focus on developing the maximum circulation model algorithm for a single VG rather than VG arrays. Traub (2001) parametrically modeled a pair of delta wings and calculated the corresponding lift coefficient. The results indicated that the interaction between two delta wings should not be ignored. Considering that counter-rotating triangle type VG arrays are generally mounted on the wind turbine blade, Zhao et al. (2017) accounted for the inter-effects between VG pairs to propose an algorithm for VG pairs. The proposed model exhibited a higher accuracy than those of Zhang and Wendt.
Previous literature has made substantial progress on the maximum circulation method, validating the accuracy of the Lamb-Oseen model by simulating the topology structure of VG trailing vortices. However, research on the application of these parametric models on wind turbine blades, including approaches for the adding positions of trailing vortex cores, the trailing vortex core radius and the mesh strategy in the source term region, is lacking. In the current study, the DU91-W2-250 blade section was implemented in Zhao et al. (2017) algorithm and the Lamb-Oseen model to predict the VG performance. The effect of these approaches on the accuracy of the parametric model is analyzed. The results of the parametric and entity models were compared and analyzed at different free stream velocities and AOAs in order to verify the universality of the proposed approaches.
Parametric Model
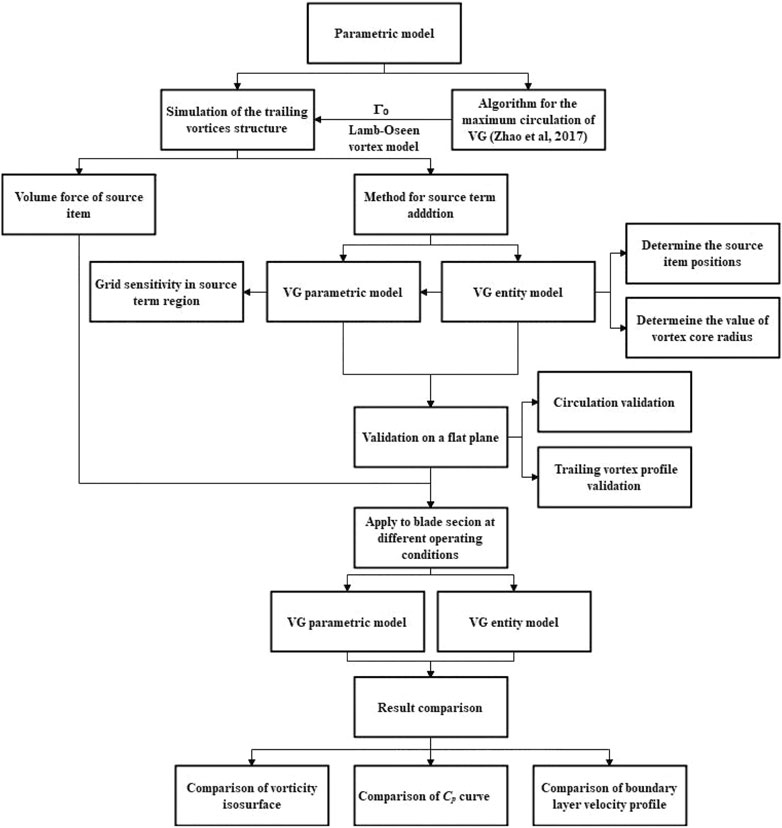
The VG parametric model can be divided into two components, namely, the maximum circulation algorithm for VG and the VG trailing vortex profile model (Figure 1). The force exerted by the VGs on the fluid is transferred into volume forces, which are added into the moment equations as a source term. The application of the VG parametric model in airfoil or blade CFD research involves the determination of the source terms positions (vortex core centers), vortex core radius, and the grid refinement in the VG zone. In this study, we employ the algorithm proposed by Zhao et al. (2017) for this purpose, while the Lamb-Oseen vortex model is adopted to model the trailing vortex structure, in which the maximum circulation of VG is a key factor. This study primarily focuses on optimizing the application of the parametric model. First, considering that flat plane with VG is geometrically simpler than a 2D airfoil with VG and a 3D blade with VG, we perform a series of experiments on a flat plane with a VG pair using the entity model. The entity model provides the information required by the parametric model on the trailing vortices. Based on the entity modelling results, the parametric model determines the position and radius of the vortex core. The approaches are then validated for different inflow angles, spacings and incoming velocities of the VGs (Zhao et al., 2021). Based the validated approaches, a blade section with VGs is modelled by the entity and parametric models, respectively. The objective of this work is to extend the application of parametric model from flat plate to airfoil. Figure 1 presents the specific study process employed here.
Vortex Model
The parametric model predicts the effect of the VGs on the boundary layer by simulating the VG trailing vortices. The Lamb-Oseen model is commonly used to model the induced velocity downstream of the VGs (Zhang et al., 2011; Zhao et al., 2017) and can be expressed as:
where Γ0 is the maximum circulation, m2/t;
Volume Force of Source Item
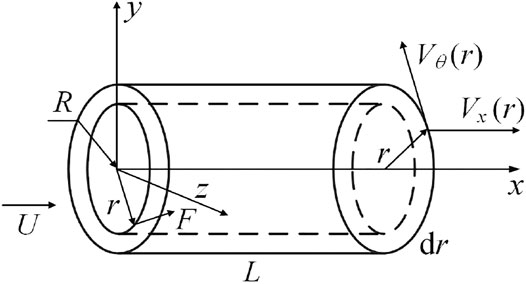
In the parametric model, the force exerted by the VGs on the fluid is added to the moment equations as a volume force. We performed numerical studies using Fluent 19.4 (ANSYS). The user-defined function (UDF) was employed to add the source terms to the Navier-Stokes equations within an annular volume, (Figure 2). The inner radius, outer radius and length of the annular volume are denoted as r, r + dr, and L, respectively, while the initial streamwise and tangential velocities at the annular volume entrance are defined as U and zero respectively. Due to the influence of the body force, the tangential velocity becomes Vθ as the airflow leaves the region, while the streamwise velocity is set as U. According to the angular momentum theorem, the torque experienced by the annular volume equals the change in angular momentum:
where
The volume fractions are taken as the source terms in the momentum equation. The radial force expressed in Eq. 2 is divided by the volume of this region to obtain the following expression:
The blade surface has a significant impact on the induced vortex of the VGs, which can be taken into account by setting the mirror vortex (Errasti et al., 2019). Thus, by considering the mirror effect, the radial force of the source term can be written as follows:
The two components of the force in Cartesian coordinates are
The VGs produce drag to the fluid, thus altering the streamwise momentum. The drag distribution of the VGs to the flow field is normally distributed (Zhang et al., 2011; Zhao et al., 2017). Considering the influence of VG resistance, the axial force of the source term can be expressed as
where D is the drag force acting on the VGs in the entity model, N.
Finally, the volume force added to the cylinder region can be expressed as
Parametric Modeling Approaches
In practical applications, the rolling up of the airflow to form a steady vortex profile behind the VGs requires a short process. However, the steady profile of the trailing vortex is instantly generated at the position where the source term is added. This process is too short to be well described by the parametric model. In this study, the simulation results were observed to be sensitive to the positions of the source term (or the vortex center) in three directions (x, y, z), namely, the streamwise direction (+x), normal direction (+y), and crossflow direction (z). With the exception of the source term positions, the vortex core radius and the grid refinement in the VG zone also affect the accuracy of the parametric model. Thus, the source term adding positions, vortex core radius and mesh strategies must be determined.
Here, we initially attempted to determine these variables on a flat plane with a pair of VGs, modeled by the parametric and entity models. The entity model results revealed variations in the vortex core center and radius under different aerodynamic conditions. These varying trends with different aerodynamic conditions were then fitted to curves in order to derive the corresponding changes in the parametric model. We then compared the results between the entity and parametric models in order to validate them. These techniques were subsequently applied to model a blade section with VGs to test their feasibility.
Determination of Source Term Positions
The geometric parameters of a VG pair include the height (h), chord length (cVG), and spacing (Z) between two adjacent VGs. The entity model results reveal the vorticity contours at the three streamwise positions (i.e., 1h, 1c, and 2c) (Figure 3). The apex of the triangular VG is defined as x = 0 in the streamwise position. Figure 3A reveals that when x = 1h the trailing vortex has not yet been fully developed as it has not been shed from the VG. At this position, the vortex is significantly affected by the wall of the VG, exhibiting an irregular profile that is difficult to estimate via a parametric model. As shown in Figure 3B, at the position of 1c the vortex has just separated from the VG and is still strongly affected by the VG wall. At position 2c (Figure 3C), the vortex exhibits an ideal shape and thus 2c is taken as the streamwise position for the addition of the source term.

FIGURE 3. Vorticity contours at different positions downstream of VGs. (A) VGs downstream 1h.(B) VGs downstream 1c.(C) VGs downstream 2h.
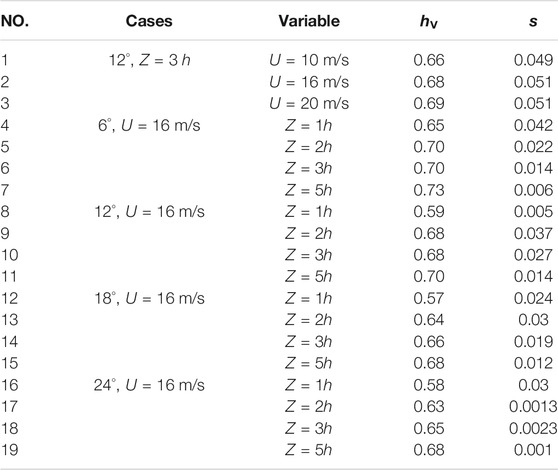
Filgueira et al. (2017) numerically analyzed the VG performance using an entity model and determined the vortex core center to be at 1/4h from the bottom wall surface. However, we will not take this as the vortex core height in our parametric model due to the lack of information on the Re number, working conditions, and experimental validation. Therefore, we discuss the position of the vortex core center. Here, two non-dimensional factors, hV (y/h) denoting the normal position (+y axis) and s (z/h) denoting the cross flow position (+z axis), are defined to describe the positions of the vortex core center in the plane normal to the +x axis.
Table 1 presents the effect of the free stream velocity, VG spacing and inflow angle on the vortex core center positions. Case1-case3 demonstrates that the center positions are not affected by the incoming free stream velocity. Case4-case19 depicts the effect of the VG spacing and inflow angle on the vortex center positions. An increase in the inflow angle is observed to slightly decrease the normal position of the vortex center. With the exception of the Z = 1h spacing, the value of hV ranges between 0.6–0.7 as the spacing increases. At the same inflow angle, an increase in the VG spacing slightly enhances hV. Based on these results, we set the normal position (+y) of the vortex core center as 0.7h. In the z-direction, as the inflow angle and VG spacing increase, the non-dimensional factor s remains approximately constant, and s = 0. This indicates that the crossflow positions (+z) of the centers are equal to those of the VG trailing edge. These source term positions do not change with the incoming velocities, inflow angles and VG spacing in the subsequent parametric analysis.
Determination of the Vortex Core Radius
Equation 1 reveals the key role of r0 in obtaining the induced velocity of the Lamb-Oseen model. In this study, we focus on deriving an effective approach for the determination of r0. The Lamb-Oseen model indicates that the vortex core radius substantially affects the velocity profile behind the VGs. The free stream velocity, inflow angle, and VGs spacing can also influence the radius of the vortex core. In the following, we discuss the variation trends of the vortex core radius with these factors.
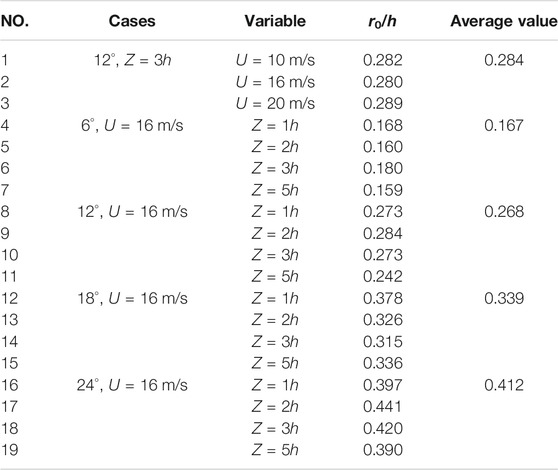
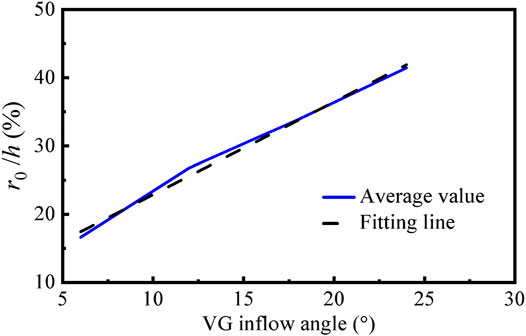
Gutierrez-Amo et al. (2018) defined the vortex core radius as the radial distance from the vortex center to the point of the maximum tangential velocity. We adopt this definition in this study. Table 2 presents the effect of the free stream velocity, VG spacing and inflow angle on vortex core radius. Case1-case3 indicates that the ratio of the vortex core radius to the height remains at 0.29, revealing the insensitivity of the vortex core radius to the incoming velocity. Moreover, the radius is observed to vary considerably with the inflow angle, whereas for a constant inflow angle the radius differences among the four spacings are small (case4-case19) and thus the vortex core radius is sensitive to the inflow angle. The average values at the different spacings corresponding to different VG inflow angles are linearly fitted according to the following equation:
The average curve and fitted curve exhibit highly consistent at different VG inflow angle (Figure 4). The maximum deviation between the average and fitted values is 2.69%. Therefore, Eq. 8 is used to describe the changes of the vortex core radius with the VG inflow angle and spacing in the parametric model.
Grid Sensitivity in the Volume Region for the Source Term
The source volume forces are subsequently added to a cylinder region. The model results are sensitive to the grid refinement in this region. Therefore, it is necessary to validate the grid refinement in the VG region in terms of the tangential induced velocity distribution. The grid sensitive is judged based on the differences between the parametric and entity models and the Lamb-Oseen model. The node numbers in the cylinder region along the three coordinate directions (e.g., the streamwise direction (+x), normal direction (+y), and crossflow direction (+z)) are then tested. The flow direction corresponds to length L, while the normal and cross flow directions correspond to radius r0. Figure 5 presents the tangential velocities along the straight line cutting through the trailing vertex center and compares the tangential induced velocity Vy calculated by varying the number of grid nodes in the source item region. The induced velocity decreases as the node number in the L–length increases (Figure 5A). When four nodes are used, the maximum induced velocities of the parametric model are close to those of the entity model and theoretical results. Therefore, we adopt four nodes in the L–length in the subsequent numerical analysis.

FIGURE 5. Effect of node number in source term region on the induced tangential velocity. (A) Effect of node number in L on the induced tangential velocity. (B) Effect of node number in r0 on the induced tangential velocity.
The grid refinement in the r0 direction also affects the accuracy of the maximum circulation computational results. The effect of the node number was tested in terms of variations in tangential velocity Vy. Direction r0 in the cylindrical coordinates can be transformed into y and z sub-directions. We tested the effect of the node number in the +z sub-direction and determined maximum induced velocities of 2.2 m/s, 3 m/s, 3 m/s, and 3.1 m/s for node numbers 1, 2, 4, and 8 respectively (Figure 5B). The induced velocity is observed to change slightly for node numbers in excess of 4, while the grid number is greatly enhanced. Thus, after comprehensively considering the accuracy and computational resources, we select four nodes in the z direction of r0. The effect of the mesh density in the y-direction follow that in the z-direction and hence we employed four nodes in this direction. Moreover, the y-direction is the thickness direction of the boundary layer. When the first layer satisfies y+<1 and the growth is set as 1.1, the node number in the vortex core and y-direction exceeds 4. Consequently, the node numbers in the x, z directions are set as four, and the mesh strategy of y+<1 is adopted in the y direction.
Research Object and Simulation Set-Up
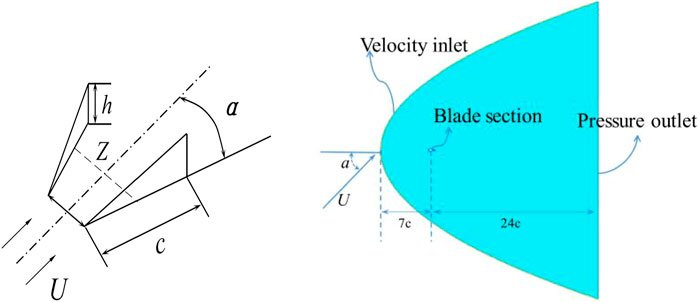
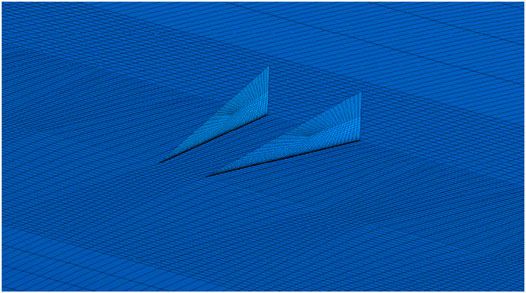
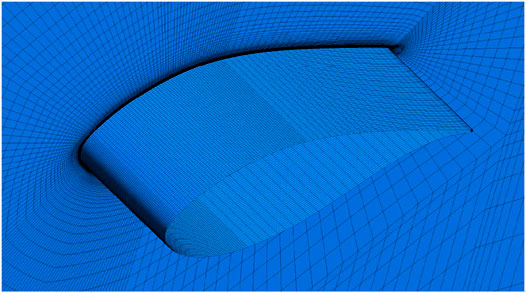
A DU91-W2-250 airfoil with chord and span lengths of 0.6 and 0.175 m, respectively, is taken as the research object (Timmer and Van, 2003). A pair of counter-rotating delta type VGs are installed at 20% of the blade section chord. VG chord c, height h and inflow angle a are 17, 5, and 16.4°mm, respectively, and VG spacing Z is 10 mm, where Z is defined as the distance between the midpoints of the two VGs chord lines (Figure 6). Moreover, the computational domain adopts an arc-shaped inlet boundary located at 7c upstream of the blade section. The corresponding outlet is located at 24c downstream to ensure that the trailing vortex can be fully developed in the downstream flow field. The grid is completed by ICEM and grid details of the two models are summarized in Table 3. There are 40, 40, 10 nodes in h, c, Z respectively in entity model. 96 and 70 nodes are set in entity model and parametric model respectively in spanwise direction. 270 and 220 nodes are set in entity model and parametric model respectively along airfoil section. The blade section boundary layer mesh and the VG area are refined to satisfy y+<1. The mesh height of the first layer near wall is set 1.5 × 10⁻⁵ m in both entity and parametric model, and the growth rate is 1.1. Figure 7 depicts the grid around the VG region, whose thickness is ignored and replaced by surface grids. Figure 8 presents the refined grids in the boundary layer of the blade in the parametric model. Following the grid independence verification, the entity model contains 3.12 million grids in the computational domain. As the parametric model does not involve physical VG, the number of grids is greatly reduced to 1.62 million.
The numerical analysis is performed using the k-ω SST turbulence and γ-Reθt transition models (Langtry et al., 2006; Sørensen, 2009). Based on various transition mechanisms, the transition model is able to capture the transition phenomenon, effectively predict natural transition and the transition separation, and is more accurate than the SST model (Zhao et al., 2015; Zhao et al., 2016). The domain inlet is defined as the velocity boundary while the outlet is set as the pressure outlet boundary. The two side faces in the streamwise direction are defined as a symmetric boundary in order to avoid influences from the wall. Non-slip wall conditions are adopted for the blade section surfaces and the VGs in the entity model. Second-order discretization schemes are employed in the CFD simulations.
Results and Analysis
Model Validation
Trailing Vortex Profile and Circulation Validation
We model a pair of VGs on a flat plane via the parametric and entity models. Figure 9 illustrates the vorticity contour predicted by the two models at an VG inflow angle of 12°, Z spacing of 3h and free stream velocity of 16 m/s. The vorticity contours behind the two VGs form two vortex tubes that expand with the downstream flow. The vortex tube shapes determined by the two models are in good agreement. The spacing between vortex tubes denotes the difference between the two models, with the values of the parametric model exceeding those of the entity model. This is attributed to the free expansion of the trailing vortices as the fluid mixing phenomenon inside and outside the boundary layer is not obvious in the flat plate. However, the mixing effect may be enhanced by the influence of the airfoil boundary, thus reducing the difference in the plate plane under the airfoil condition affected by the detached vortex.
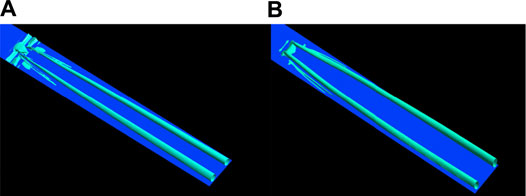
FIGURE 9. Vorticity isosurface of two modeling methods with AOA = 12°, Z = 3h,U = 16 m/s. (A) Entity model. (B) Parametric model.
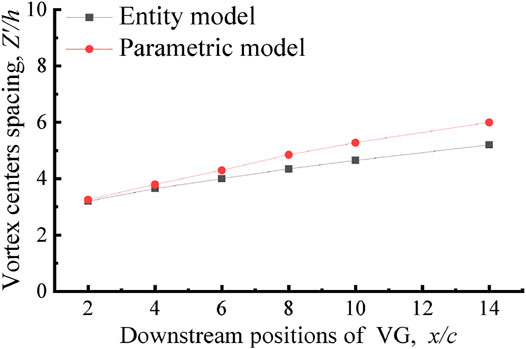
In order to further verify the feasibility of the parametric model, we quantitively compared the two models. Figure 10 presents the trailing vortex center spacing between the two vortex tubes at 2c to 14c downstream section of the VG. Here, Z′ is defined as the spacing between the two vortex centers in a downstream section. The Z’/h in the two models are consistent within the range of 2c-6c. However, discrepancies are evident after x/c > 6, yet they tend to stabilize with increasing position x/c. The accurate determination of the VG circulation is crucial for the trailing vortex results. Table 4 compares the circulation derived by the two models, indicating the strong agreement in the modelled circulations under different VG inflow angles. These comparisons prove the high feasibility of the proposed techniques.
Lift Coefficient Validation
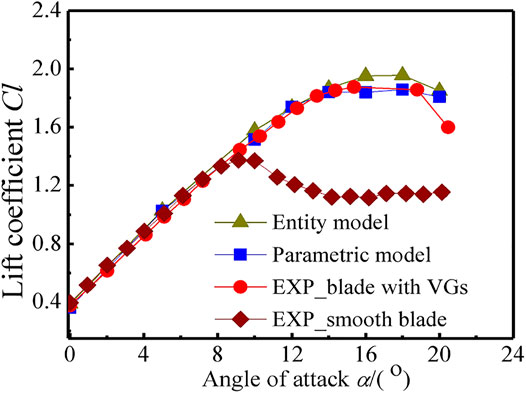
In order to validate the parametric model, we verified the computational results of the airfoil with VGs (Timmer and Van, 2003) using Timer’s experimental data at
Influence of Free Stream Velocity
In order to verify the universality of the parametric model at different free stream velocities, the DU91-W2-250 blade section was modeled by the two models at the three free stream velocities of 8 m/s, 16 m/s and 22 m/s and with a VG spacing, inflow angle and AoA of 3h, 16.4° and 0°, respectively.
Figure 12 presents the vorticity isosurface predicted by the models, demonstrating the consistency between the velocity distributions on the blade surface calculated by the two models. Moreover, the trailing vortex shapes are similar across different free stream velocities. Unlike the entity simulation method, the parametric model does not include the physical VGs, therefore it is unable to capture the velocity disturbance in the vicinity of VGs. In addition, due to the mesh refinement in the VGs zone, the entity modeling results exhibit more eddy details in the boundary layer attached to the blade surface compared to the parametric model. By comparing Figures 9, 12, we can observe the good agreement of the two models under a flat plane and an even better agreement in airfoil conditions.
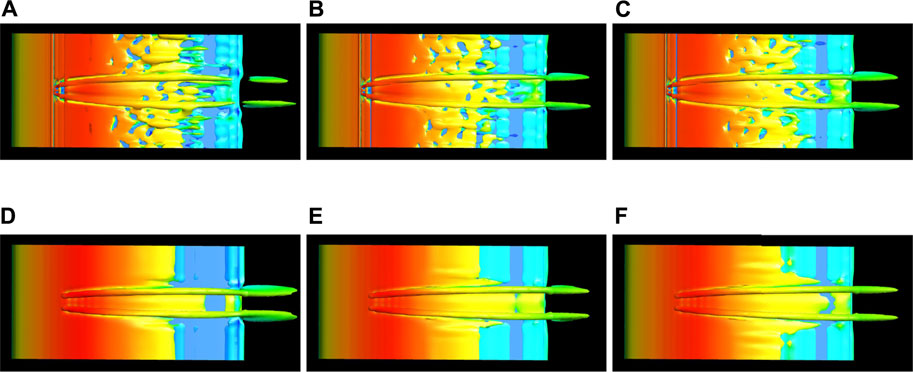
FIGURE 12. Vorticity isosurface colored in velocity of entity model (upper panel) and parametric model (lower panel) at different free stream velocities. (A)U = 8 m/s. (B)U = 16 m/s. (C)U = 22 m/s. (D)U = 8 m/s. (E)U = 16 m/s. (F)U = 22 m/s.
In order to further verify the feasibility of the VG parametric method, Figure 13 depicts the pressure coefficient CP along the cross-section at the center of the two VGs. Minimal differences are observed in the CP curves obtained by the two methods across all free stream velocities. In the entity model, the pressure coefficient fluctuates around the VG position on the suction surface due to the presence of the VGs. The parametric model generally simulates the effect of VG trailing vortices, while the pressure disturbance caused by the VGs is not considered. However, the pressure pulsation only occurs at the local position near the VGs and has a limited influence on the downstream trailing vortex to inhibit airflow separation. The pressure distributions on the blade surface obtained by the parametric and entity models are generally in good agreement across different free stream velocities.

FIGURE 13. Pressure coefficient along the airfoil surface at the middle of two VGs under different velocities. (A)U = 8 m/s. (B)U = 16 m/s. (C)U = 22 m/s.
Influence of AOA
In order to further verify the universality of the proposed approaches we compared the results at different AoAs under a free stream velocity of 16 m/s, a VG inflow angle of 16.4°, VG spacing of 3h, and airfoil AOAs of 0°, 8°, and 22° respectively.
Figure 14 presents the vorticity isosurface colored in terms of the velocity on the blade suction surface. The two methods exhibit highly consistent results at different AOAs in terms of the velocity and trailing vortex shape. In particular, both the trailing and separated airflow vortex profiles of the two models are in strong agreement at the AOA of 22° (Figures 14C,F). Moreover, due to local mesh refinement in the VG region, the entity model captured many small shedding vortices downstream of the VGs.
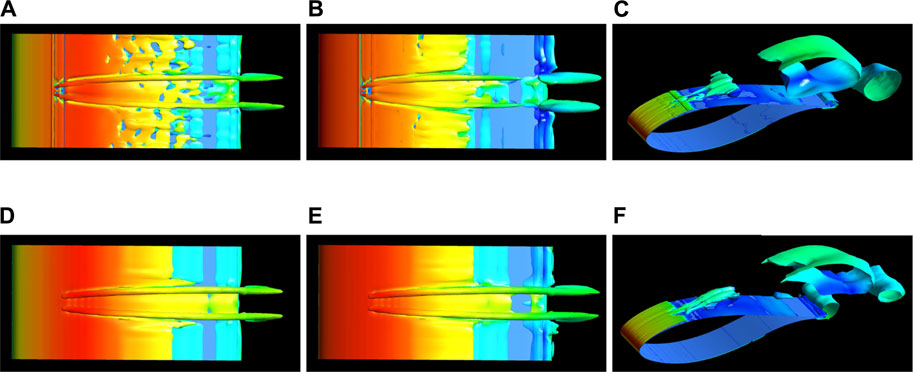
FIGURE 14. Vorticity isosurface colored in velocity of entity model (upper panel) and parametric model (lower panel) at different AOAs. (A) AOA of 0°. (B) AOA of 8°. (C) AOA of 22°. (D) AOA of 0°. (E) AOA of 8°. (F) AOA of 22°.
Figure 15 compares pressure coefficient CP along the airfoil surface at the center of two VGs determined by the two methods at different AOAs. At an AOA of 0°, the CP curves of the two methods are highly consistent, yet the differences amongst the model results increase with AOA until a value of 8° is reached, with a deviation at the leading edge of the blade suction. The differences gradually decreased for positions proceeding VGs (i.e. x/c > 0.2), indicating that the trailing vortices simulated by the parametric model play the same role as the entity VGs. At a larger AOA of 22°, the models exhibit a strong agreement, with the exception of the positions close to the trailing edge. This deviation is attributed to the inability of the entity VGs in inhibiting the boundary layer separation at high AOAs, and thus the blade section is in a stall state. This enhances the separation flow characteristics and reduces the CFD accuracy.

FIGURE 15. Pressure coefficient along the airfoil surface at the middle of two VGs. (A) AOA of 0°. (B) AOA of 8°. (C) AOA of 22°.
Boundary Layer Velocity Profile
We then compare the boundary layer velocity profiles predicted by the two models. Figure 16 depicts the velocity profiles at different downstream positions of the VG (2c and 9c) and AOAs (0°, 8°, and 22°) of the airfoil. For x = 2c, the vortex has just been generated and is not fully developed in the parametric model. The boundary layer velocity profiles slightly differ with the entity model results (Figures 16A,C,E). At x = 9c, the vortex structure is stable and fully mixes the airflows inside and outside the boundary layer. For the AOAs of 0° and 8°, the velocity profiles determined by the two methods are in good agreement (Figures 16B,D). This indicates that similar to the entity model, the trailing vortices generated in the parametric model increases the fluid energy in the boundary layer. The deviation at 9c downstream slightly increases at the AOA of 22° (Figure 16F). This is associated with the stall state of the blade section and the corresponding reduced accuracy of the CFD for high AOAs (Mahu et al., 2011). However, the VG parametric model is used to predict the aerodynamic characteristics of the blade in a non-stall state, and the accuracy loss of the model when the blade is in stall is acceptable.
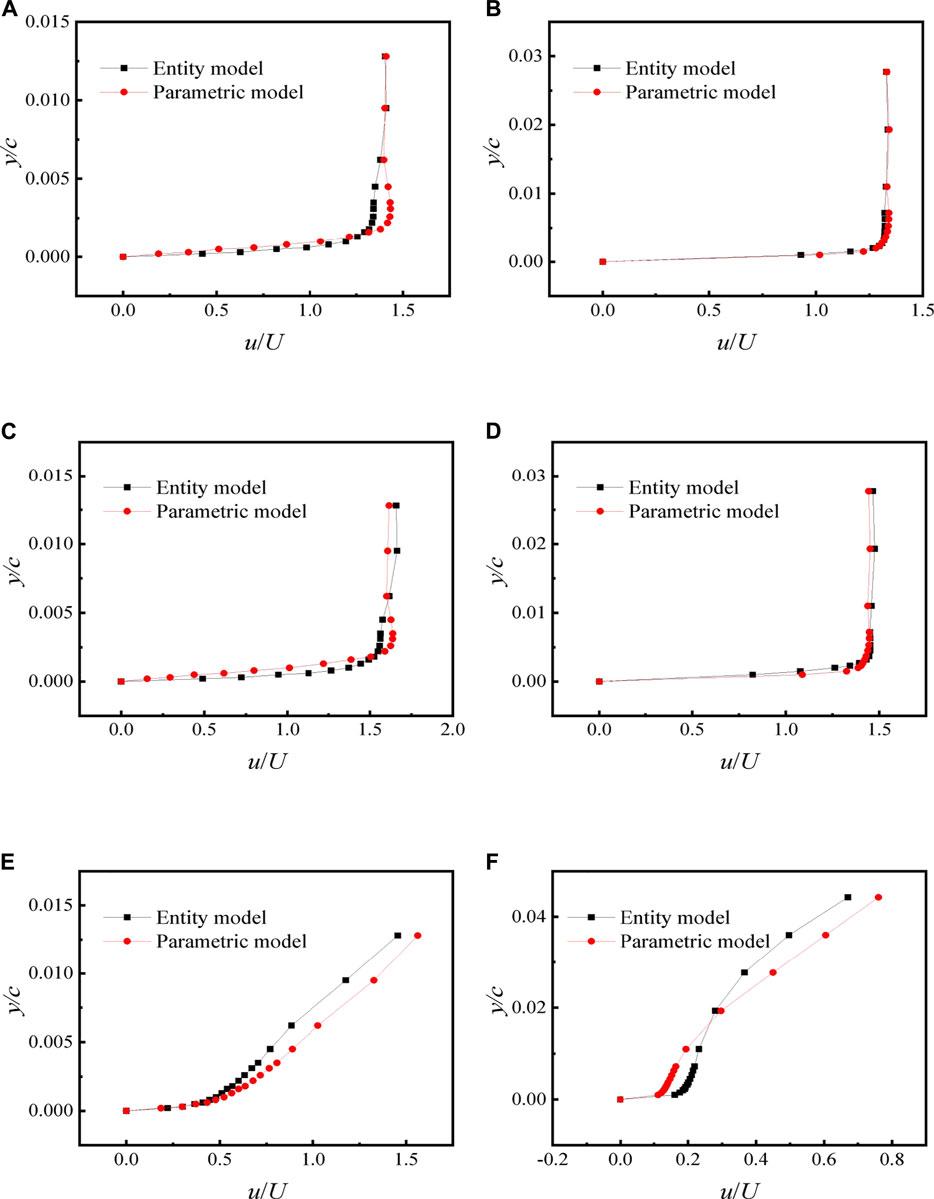
FIGURE 16. Boundary layer velocity profiles of two methods. (A) AOA of 0°, x = 2c. (B) AOA of 0°, x = 9c. (C) AOA of 8°, x = 2c.(D) AOA of 8°, x = 9c. (E) AOA of 22°, x = 2c. (F) AOA of 22°, x = 9c.
Conclusion
In order to improve the prediction accuracy of parametric model, this study presented several approaches for the application of VG parametric models on the blade section. The approaches include the determination of vortex core positions, the vortex core center and the grid refinement in the source term region. A pair of VGs on a blade section was numerically simulated using the entity and parametric models under varying AoAs and incoming velocities. The feasibility of the proposed approaches were validated by determining the agreement of the vorticity iso-surface and the pressure coefficients between the two models. We identified the following key conclusions based on the results.
1) Analysis of the position and node number of the source term suggested that the source term should be added at 2c in the streamwise direction (+x), 0.7h in the normal direction (+y), and at the same position as the VG trailing edge in the crossflow direction (+z). A four grid node was identified as optimal within the length of the source item addition region and the radius of the vortex core.
2) A strong agreement was observed between the trailing vortex profiles and pressure coefficient curves calculated by the entity and parametric models, particularly for varying AOAs and free stream velocity.
3) The local mesh refinement for VGs in the entity modeling method allows for the capturing of smaller shedding vortices that have minimal influence on the flow control. Although the parametric modeling method lacks this ability, it can effectively capture the inhibited flow separation phenomenon via the VGs and the simulation accuracy of the shedding vortex remains unaffected.
4) The consistency of the boundary layer profiles between the two models at different AOAs indicates that the trailing vortices modeled by the parametric model play the same role as the VGs of the entity model, which increases the fluid energy in the boundary layer and the delay flow separation.
5) The results of the two models are in good agreement with the experimental results, further proving the feasibility of the proposed parametric method and the reliability of the simulation results.
The proposed VG parametric model expresses different VG parameters by changing program instead of mesh, which can improve the research efficiency of VG arrangement on wind turbine blades and optimize VG parameters, so as to improve the aerodynamic efficiency and power production of wind turbine blades.
Data Availability Statement
The original contributions presented in the study are included in the article/Supplementary Material, further inquiries can be directed to the corresponding author.
Author Contributions
All authors contributed to manuscript revision, read and approved the submitted version.
Funding
This work was supported by the projects of the National Natural Science Foundation of China, No. 51876054 and No.11502070; supported by the Fundamental Research Funds for the Central Universities, No. 2019B15214, and the first group of 2011 plan of China’s Jiangsu province (Grant No. (2013) 56). Last but not least, our sincere appreciation also goes to group members.
Conflict of Interest
The authors declare that the research was conducted in the absence of any commercial or financial relationships that could be construed as a potential conflict of interest.
Publisher’s Note
All claims expressed in this article are solely those of the authors and do not necessarily represent those of their affiliated organizations, or those of the publisher, the editors and the reviewers. Any product that may be evaluated in this article, or claim that may be made by its manufacturer, is not guaranteed or endorsed by the publisher.
References
Astolfi, D., Castellani, F., Fravolini, M. L., Cascianelli, S., and Terzi, L. (2019). Precision Computation of Wind Turbine Power Upgrades: An Aerodynamic and Control Optimization Test Case. J. Energ. Resour. Technol. 141 (5), 051205. doi:10.1115/1.4042450
Bender, E. E., Anderson, B. H., and Yagle, P. J. (1999). “Vortex Generator Modeling for Navier-Stokes Codes,” in 3rd Joint ASME/JSME Fluids Engineering Conference, San Francisco, CA, July 18–23, 1999. San Francisco, CA.
Booker, C., and Zhang, X. (2009). “Large-Scale Source Term Modeling of Vortex Generation,” in 27th AIAA Applied Aerodynamics Conference, San Antonio, TX, June 22–25, 2009. doi:10.2514/6.2009-3951
Dudek, J. C. (2006). Empirical Model for Vane-type Vortex Generators in a Navier-Stokes Code. Aiaa J. 44 (8), 1779–1789. doi:10.2514/1.20141
Errasti, I., Fernández-Gamiz, U., Martínez-Filgueira, P., and Blanco, J. (2019). Source Term Modelling of Vane-type Vortex Generators under Adverse Pressure Gradient in Openfoam. Energies 12 (4), 605. doi:10.3390/en12040605
Fernandez, U., Réthoré, P. E., Sørensen, N. N., Velte, C. M., and Zahle, F. (2012). “Comparison of Four Different Models of Vortex Generators,” in EWEA 2012 - European Wind Energy Conference &, Copenhagen, Denmark, April 16–19, 2012 (Denmark: Exhibition - Copenhagen).
Godard, G., and Stanislas, M. (2006). Control of a Decelerating Boundary Layer. Part 1: Optimization of Passive Vortex Generators. Aerospace Sci. Technol. 10, 181–191. doi:10.1016/j.ast.2005.11.007
Gutierrez-Amo, R., Fernandez-Gamiz, U., Errasti, I., and Zulueta, E. (2018). Computational Modelling of Three Different Sub-boundary Layer Vortex Generators on a Flat Plate. Energies 11, 3107. doi:10.3390/en11113107
Jirásek, A. (2004). “A Vortex Generator Model and its Application to Flow Control,” in Proceedings of the 22nd Applied Aerodynamics Conference and Exhibit, Providence, RI, August 16–19, 2004. doi:10.2514/6.2004-4965
Langtry, R. B., Gola, J., and Menter, F. R. (2006). Predicting 2D Airfoil and 3D Wind Turbine Rotor Performance Using a Transition Model for General CFD Codes. 44th AIAA Aerospace Sciences Meeting and Exhibit, Aerospace Sciences Meetings, Reno, NV, January 9–12, 2006 (Reno, Nevada: AIAA), Vol. 7, 4643–4653.
Mahu, R., Popescu, F., Frunzulic̀, F., Dumitrache, A., Simos, T. E., Psihoyios, G., et al. (2011). 3D CFD Modeling and Simulation of Nrel Phase VI Rotor. American Institute of Physics, 1520–1523. doi:10.1063/1.3637914
Martínez-Filgueira, P., Fernandez-Gamiz, U., Zulueta, E., Errasti, I., and Fernandez-Gauna, B. (2017). Parametric Study of Low-Profile Vortex Generators. Int. J. Hydrogen Energ. 42 (28), 17700–17712. doi:10.1016/j.ijhydene.2017.03.102
May, N. E. (2001). “A New Vortex Generator Model for Use in Complex Configuration CFD Solvers,” in 19th AIAA Applied Aerodynamics Conference, Anaheim, CA, June 11–14, 2001. doi:10.2514/6.2001-2434
Sørensen, N. N. (2009). CFD Modelling of Laminar-Turbulent Transition for Airfoils and Rotors Using the γ − Model. Wind Energy 12 (8), 715–733. doi:10.1002/we.325
Taylor, H. D. (1947). United Aircraft Corporation Report, No. R-4012-3. The Elimination of Diffuser Separation by Vortex Generator.
Timmer, W. A., and van Rooij, R. P. J. O. M. (2003). Summary of the Delft university Wind Turbine Dedicated Airfoils. J. Solar Energ. Eng. 125 (4), 488–496. doi:10.1115/1.1626129
Traub, L. W. (2001). Theoretical and Experimental Investigation of Biplane delta Wings. J. Aircraft 38, 536–546. doi:10.2514/2.2794
Velte, C. M., and Hansen, M. O. L. (2013). Investigation of Flow behind Vortex Generators by Stereo Particle Image Velocimetry on a Thick Airfoil Near Stall. Wind Energy 16 (5), 775–785. doi:10.1002/we.1541
Velte, C. M., Hansen, M. O. L., and Okulov, V. L. (2016). Multiple Vortex Structures in the Wake of a Rectangular Winglet in Ground Effect. Exp. Therm. Fluid Sci. 72, 31–39. doi:10.1016/j.expthermflusci.2015.10.026
Velte, C. M., Okulov, V. L., and Hansen, M. O. L. (2011). Alteration of Helical Vortex Core without Change in Flow Topology. Phys. Fluids 23 (5), 051707–51707. doi:10.1063/1.3592800
Wendt, B. J., and Bruce, J. (2004). Parametric Study of Vortices Shed from Airfoil Vortex Generators. Aiaa J. 42 (11), 2185–2195. doi:10.2514/1.3672
Zhang, L., Yang, K., Xu, J., and Zhang, M. (2011). Modeling of delta-wing Type Vortex Generators. Sci. China Technol. Sci. 54 (2), 277–285. doi:10.1007/s11431-010-4284-x
Zhao, Z., Chen, M., Liu, H., Wang, T., and Xu, B. (2021). Research on Parametric Modeling Methods for Vortex Generators on Flat Plate. J. Renew. Sustain. Energ. 13, 033301. doi:10.1063/5.0030143
Zhao, Z., Li, T., Wang, T., Liu, X., and Zheng, Y. (2015). Numerical Investigation on Wind Turbine Vortex Generators Employing Transition Models. J. Renew. Sustain. Energ. 7 (6), 063124. doi:10.1063/1.4938122
Zhao, Z., Shen, W., Wang, R., Wang, T., Xu, B., Zheng, Y., et al. (2017). Modeling of Wind Turbine Vortex Generators in Considering the Inter-effects between Arrays. J. Renew. Sustain. Energ. 9 (5), 053301. doi:10.1063/1.4997039
Keywords: vortex generator, parametric modeling method, numerical simulation, wind turbine, DU91-W2-250
Citation: Chen M, Zhao Z, Liu H, Wang T, Meng L, Feng J, Jiang R and Wang D (2021) Research on the Parametric Modelling Approach of Vortex Generator on Wind Turbine Airfoil. Front. Energy Res. 9:726721. doi: 10.3389/fenrg.2021.726721
Received: 17 June 2021; Accepted: 09 August 2021;
Published: 19 August 2021.
Edited by:
Wei Jun Zhu, Yangzhou University, ChinaReviewed by:
Davide Astolfi, University of Perugia, ItalyScappaticci Lorenzo, Università degli Studi Guglielmo Marconi, Italy
Copyright © 2021 Chen, Zhao, Liu, Wang, Meng, Feng, Jiang and Wang. This is an open-access article distributed under the terms of the Creative Commons Attribution License (CC BY). The use, distribution or reproduction in other forums is permitted, provided the original author(s) and the copyright owner(s) are credited and that the original publication in this journal is cited, in accordance with accepted academic practice. No use, distribution or reproduction is permitted which does not comply with these terms.
*Correspondence: Zhenzhou Zhao, am9lcGh5QDE2My5jb20=
 Ming Chen
 Zhenzhou Zhao1,2*
 Junxin Feng
 Ruifang Jiang