 Donglou Fan
 Xun Dou
 Yang Xu2
- 1College of Electrical Engineering and Control Science, Nanjing TECH University, Nanjing, China
- 2Economic Research Institute, State Grid Jiangsu Electric Power Co., Ltd., Nanjing, China
Integrated energy system (IES) planning is a long-term and rolling decision-making process. According to System Development Theory, the development-needs at different stages are different. Therefore, an IES dynamic multi-stage planning method considering different development stages is proposed. The first step of the method is putting forward a model based on the degree of system coupling, the reserve ratio, and the penetration rate of clean energy to divide dynamic development stages. Secondly, establishing a dynamic multi-stage planning model of the IES by combining the needs of different development stages through dynamic goals and constraints. Finally, the results given by the optimal configuration of critical IES equipment will be analysed in different scenarios. Following these steps, the result shows that the dynamic multi-stage planning method proposed is able to reduce the total planning cost of the system by 14% and reducing the clean energy penetration rate by 3%. Therefore, the proposed dynamic multi-stage planning scheme is effective and economical.
Introduction
The issue of reducing the usage of fossil fuel is widely considered by the world. With the continuous progress of energy system development in low-carbon technology and sustainability (Liu et al., 2009), integrated energy systems (IES) can provide an organic energy supply and integrated system that coordinates energy production, transmission, distribution, conversion, storage, and consumption. IES can improve energy cleanliness through the conversion of multiple forms of energy, as well as coordinated operation and utilization (Wang et al., 2019). A suitable planning method is required to promote the efficient and stable development of IES and approach suitable resource allocation. This arrangement involves utilizing the complementary energy characteristics of IES, promoting cascaded energy usage, and reducing fossil fuel energy consumption. According to the system development theory, the development includes an initial stage, linear and nonlinear development stages, and a decline stage, and every stage has different characteristics (Zhong and Yihua, 2005). The initial stage is the initial stage of multi-stage planning. It is mainly to adjust the internal structure and external relations of the system. At this time, more investment and less income, is the preparation stage of rapid development of the system. The linear development stage corresponds to the medium stage of multi-stage planning, the development speed is fast and the structure changes less. The mature stage of the corresponding system in the nonlinear stage of development produces qualitative changes from the accumulation of linear development, and the IES adjusts the internal structure appropriately and coexists harmoniously with the equipment. Multi-stage planning must adapt to these characteristics to ensure reasonable system development. Considering the development stage, the planning goals can be determined according to changes in the system. The planning stage can be dynamically adjusted to update the current plan. This method improves the system economy and energy cascade utilization. It can also adapt to ongoing developments.
Most integrated energy system planning is based on single-phase planning (Cheng et al., 2017; Zheng et al., 2017), which can lead to energy equipment lying idle at the beginning of planning. The single-phase planning also leads to the aging of equipment and insufficient capacity at the end of planning. Therefore, to achieve the timeliness of integrated energy system planning, the planning cycle needs to be divided into several stages to determine the different stages of planning objectives and the planning process (Ge and Jia, 2012). There is less research on multi-stage planning at present, and the focus of the research is on the planning objectives and objectives of IES based on different forms of energy coupling at different planning stages. Existing research has established the electric–gas coupling (Wu, 2016; Huang et al., 2019) and electric–heat–gas multi-energy coupling planning models (Unsihuay-Vila et al., 2010; Zhang et al., 2015; Gan et al., 2017). The annual operating cost (Yang et al., 2012; Salimi et al., 2015; Pazouki and Haghifam, 2016; Jiang et al., 2017), investment operating cost (Mago and Chamra, 2009; Wang et al., 2018; Bai et al., 2019), carbon transaction cost (Zeng et al., 2019a), and energy conversion efficiency (Jiang et al., 2004; Guo et al., 2013) of a system are important for energy station planning (Chen et al., 2018) and network reconstruction (Quan et al., 2018; Wu et al., 2019). The current multi-stage approach typically involves fixed-time dynamic planning. This method does not consider the needs of the different development stages of IES. Considering the characteristics of IES and the needs of objective low-carbon sustainable development, the basic energy supply capacity of the system should be considered in the initial stage of development, the system maturity should be examined in the medium stage, and the system energy cleanliness should be accounted for in the mature stage. Therefore, in a new multi-stage planning method, the planning goals of the different development stages should be determined according to the impact of system technology, policy, load, and other developments on the system economy, safety, and energy cleanliness. Additionally, the IES energy cascade capabilities should be fully utilized so system planning is aligned with the development needs of the system.
This paper proposes an innovative method of IES dynamic multi-stage planning focusing on the development stage. This method divides the development phase of IES into different parts in order to make sure that the plan can satisfy the requirements of system’s phased development and can enhance the economics of the system. The conclusions of this paper are:
1) This paper proposes a more reasonable IES development stage division method considering the energy cascade utilization demand, basic load supply demand, energy cleanliness demand, and economic development demand in the development process of IES.
2) Based on the proposed IES development stage division method, a dynamic multi-stage planning model that focuses on the IES development stage is built. Unlike dynamic planning with one fixed time step, the approach improves the level of energy cascade utilization of the system and aligns the system development goals with the system development needs.
This paper is aimed to design a dynamic multi-stage planning considering the development stage to improve the economy of the system. Section Modeling of the IES Structure and Key Equipment builds a basic model of the key IES equipment. Section Model of IES Planning Considering Development Stages describes the division of the IES development stages and establishes a dynamic multi-stage IES planning model that focuses on the development stages. Section Results Development Stages verifies the economy of the proposed method through a comparative analysis of multiple scenarios. Finally, the paper’s conclusion is presented in section Conclusion.
Modeling of the Integrated Energy System Structure and Key Equipment
Integrated Energy System Structure
The structure of the IES considered in this paper is illustrated in Figure 1 (Zeng et al., 2019b). The IES includes wind turbines (WT), photovoltaics (PV), combined heat and power (CHP), gas turbines (GT), electricity-to-gas equipment (P2G), gas boilers (GB), and heat pumps (HPs). The load includes three types of heat, electricity, and gas. The heat load is supplied by CHP, GB, or HP, and the associated energy supply equipment operate as standbys for each other. It is assumed that CHP works by generating power in heat mode. The gas load is supplied by the P2G and gas source. The electric loads are supplied by the thermal power units, PV, WT, CHP, and GT.
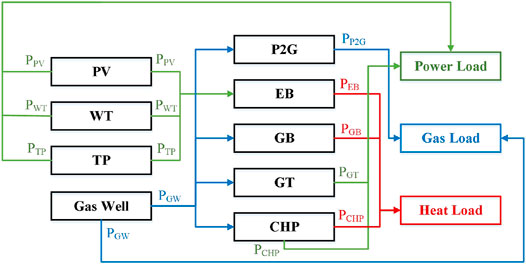
FIGURE 1. Structure of the IES.
The following section introduces the physical model of the coupled equipment in the IES based on a previous study (Jiang et al., 2004).
Modeling of Coupled Physical Equipment
Physical models of the coupled IES equipment introduced above are built as follow (Jiang et al., 2004).
Combined Heat and Power Unit Physical Model
where
Gas Boilers Physical Model
where PGB is the heating output power of the GB at time t, vGB,t is the natural gas consumption of the GB at time t, LNG is the low-level heating value of natural gas, and ηGB is the heating efficiency of the GB.
Heat Pump Physical Model
where PHP,t is the heating power of the HP at time t, PP,HP,t is the input power of the HP at time t, and ηH,HP is the heating energy efficiency of the HP.
Gas Turbines Physical Model
where PGT,t is the electrical output power of the GT at time t, vGT,t is the natural gas consumption of the GT at time t, and ηGT is the power generation efficiency of the GT.
Electricity-to-Gas Equipment Physical Model
A typical physical model of a P2G unit can be expressed as:
where ηP2G,H2 and ηP2G,CH2 are the H2 efficiency and CH4 efficiency. pP2G,H2,t and pP2G,CH4,t are the output H2 and output CH4 at time t. pP2G,t is the input gas at time t.
Modeling of Source–Load Interaction Behavior
This paper considers the electricity price in comparison with the gas price. The supply–demand relationship of the IES is constructed based on the high flexibility of the electricity price. Accordingly, considering the impact of external policies and scientific and technological signals, the source–load supply and demand of the IES is established using the following model:
where
Model of Integrated Energy System Planning Considering Development Stages
Development Stage Division of the Integrated Energy System
For an IES, the system configuration in the decline stage no longer fulfils the production and living needs, and a new planning scheme must be launched. Therefore, the system is divided into initial, medium, and mature stages based on the characteristics of the system’s initial stage, linear development stage, and nonlinear development stage (Zhong and Yihua, 2005). The development of the IES is affected by external factors such as policies, science, and technology, and has a phased nature (Chen et al., 2018). Apparently, changes in equipment input costs and the energy supply-demand will cause changes in the development stage related to the degree of system coupling, economic benefits, and clean energy penetration. Therefore, the system development process can include initial stage, medium stage, and mature stage.
In the initial stage of the IES, the system is generally weak and incomplete, and usually only fulfils the basic needs of the environment (Zhong and Yihua, 2005). Thus, only the system’s reserve requirements are considered in the initial stage. Due to the limited science and technology levels in the initial stage of the system, the construction cost of coupling equipment is high, this stage only requires a system reserve rate. This paper defines this stage as the initial stage of the IES.
In the linear development stage of the system, the development speed is fast and there are few structural changes (Zhong and Yihua, 2005). Thus, there are not too many requirements on the function of the system, only considering the initial requirements of the coupling degree. When the load increases to a certain extent, the original energy supply level can no longer meet the system load demand. Therefore, the supply capacity of the system should be enhanced by equipment expansion at specific time points. As shown in Figure 2, the energy supply level of the system rises in a stepwise manner, and the system is coupled at this time. The capacity improvements enabled by the coupling devices increase the system energy cascade utilization (Quan et al., 2018). This paper defines this stage as the medium stage of the IES.
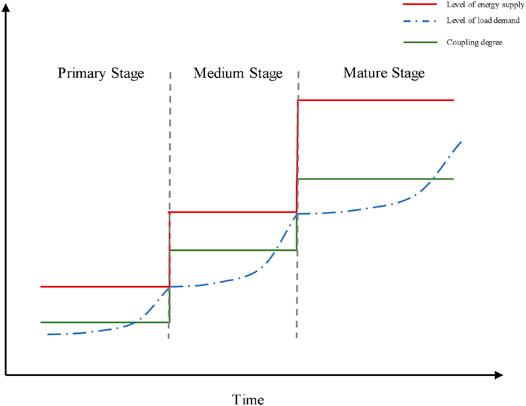
FIGURE 2. Schematic diagram of the development stages of the IES.
In the nonlinear development stage of the system, the IES adaptively adjusts its internal structure and coexists harmoniously with other developments (Zhong and Yihua, 2005). Therefore, in the nonlinear development stage, the IES needs to further emphasize its own development goals while taking into account the needs of sustainable environmental development. When the technology level of the equipment matures and the degree of coupling of the system increases, the ratio of production and the penetration of clean energy must be considered. This paper defines this stage as the mature stage of the IES.
According to the relevant economic and security requirements, energy cascade utilization requirements, and cleaning requirements of the above IES stages, several development indicators for IES are proposed. These indicators include the degree of coupling, the ratio of input to output, the reserve ratio, and the clean energy penetration rate. The development requirements of each stage are also quantified and divided into different development stages. The calculation formulas are:
where ηC is the degree of IES coupling; Qi is the installed capacity of the ith coupled device in the system; NC is the total number of coupled devices in the system; Qj is the installed capacity of the jth device in the system; CI is the total system revenue; CO is the total system cost; ηR is the IES reserve rate; QR,i is the reserve capacity of the ith device; ηRe is the renewable energy penetration rate of the IES; NRe is the amount of clean energy in the system; and QRE,i is the capacity of the ith renewable energy device.
Planning Model in Each Stage
The IES optimal allocation problem considering the development stage is studied by minimizing the total cost of the whole IES planning cycle. The planning goals are divided into basic planning goals and periodic planning goals. The basic planning goals are an inherent part of the objective function, and the periodic planning goals are a unique part of each development stage. The objective functions are adjusted according to the development requirements of each stage.
Planning Model of the Initial Stage
1) Planning goals of the initial stage.
The basic planning goals of the system include the initial investment of the IES and the minimum operation and maintenance costs. The objective function is specifically shown in Eqs. 17–20.
where
2) Constraints of the initial stage.
Equipment operating constraints.
Considering the actual interaction between the supply and demand entities, the optimization variables need to be kept within the following ranges:
where
The output of each piece of equipment is subject to a corresponding physical model. Therefore, the equipment operation constraints are covered by Eqs. 1–7.
Energy Conservation Constraints
The power balance constraints of electricity, heat, and gas are considered respectively.
1) Electric power balance constraint
where PLD,p is the electrical load in the system; PGEN is the output power of the GEN; PPV is the output power of PV; PWT is the output power of WT; PGT is the output power of GT; PCHP,p is the output electrical power of the CHP; PP,P2G is the input power of the P2G; and PP,HP is the input power of the HP.
2) Natural gas power balance constraint
where PLD,G is the natural gas load; pP2G,G is the output power of the P2G; PCHP,G is the input power of the CHP; PGT,G is the input power of the GT; and PGB,G is the input power of the GB.
3) Thermal power balance constraint
where PLD,H is the thermal load; PCHP,H is the output heating power of the CHP; PGB,H is the output heating power of GB; and PHP,H is the output heating power of HP.
Planning Model of Medium Stage
1) Planning goals of the medium stage.
In the medium stage, there is no obvious change in planning goals, and Eqs. 17–20 are used as the planning goals.
2) Constraints of the medium stage.
In the medium stage, the coupling capacity of the IES is improved, and the requirements for the cascade utilization of the system are considered. Therefore, the following constraints are added on the basis of the constraints in the initial stage:
where a1c is the requirement for determining the coupling degree of the IES in the medium stage.
Planning Model of the Mature Stage
1) Planning goals of the mature stage.
In the mature stage, the main coupling equipment in the IES should be relatively mature. Thus, the initial input costs of major equipment are low and the mature equipment can be used to improve the system’s clean energy consumption level. Therefore, based on the planning goals in the initial stage, the planning goals are updated to:
where
2) Constraints of the mature stage.
In the mature stage, there are no obvious changes in the constraints. Eqs 1–7 and 21–24 again provide the constraints in this stage.
Optimization Solution
Based on the above model, the mixed-integer linear programming method of the GAMS platform is used to obtain a solution. The algorithm flowchart is shown in Figure 3.
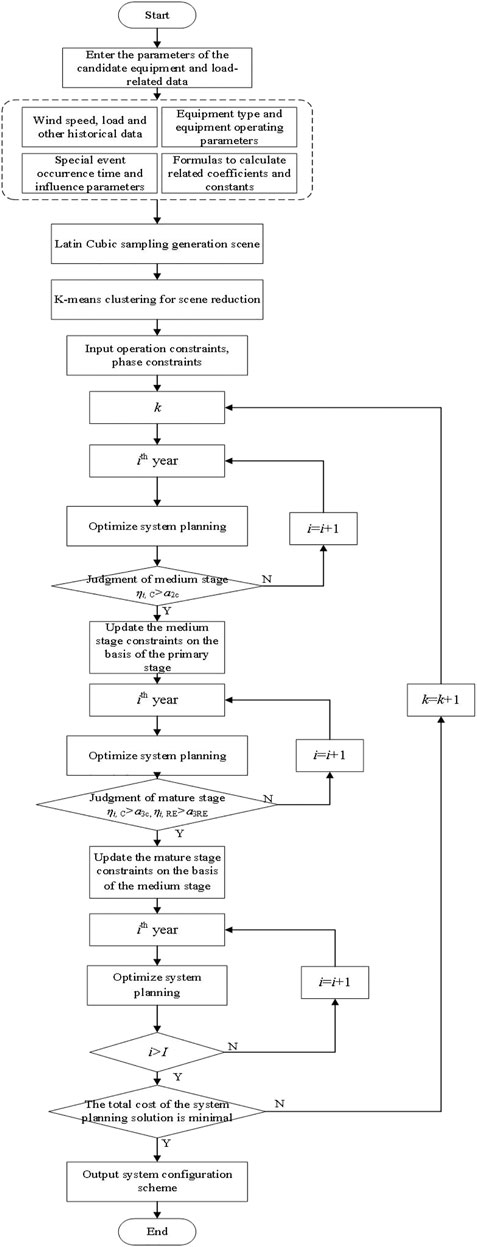
FIGURE 3. Solution flowchart.
Considering the development stage, an optimized configuration model of energy supply equipment is established to allow the IES to optimize the selection of GT, GB, CHP, and other equipments. The solution process is shown in Figure 3. The first step is to enter wind power, photovoltaic information, load data, equipment parameters, and other basic data. Random scenarios are then generated by Latin cube sampling, with K-means clustering used to reduce the total number of scenarios. The second step is to use the GAMS software to run the planning model, with the minimum annual cost of the system as the target. For this, a tree structure is used to code a one-parent genetic algorithm, and the original dual interior point method is applied to obtain the system operation strategy. The third step involves determining the index value of the development stage of the system, updating the planning goals and constraints, and determining whether it is necessary to expand the capacity. In the fourth step, a model with the minimum integrated cost in the planning cycle is developed as the optimization goal. The GAMS software is used to solve the problem and obtain the optimal configuration plan for the IES.
Results
Basic Data
MATLAB and GAMS were used to execute a series of simulations and optimization analysis. This example selects data from an industrial park for analysis. This paper is based on the data of the literature (Wang et al., 2017; Liu et al., 2018), and some modifications have been made (DIW Berlin, 2021). Wind and photovoltaic outputs from a typical day in each of the four seasons were used (Liu et al., 2018). In the example, the multi-demand factor and the supply factor interact through coupling equipment. The equipment used in the IES includes GT, HP, P2G units, GB, CHP, thermal power units, PV, and WT. The specific equipment parameters (Wang et al., 2017) are listed in Table 1. To achieve effective cascade utilization of multiple sources of electrical heat, each subsystem in the IES should have a certain degree of coupling. This paper assumes that the required degree of coupling eventually reaches 40%.
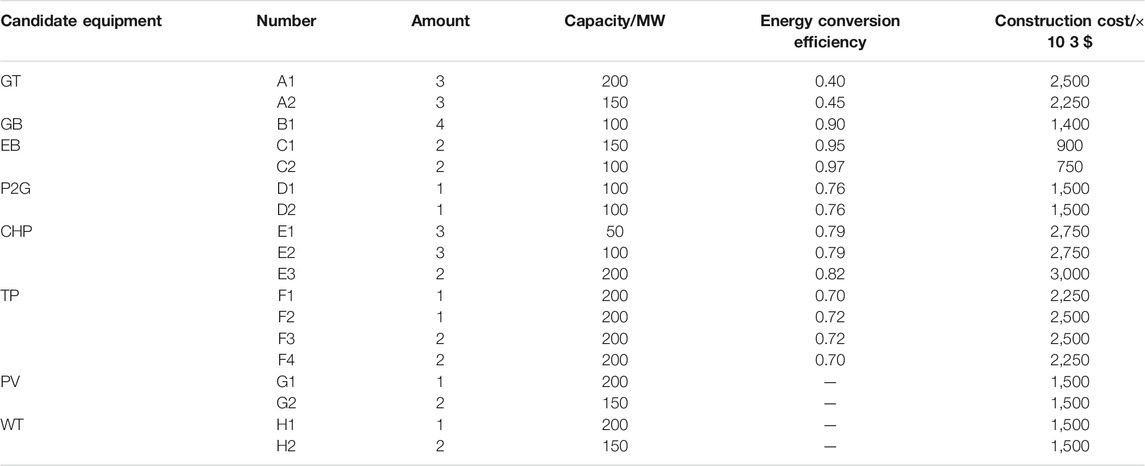
TABLE 1. Parameter list of equipment to be selected.
Load forecasting was performed based on historical load data (Hong et al., 2018), which are shown in Figure 4.
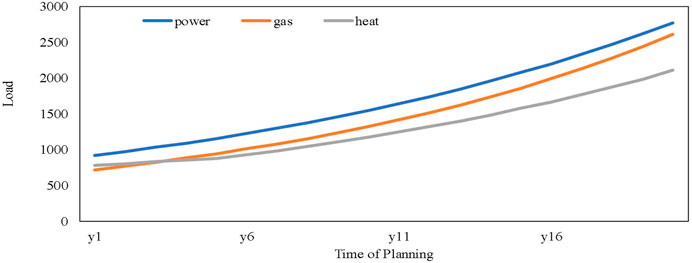
FIGURE 4. Typical annual load forecasting curve.
Based on typical load scenarios, the models established in Sections 2 and 3 were then applied under the assumption of a system planning period of 20 years. A new steel plant and a textile mill are to be built in the park in the 6th year, with an impact factor of 0.4 for the electricity and heat loads. In the 15th year, a major breakthrough occurs in the CHP and GB manufacturing process, for which the impact factor of the construction cost is 0.4. The resulting load curve is shown in Figure 5.
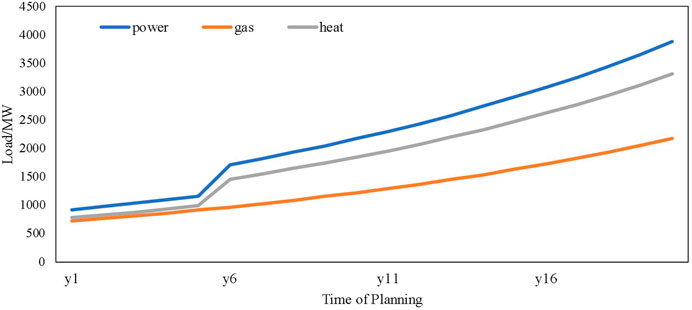
FIGURE 5. Load curve considering special events.
Analysis of Results
In this paper, three scenarios are set up for dynamic multi-stage IES planning to consider the development stage.
Case 1: Dynamic multi-stage IES planning that takes into account the development needs of different stages of development.
Case 2: Multi-stage IES planning considering a fixed stage of development.
Case 3: Dynamic multi-stage IES planning without considering the development needs of different stages of development.
Analysis of Dynamic Multi-Stage IES Planning Considering Development Stage
Case 1: This case considers the basic energy supply demand in the initial stage of IES, with a limited reserve ratio. In the medium stage, we further consider the maturity of the system and increase the degree of coupling. In the mature stage, the system energy utilization cleanliness is also considered, and a clean energy penalty cost is added to the planning goals. The results for this configuration are shown in Figure 6.
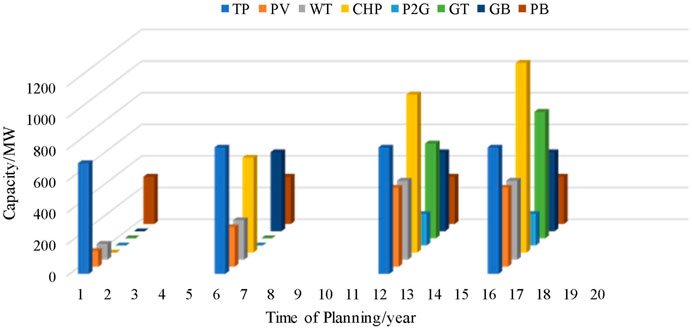
FIGURE 6. Planning and configuration results in case 1.
As shown in Figure 6, in the first 5 years, the system is in the initial stage. The system is mainly equipped with renewable energy and thermal power units, with little coupling. At this time, the electricity, gas, and heat loads steadily increase, and the electric load is greater than the gas and heat loads. The cost of renewable energy generation is low, and the degree of system coupling is low. There are no requirements for the installed capacity of the coupled equipment in the initial stage.
In the 6th year, the IES of the park is expanded and some coupled equipment is added, allowing the system to enter the medium stage. To cope with the surge in electrical and thermal loads and meet the new system development constraints, the park adds thermal power units, CHP, and GB. As shown in Figure 5, in the 6th year of the planning cycle, the park undergoes industrial expansion, with the addition of a steel plant and a textile mill. Both industries cause large increases in the electrical and thermal loads of the park.
In the 12th year, the second expansion is carried out, and the system enters the mature stage. The costs of wind and light are added to the objective function, and the clean energy consumption capacity of the system is considered without further increasing the installed capacity of clean energy.
In the 15th year, the reserve is sufficient until the third expansion in the 16th year. At this point the system is still in the mature stage, and so gas coupling equipment is added to replace the electrical coupling equipment and a CHP unit and a GT are added. The impact of scientific and technological progress reduces the initial investment cost of new equipment, resulting in an increase in the power supply and heating capacity of the system. As shown in Figure 5, the reductions in gas-to-electricity and gas-to-heat costs increase the demand for gas loads, and the growth rate of the electrical load slows.
Analysis of the Impact of Dynamic Division of Development Stages
Case 2: To study the impact of the dynamic division of development stages on the planning results, the results for case 1 were trimmed to provide a basis for the stage division in case 2. In this case, we assume that IES enters the medium stage in the 5th year and the mature stage in the 10th year. Dynamic planning considers a fixed development stage. The configuration results are shown in Figure 7.
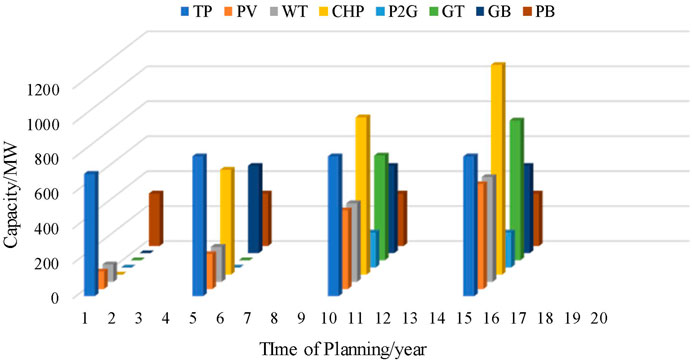
FIGURE 7. Planning and configuration results of case 2.
It can be seen that the planning results in case 1 and case 2 are similar. This is because the development requirements in each stage of case 2 are the same as for case 1. However, the first and second expansion time nodes of case 1 are the 6th and 12th years, whereas the first and second expansion time nodes of case 2 are the 5th, and 10th years. It can be seen from this analysis that the system has a fixed development stage, so the system enters the medium stage in the 5th year and the mature stage in the 10th year. To meet the needs of system development, capacity expansion is required. By comparing case1 and case 2, it can be found that, compared with fixed stage IES planning, dynamic multi-stage IES planning can delay the system expansion time by about 1–2 years, saving system expansion costs.
Analysis of the Impact of Development Stage Changes
Case 3: To compare and analyze the impact of the development stage changes on the planning results, case 3 does not consider the impact of different development needs. This case is based on case 1, assuming that the initial development requirements of IES are the same as the development requirements in the mature stage of case 1. The planning results are shown in Figure 8.
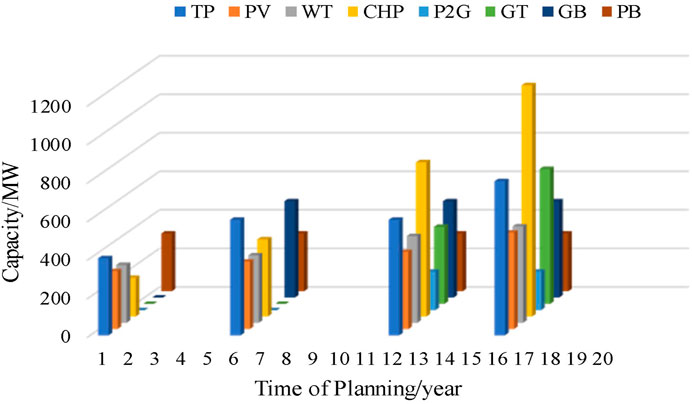
FIGURE 8. Planning and configuration results of case 3.
As shown in Figure 8, the system expansion time points are the 6th, 12th, and 16th years, as for case 1. This is because case 3 also uses dynamic planning and has the same load changes as case 1. To face these load changes, the system must be expanded at these moments. The planning result for case 3 in the 16th year is similar to that of case 1. Analysis suggests that the development needs considered in case 3 are similar to those considered in the mature stage of case 1. In case 1 and case 2, the initial stage costs are 6.22 × 10⁶ $ and 6.23 × 10⁶ $, respectively, whereas case 3 requires 6.69 × 10⁶ $ in the first stage. This is because the entire planning cycle of the system places high requirements on the clean energy penetration and energy cascade utilization performance of the system. Initially, 150 MW CHP was selected, and 300 MW PV and WT were configured. Compared to case 1, 2 and case 3, dynamic IES planning that takes into account the needs of different stages of development can save about 7.5% of system construction costs compared to unconsidered, which shows that ignoring the development needs of the system results in larger investment in the initial stage.
Effectiveness Analysis
Analysis of the System Economy
To verify the effectiveness of the proposed method, the costs, capacity expansion results, coupling degree, and clean energy penetration rate in Cases 1, 2, and 3 are compared in Figures 9, 10 and Table 2.
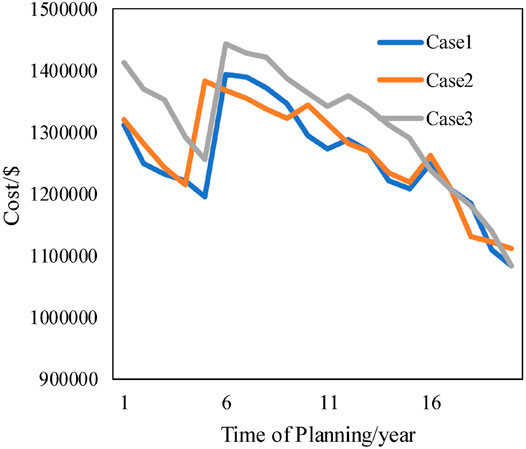
FIGURE 9. Comparison of planning costs for each scenario.
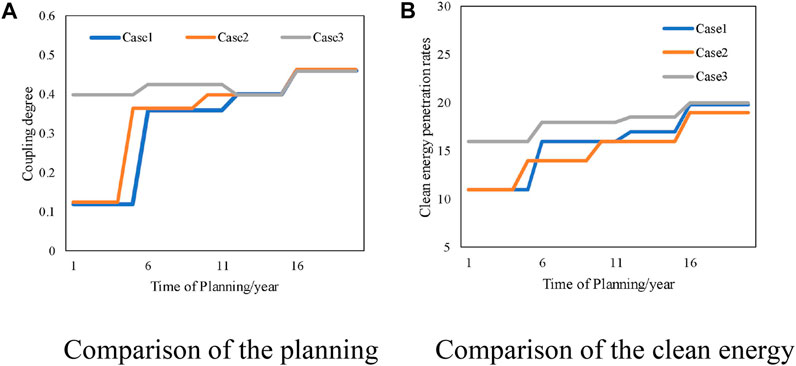
FIGURE 10. Comparison of the planning performance.
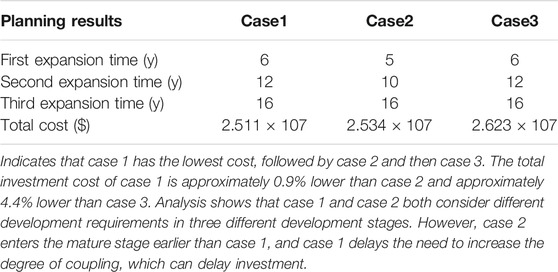
Table 2. Comparison of the expansion results for each configuration.
Figure 9 shows the annual cost changes during the planning process in the three scenarios. The overall cost is on a downward trend from case 1 to case 3. The main reason for this is that the cost of equipment changes in line with the development law of the life cycle, so the initial input cost decreases year by year. Case 2 has higher costs than case 1 in the 5th year. As shown in Figure 2, case 1 is still in the initial stage in the 5th year, whereas case 2 has entered the medium stage, whereby the system must satisfy the demand for energy cascade utilization. That is, the system has been expanded. This can delay the system investment. The overall system cost of case 3 is higher than both case 1 and case 2. Analysis shows that case 3 has only a single development stage, and its development needs are the same as the mature stage of case 1. The development requirements are high and more coupling equipment needs to be configured, making the overall cost higher.
Hence, the IES planning scheme considering dynamic stages can rationally manage and improve economic benefits according to the development requirements of each stage of the system.
Analysis of System Performance
Figure 10 shows the changes in the coupling degree during the three scenarios. Figure 10A shows that the coupling degree rises in steps, because the energy cascade utilization demand in each stage of the system changes with the development stage. The coupling degree and clean energy penetration rate of case 2 are higher than those of case 1 in both the initial and medium stages. This is because the fixed development requirements mean that the system enters the medium and mature stages earlier than case 1, and pushes forward the requirements for the coupling degree of the system. From Figure 10B, we see that the expansion of case 1 occurred in the 6th, 12th, and 16th years, whereas the expansion of case 2 occurred in the 5th, 10th, and 16th years. The expansion occurred later in case 1 than in case 2. Over time, the reduction in the cost of new energy allocation has made the system lean towards more renewable energy installations. Furthermore, the increase in the load gives the system greater capacity to absorb the renewable energy, so the overall clean energy penetration is better in case 1 than in case 2.
The coupling degree and clean energy penetration rate of case 3 is higher than that of both case 1 and case 2, but the coupling degree decreases slightly in the 12th year. This is because case 3 does not consider the changes in the development stage, and the coupling degree and clean energy penetration rate requirements are higher than the other cases before Cases 1 and 2 enter the mature stage. In years 1–11, there has been more investment in coupling equipment. However, from the 12th to the 16th years, 350 MW of coupling equipment and 600 MW of other equipment have been added. The additional coupling equipment has less capacity than the other equipment, reducing the overall coupling degree.
Hence, the IES dynamic stage planning method can satisfy the development goals of cascade utilization and effectively improve the clean energy penetration rate of the system in different stages while retaining the economic benefits of the system.
Sensitivity Analysis
The effects of different expansion impact factors and technology impact factors on the configuration results are now analyzed.
Sensitivity Analysis of Expansion Impact Factors
Figure 11 compares the configuration results for various expansion factors. The initial and development stages of the system advance with the expansion factor. In the 5th year, the system load surges at higher expansion factors. To meet the load demand, some equipment must be configured in advance, which causes the system to enter the medium and mature stages earlier.
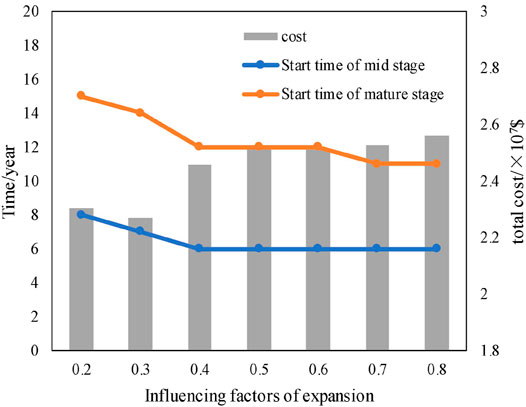
FIGURE 11. Impact diagram of expansion impact factors.
The cost of each case first decreases and then increases as the expansion factor increases. This is because the minimum reserve rate is 0.25. When the expansion impact factor is 0.3, the average annual reserve rate of the system is 0.254. Expansion impact factors of 0.2 and 0.4 produce average annual reserve rates are 0.283 and 0.294 in the system. This shows that increasing the electric and thermal loads brings them more in line with the operating characteristics of the source-side equipment, thus reducing additional equipment investment. When the expansion impact factor is 0.3, the investment cost is lower than when the expansion factor is 0.2 or 0.4. However, as the expansion impact factor further increases, the total amount of electric and thermal load also increases, and larger-capacity equipment is required to handle the supply, resulting in a gradual increase in costs.
Therefore, the IES planning model established in this paper is suitable because it takes into account dynamic planning and can cope with regional expansion.
Sensitivity Analysis of Technological Impact Factors
Figure 12 compares the configuration results under different technology impact factors. The initial stage of the system is always in the 6th year. Technological progress means that the mature stage is eventually reached after the 9th year, rather than the 12th year. As shown by the costs in Figure 14, advances in science and technology reduce the equipment investment cost. The earlier these advances occur, the earlier the larger-capacity and more efficient equipment can be configured, which results in better energy cascade utilization capability. Therefore, scientific and technological progress will accelerate the development of IES to the mature stage.
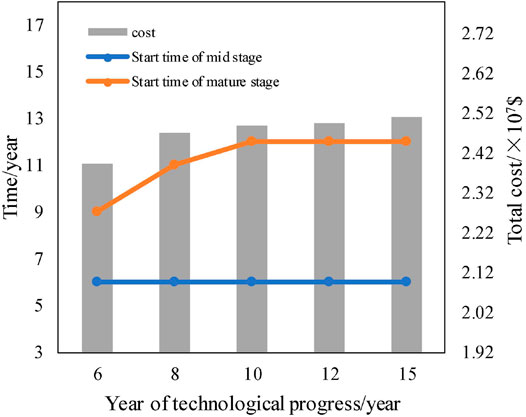
FIGURE 12. Impact diagram of technological impact factors.
Conclusion
Based on system development theory, this paper has identified the characteristics of the different development stages of an IES, and divided the development process into initial, medium, and mature stages. A dynamic multi-stage planning model, focusing specifically on the development stage, has been established. The following conclusions can be drawn from the case study:
1) In this study, compared with multi-stage planning method without considering the development stage, the proposed dynamic planning approach reduces the total system planning costs by 14% and increases the average clean energy penetration rate by 3%.
2) Considering the different requirements of the various development stages of the IES, this proposed approach can ensure that the system plan matches the technological and economic levels and that the system develops in a reasonable manner.
Data Availability Statement
The original contributions presented in the study are included in the article/Supplementary Material, further inquiries can be directed to the corresponding author.
Author Contributions
DF: Methodology, Software, Writing. XD: Methodology, Software, Validation, Reviewing and editing. YX: Data curation, Validation, Reviewing and editing. CW: Validation, Reviewing and editing. GX: Data curation, Conceptualization. YS: Conceptualization, Methodology.
Funding
This paper is supported by Science and Technology Foundation of SGCC “Research on energy trading mechanism and simulation based on multi-energy collaborative optimization” (No. 1400-202118231A-0-0-00).
Conflict of Interest
YX, CW, and GX were employed by the company State Grid Jiangsu Electric Power Co., Ltd.
The remaining authors declare that the research was conducted in the absence of any commercial or financial relationships that could be construed as a potential conflict of interest.
Publisher’s Note
All claims expressed in this article are solely those of the authors and do not necessarily represent those of their affiliated organizations, or those of the publisher, the editors and the reviewers. Any product that may be evaluated in this article, or claim that may be made by its manufacturer, is not guaranteed or endorsed by the publisher.
Acknowledgments
We thank the Economic Research Institute, State Grid Jiangsu Electric Power Co., Ltd. and Nanjing TECH University for their funding, knowledge and development contributions in the study.
References
Bai, H., Yin, S., and Li, H. (2019). Optional Planning of Multi-Energy Stations Considering Carbon-Trading Cost. J. Electron. Power Sci. Technology. 34 (1), 11–19. doi:10.19781/j.issn.1673-9140.2019.01.002
Chen, B., Liao, Q., and Liu, D. (2018). Comprehensive Evaluation Indices and Methods for Regional Integrated Energy System. Automation of Electric Power Systems. 42, (4), pp.174–182.
Cheng, L., Zhang, J., and Huang, R. (2017). Case Analysis of Multi-Scenario Planning Based on Multi-Energy Complementation for Integrated Energy System [J]. Electric Power Automation Equipment. 37 (6), 282–287. doi:10.16081/j.issn.1006-6047.2017.06.037
DIW Berlin (2021). DIETER. [Online]. Available at: https://www.diw.de/de/diw_01.c.508843.de/forschung_beratung/nachhaltigkeit/umwelt/verkehr/energie/modelle/dieter/dieter.html. (Accessed May 17, 2019).
Gan, L., Chen, Y., and Liu, Y. (2017). Coordinative Optimization of Multiple Energy Flows for Microgrid with Renewable Energy Resources and Case Study. Electric Power Automation Equipment. 37 (6), 275–281. doi:10.16081/j.issn.1006-6047.2017.06.036
Ge, S., and Jia, O. (2012). Multi-Stage Model for Optimal Distribution Substation Planning[J]. Power Syst. Technology. 36 (10), 113–118. doi:10.13335/j.1000-3673.pst.2012.10.024
Guo, L., Liu, W., and Cai, J. (2013). A Two-Stage Optimal Planning and Design Method for Combined Cooling, Heat and Power Microgrid System. Energ. Convers. Management. 74, 433–445. doi:10.1016/j.enconman.2013.06.051
Hong, B., Chen, J., and Zhang, W. (2018). Integrated Energy System Planning at Modular Regional-User Level Base on a Two-Layer Bus Structure[J]. CSEE J. Power Energ. Syst. 4 (2), 188–196. doi:10.17775/cseejpes.2018.00110
Huang, C., Wang, C., and Ning, X. (2019). Distribution Expansion Planning Based on Strong Coupling of Operation and Spot Market. Proceeding of the CSEE. 39 (16), 4716–4731. doi:10.13334/j.0258-8013.pcsee.180685
Jiang, Y., Liu, X., and Xue, Z. (2004). Research on Evaluation Index of Energy Conversion System. Res. Approach. 26 (3), 27–31. doi:10.1016/j.eneco.2004.02.002
Liu, W., Wang, D., Yu, X., Ma, L., Xue, S., and Wu, Z. (2018). Multi-objective Planning of Micro Energy Network Considering P2G-Based Storage System and Renewable Energy Integration. Automation Electric Power Syst. 42 (16), 11–20. doi:10.7500/AEPS20180228003
Liu, Y., Ming, Z., and Lin, X. (2009). Generation Capacity Investmen Dynamics Based on Price Elasticity of Demand Side. Automation Electric Power Syst. 33 (01), 22–26.
Mago, P.J., and Chamra, L.M. (2009). Analysis and Optimization of CHP Systems Based on Energy, Economical, and Environmental Considerations. Energy and Buildings. 41 (10), 1099–1106. doi:10.1016/j.enbuild.2009.05.014
Pazouki, S., and Haghifam, R. (2016). Optimal Planning and Scheduling of Energy Hub in Presence of Wind, Storage and Demand Response under Uncertainty. Int. J. Electr. Power Energ. Syst. 80 (9), 219–239. doi:10.1016/j.ijepes.2016.01.044
Quan, C., Dong, X., and Jiang, T. (2018). Optimization Planning of Integrated Electricity-Gase Community Energy System Based on Couple CCHP. Power Syst. Technology. 42 (08), 2456–2466.
Salimi, M., Ghasemi, H., and Adelpour, M. (2015). Optimal Planning of Energy Hubs in Interconnected Energy Systems: a Case Study for Natural Gas and Electricity. IET Generation Transm. Distribution. 9 (8), 695–707. doi:10.1049/iet-gtd.2014.0607
Unsihuay-Vila, C., Marangon-Lima, J. W., Zambroni de Souza, A. C., Perez-Arriag, I. J., Balestrassi, P. P., et al. (2010). A Model to Long-Term, Multiarea, Multistage, and Integrated Expansion Planning of Electricity and Natural Gas Systems. IEEE Trans. Power Syst. 25 (2), 1154–1168. doi:10.1109/tpwrs.2009.2036797
Wang, D., Hu, Q., Jia, H., Hou, K., Du, W., Chen, N., et al. (2019). Integrated Demand Response in District Electricity-Heating Network Considering Double Auction Retail Energy Market Based on Demand-Side Energy Stations. Appl. Energ. 248, 656–678. doi:10.1016/j.apenergy.2019.04.050
Wang, W., Wang, D., and Jia, H. (2017). Steady State Analysis of Electricity-Gas Regional Integrated Energy System with Consideration of NGS Network Status. Proc. CSEE. 37 (5), 1293–1304. doi:10.13334/j.0258-8013.pcsee.160250
Wang, Z., Tang, Y., and Qiao, B. (2018). Research on Integrated Natural Gas and Electric Power System Optimal Power Flow and its Environmental Synergy. Proc. CSEE. 38, 111–120. doi:10.13334/j.0258-8013.pcsee.180068
Wu, J. (2016). Drivers and State-Of-The-Art of Integrated Energy Systems in Europe. Automation Electric Power Syst. 40 (5), 1–7. doi:10.7500/AEPS20150512001
Wu, Z., Liu, Y., and Gu, W. (2019). A Modified Decomposition Method for Multistage Planning of Energy Storage, Distributed Generation and Distribution Network. Proc. CSEE. 39 (16), 4705–4714. doi:10.13334/j.0258-8013.pcsee.180668
Yang, Y., Pei, W., and Qi, Z. (2012). Planning Method for Hybrid Energy Microgrid Based on Dynamic Operation Strategy. Automation Electric Power Syst. 36 (19), 30–36. doi:10.3969/j.issn.1000-1026.2012.19.006
Zeng, H., Liu, T., and He, C. (2019a). Multi-objective Optimization for Integrated Natural-Gas and Electricity Energy System Considering Power-To-Gas. Electr. Meas. Instrumentation. 56 (8), 99–107. doi:10.19753/j.issn1001-1390.2019.08.016
Zeng, M., Liu, Y., and Zhou, P. (2019b). Review and Prospects of Integrated Energy System Modeling and Benefit Evaluation. Power Syst. Technology. 42 (6), 1697–1708. doi:10.13335/j.1000-3673.pst.2018.0150
Zhang, X., Shahidehpour, M., and Alabdulwahab, A. (2015). Optimal Expansion Planning of Energy Hub with Multiple Energy Infrastructures. IEEE Trans. Smart Grid. 6 (5), 2302–2311. doi:10.1109/tsg.2015.2390640
Keywords: multi-stage planning, integrated energy system, development stage, dynamic planning, configuration
Citation: Fan D, Dou X, Xu Y, Wu C, Xue G and Shao Y (2021) A Dynamic Multi-Stage Planning Method for Integrated Energy Systems considering Development Stages. Front. Energy Res. 9:723702. doi: 10.3389/fenrg.2021.723702
Received: 11 June 2021; Accepted: 23 July 2021;
Published: 05 August 2021.
Edited by:
Yingjun Wu, Hohai University, ChinaReviewed by:
Rui Bo, Missouri University of Science and Technology, United StatesJun Liu, Xi’an Jiaotong University, China
Copyright © 2021 Fan, Dou, Xu, Wu, Xue and Shao. This is an open-access article distributed under the terms of the Creative Commons Attribution License (CC BY). The use, distribution or reproduction in other forums is permitted, provided the original author(s) and the copyright owner(s) are credited and that the original publication in this journal is cited, in accordance with accepted academic practice. No use, distribution or reproduction is permitted which does not comply with these terms.
*Correspondence: Xun Dou, ZHhuanV0QG5qdGVjaC5lZHUuY24=