 Huiling Su
 Qifeng Huang
95% of researchers rate our articles as excellent or good
Learn more about the work of our research integrity team to safeguard the quality of each article we publish.
Find out more
ORIGINAL RESEARCH article
Front. Energy Res. , 20 August 2021
Sec. Smart Grids
Volume 9 - 2021 | https://doi.org/10.3389/fenrg.2021.723647
This article is part of the Research Topic The Emerging Form of Smart Grid: Smart Integrated Energy Systems and Prosumer Centred Energy Community View all 16 articles
In the context of the energy crisis and environmental deterioration, the integrated energy system (IES) based on multi-energy complementarity and cascaded utilization of energy is considered as an effective way to solve these problems. Due to the different energy forms and the various characteristics in the IES, the coupling relationships among various energy forms are complicated which enlarges the difficulty of energy efficiency evaluation of the IES. In order to flexibly analyze the energy efficiency of the IES, an operation efficiency evaluation model for the IES is established. First, energy utilization efficiency (EUE) and exergy efficiency (EXE) are proposed based on the first/second law of thermodynamics. Second, the energy efficiency models for five processes and four subsystems of the IES are formed. Lastly, an actual commercial-industrial park with integrated energy is employed to validate the proposed method.
The high-efficient utilization of clean energy received widespread attention and the energy internet and the IES has set off a wave of global energy systems reform (Meibom et al., 2013; Mancarella, 2014). In order to improve the economy and environmental protection of systems, IES can coordinate the multi-energy allocation, improve energy efficiency, and offer high-quality energy services by energy cascaded utilization. Because of the complicated structure, various equipment, and the utilization of and terminal energy, it is of great significance to study the optimal operation for the realization of multi-energy complementarity and energy efficiency promotion (OMalley and Kroposki, 2013; Chen et al., 2019). IES is made up of energy production process (EPP), energy transmission process (ETP), energy conversion process (ECP), energy storage process (ESP), and energy utilization process (EUP). These processes can affect the energy efficiency and function of the IES. Therefore, it is necessary to propose a rational energy efficiency evaluation model for elaborating the relationship between those processes and IES.
At present, much valuable research about the energy efficiency evaluation of IES had been done from various points of view. And the result of those researches provides experience for reference. However, due to the various kinds of IES and new techniques applied in IES, a universally applicable energy efficiency evaluation method of IES is still unformed. The main problems of existing research are as follows: 1) much research mainly focused on the modeling, evaluating, and analysis of the entire systems; it is not practical to apply the energy efficiency evaluation of the practical IES. 2) These researches works put much attention on the energy efficiency evaluation of power systems but neglect the natural gas equipment and the cooling and heating equipment.
There are mainly two energy efficiency indices for IES. One is the “energy utilization efficiency” based on the first law of thermodynamics. The first law of thermodynamics mainly studies the quantity relationship between energy input and output. The relevant research of EUE mainly focuses on the energy efficiency of heat pumps (Willem et al., 2017), combined cooling, heating, and power (CCHP) (Wang et al., 2015), and heating ventilation air conditioning (Alves et al., 2016) in the IES. However, the references above ignore the effect of energy quality when evaluating the efficiency of IES via the EUE index.
The other index is the “exergy efficiency” based on the second law of thermodynamics. The second law of thermodynamics puts emphasis on energy quality. The energy efficiency evaluation based on the second law of thermodynamics is concentrated on the field of thermodynamic engineering such as thermal power plants (Ibrahim et al., 2017) and heating ventilation air conditioning, but there is little research on the efficiency analysis of IES via the EXE index. Wang et al. (2015) analyzed and calculated the EUE and the EXE of renewable energy without adequate consideration of the energy coupling relationship in the IES. Huang et al. (2017) summarized four factors affecting the energy efficiency of the IES based on the parametric method. The efficiency analysis emphasizes the equipment but neglects the comprehensive analysis of energy supply subsystems.
In addition to the problems mentioned above, the current references mainly focus on the planning and operation mode optimization of the IES (Li et al., 2018; Qin et al., 2021; Li and Wang, 2021; Li et al., 2021), but they pay less attention to its performance. Besides, there is most literature only considering an independent energy system (Zhang et al., 2021; Ding et al., 2021) but they neglect the complementary coupling between different energy subsystems in the IES. It results in the inadequate efficiency analysis of the IES and the interrelationship among EPP, ETP, ECP, ESP, and EUP. Moreover, making a single analysis for a subsystem or a process cannot completely reflect the energy efficiency of the IES due to the lack of overall evaluation.
The energy efficiency analysis aims to find out the shortcomings of the processes in the IES and then to improve the utilization of non-renewable energy. In this study, the ratio of the total energy consumption on the demand side and the total energy input on the supply side is defined as the EUE index of the IES. Under the different energy quality of multi-energy, this article utilizes the energy quality coefficient to convert distinct energy levels of multi-energy into the same energy level (Hu et al., 2020; Abu-Rayash and Dincer, 2020), and the ratio of the exporting and the inputting amount after conversion is defined as the EXE index.
Based on the definition above, the energy efficiency index evaluation models are established for EPP, ETP, ECP, ESP, and EUP. In this study, it is assumed that the IES can be decomposed into an electric subsystem (ESS), heat subsystem (HSS), cooling subsystem (CSS), and gas subsystem (GSS). The energy efficiency models corresponding to each subsystem are established for elaborating their influence on the IES. This study has two main contributions:
1) Formed the energy efficiency index evaluation models for investigating the relation among EPP, ETP, ECP, ESP, EUP, and the IES.
2) Constructed the energy efficiency models of ESS, HSS, CSS, and GSS based on the energy coupling relationship in each subsystem.
The remainder of this study is organized as follows: Basic Indices for Energy Efficiency established the universal energy efficiency calculation model of this study such as EUE and EXE. Based on the universal energy efficiency calculation model, the energy efficiency model of each process in IES is formed in Energy Efficiency Analysis of the Five Processes in the Integrated Energy System. Energy Efficiency Analysis of Subsystem of Integrated Energy System proposed the energy efficiency model of subsystems. Then, the case study of a typical IES based on the AHP-entropy weight method is provided in Case Study. Some conclusions are finally drawn in Conclusion.
The EUE index
where
The EXE index
The energy quality coefficient
1) Coal
where
2) Gas
where
3) Power
Power has the highest level of energy quality in various types of energy. Therefore, the energy coefficient of power hardly changes with the temperature, so its energy quality coefficient can be defined as one. It elaborates that all the external electric energy input can be converted to active power. Therefore, power can be considered as a benchmark for various energy conversions.
4) Thermal energy
where
5) Cooling energy
where
The energy efficiency analysis should consider the energy efficiency of both the five processes and the entire IES so that it can find out the deficient process in time when the energy efficiency varies low. It also makes the IES a safe, stable, and effective operation mode. Therefore, in this section, the energy efficiency evaluation models of five processes are established, respectively, for making a comprehensive analysis of the influence of each process on the whole energy efficiency of the IES.
The research objects of EPP are the production equipment, the purchased power, and interior energy. As shown in Figure 1, there is various interior energy such as coal and gas. There are multiple ways to utilize these centralized resources, such as power generation by coal-fired power generation (CFPG) and producing thermal energy by electrical heating. The EUE and the EXE of EPP are calculated by the primary energy consumption and the energy production.
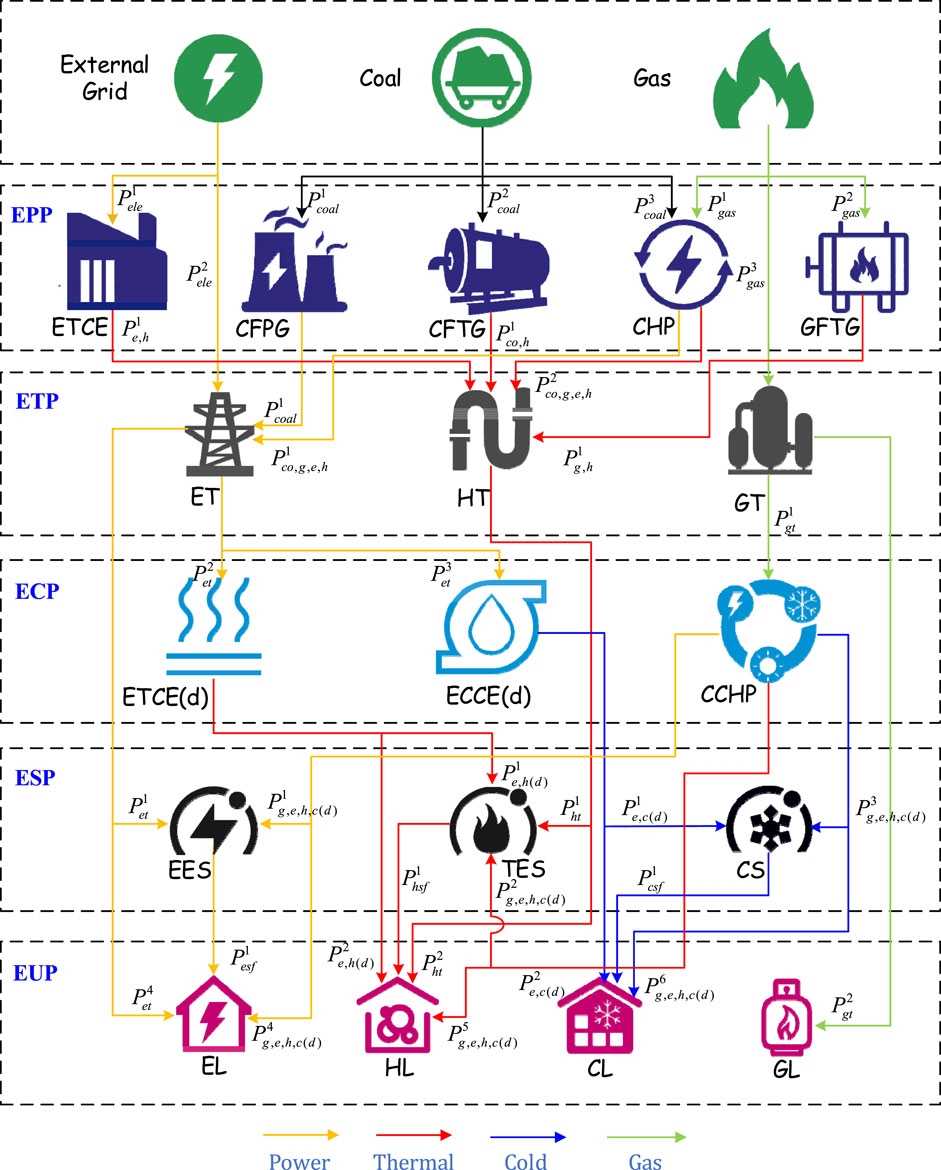
FIGURE 1. Schematic diagram of the district multi-energy system.
The EUE of EPP
The EXE of EPP
The ETP mainly considers the transmission loss of multi-energy. In the ETP, the energy input is composed of two parts: one comes from the external energy source network, the other is the energy export from EPP. The influencing factors of electricity transmission (ET) loss include loads, the length, material, and rated voltage of the transmission line. Heat transmission (HT) loss is generated by heat radiation and heat convection. The gas transmission (GT) loss is caused by pressure differences. Taking these factors into consideration, the “EUE” and the “EXE” of ETP can be calculated by
where
Based on the above models, the primary energy consumption can be calculated by
where
Similar to the EPP, the ECP also concerns the change of type of energy. The ECP emphasizes multi-energy coupling and multi-agent interaction. The main differences between these two processes are the type of equipment they used. The EPP mostly adopts centralized equipment such as the thermal plant and centralized electrical heating equipment. But the ECP mainly adopts the distributed equipment, such as combined cooling, heating, and power (CCHP); distributed electric-thermal coupling equipment (
where the thermal energy supplied to the thermal storage equipment (TES) which is generated by the
The ESP is an indispensable process for IES. The improvement of energy storage not only deepens the degree of multi-energy coupling but also promotes the energy efficiency level of IES. Besides, it is helpful to the power peak load shifting, improves the stable operation of IES, and reduces the running cost of the system. The storage equipment has two working modes: energy storage mode and energy discharge mode. One storage equipment cannot perform both modes at the same time, so a coefficient that represents the working mode of the storage equipment should be considered. The EUE and the EXE can be written as
where
Comprehensively considering the ETP, ECP, and ESP shown in Figure 1, the EUE and the EXE of the EUP can be, respectively, written as
where
With the energy efficiency analysis of the five processes, the EUE and the EXE of the entire IES can be obtained:
where
IES is mainly represented by ESS, HSS, CSS, and GSS. The coupling and interaction of the subsystems mentioned above is not only a typical physical phenomenon in the IES but also a key part of IES. The analysis of each subsystem helps to further clarify the internal relationship of the energy system. In this section, this study analyzes the energy flow relationship of each piece of equipment in the IES. After that, we decouple the energy flow in each process based on the different types of loads to obtain the internal energy flow relationship of each subsystem. Finally, the energy efficiency calculation models of each subsystem are established according to the internal energy flow relationships of each subsystem. During the energy efficiency analysis of each subsystem, the energy flow in one transmission line might participate in different subsystems. Hence, the distribution coefficient is proposed to determine the amount of different energy in each subsystem. The distribution coefficients and energy flow in their corresponding subsystem are given in Table 1.
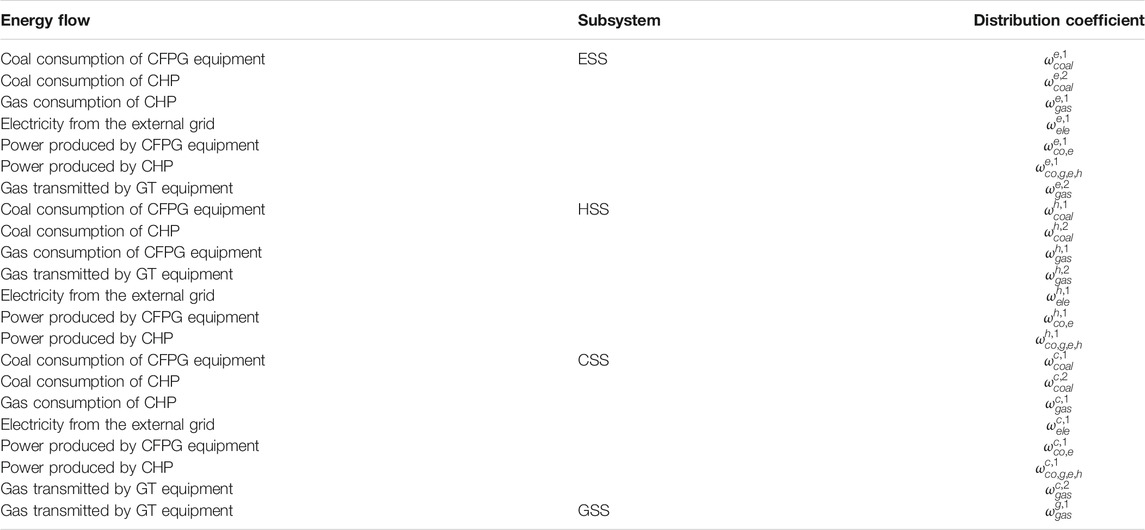
TABLE 1. The distribution coefficient of each energy flow.
As pictured in Figure 2, the EL can be satisfied through four ways: 1) the electric energy produced by CFPG equipment and CHP and then supplied to the EL by transmission network; 2) the output power of CCHP in ECP; 3) the power discharged by TES; and 4) the electricity bought from the external grid.
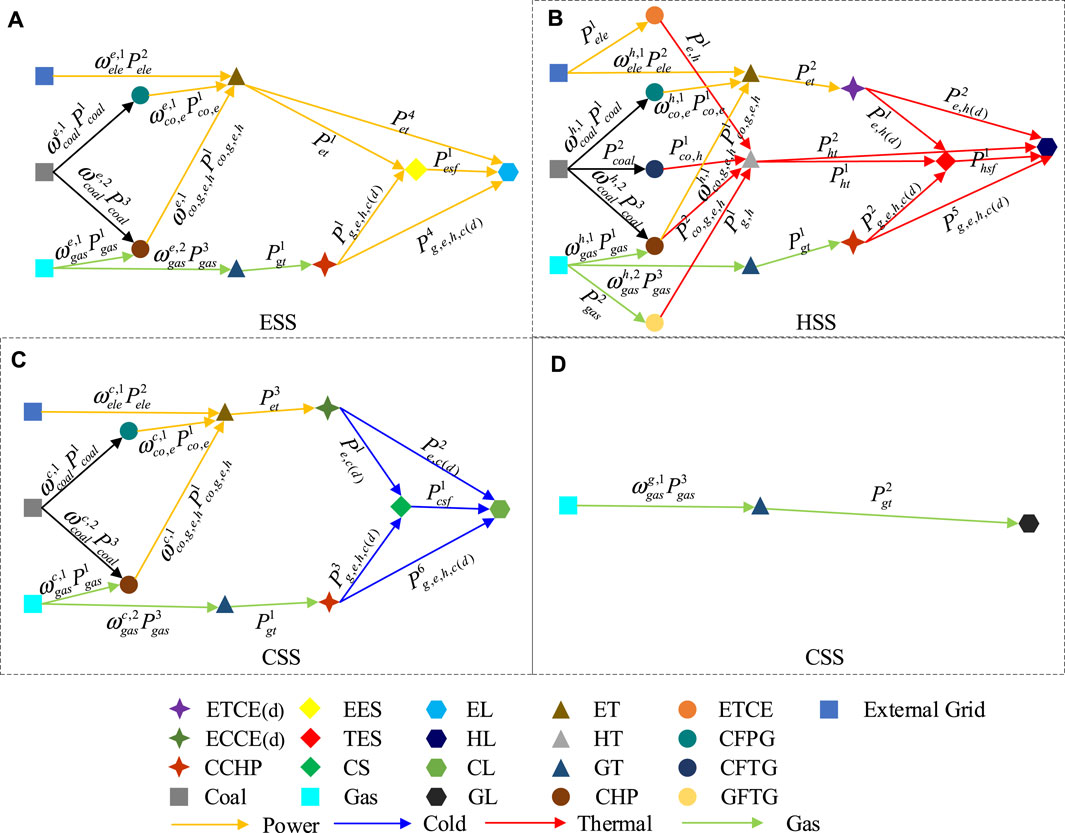
FIGURE 2. Schematic diagram of subsystems.
According to Figure 2, the EUE and the EXE of the electric subsystem can be, respectively, written as
where
As can be seen in Figure 2 the structure of HSS is more complicated compared to the structure of ESS. The source of thermal energy supply consists of three parts: 1) the thermal energy produced by the electrical-heat coupling equipment, CFTG equipment, CHP, and GFTG equipment; 2) the output thermal energy of distributed electrical-heat coupling equipment and CCHP in ECP; and 3) the thermal energy discharged by TES.
According to Figure 2, the energy efficiency models of HSS can be expressed as
where
As can be seen in Figure 2, there is no cooling energy generated in the EPP of CSS. The source of cooling energy supply consists of two parts: 1) the output cooling energy of CCHP in ECP and 2) the cooling energy discharged by CS. The EUE and the EXE of the CSS can be calculated by
where
The structure of the GSS is depicted in Figure 2. The research on the GSS is mainly around the modeling of the gas supply system which is composed of the ETP and EUP. The structure of GSS is simpler compared with other subsystems. The gas demand is satisfied with the gas bought from the external gas pipe network. The EUE and the EXE are equal because there is no multi-energy involved in GSS. The energy efficiency indices of this subsystem are as follows:
where
1) System Description
Taking actual data of an actual commercial-industrial park to analyze. The main load area of this park is composed of the business district, industrial district, and residential district. Each district has the load demand of electricity, heating, cooling, and gas. Due to the long heating periods and high heat load level, the installation rate of the heat supply unit accounts for a large proportion. The output of the IES involves power, gas, 9°C chilled medium water, and 90°C heating medium water. The energy equipment mainly includes centralized electric heating (CEH), thermal power (TP), coal-fired boiler (CFB), combined heat and power (CHP), and gas boiler (GB) in EPP; power grid (PG), heating supply pipeline (HSP), and gas supply pipeline (GSP) in ETP; and distributed electrical-heat transfer (DEHT), distributed electric cooling (DEC), and combined cooling heating and power (CCHP) in ECP; EES, TES, and CS in ESP. The GB uses natural gas as the input energy to produce the 1 MPa 180°C steam, which is supplied to the heat load via water. CCHP consists of a gas engine and absorption water heating and chilling unit. The absorption water heating and chilling unit has two working modes: one is the cooling mode (produce cooling water at 9°C) and the other is the heating mode (produce hot water at 90°C). The heat generated by the gas engine during the power generation is utilized by absorption water heating and chilling unit to produce cooling or thermal energy. The energy conversion efficiency models and parameters of the typical equipment in this paper can be found in (Liu et al., 2016; Abeysekera et al., 2016; Huang et al., 2018; Li et al., 2018; Wang et al., 2020; Xi et al., 2021). Particularly, the equivalent models mentioned above are not the actual physical equipment but the equivalence and abstraction of each piece of equipment in the IES according to the energy conversion relationship.
2) Energy Quality Coefficient
The energy quality coefficient varies with the temperature variety of the environment so that taking the variation of energy quality coefficient under different seasons into consideration is very important. The summer average temperature and winter average temperature in the IES region is 27.6°C (300.75 K) and 7.9°C (281.05 K), respectively. The energy quality coefficients of various energy sources in different seasons are shown in Table 2.
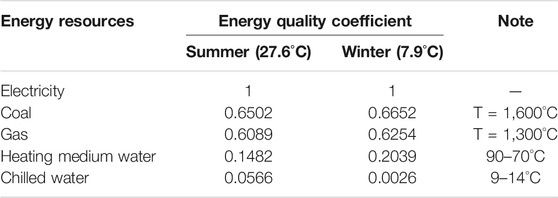
TABLE 2. The energy quality coefficient of common energy resources.
Figure 3 shows the load curves of electrical, thermal, cooling, and gas on a typical day in winter and summer. The IES has a high demand for EL in winter and summer, but the demand for HL, CL, and GL varies greatly with the season due to the variation of temperature and sunshine time.
3) Energy Demand Situation
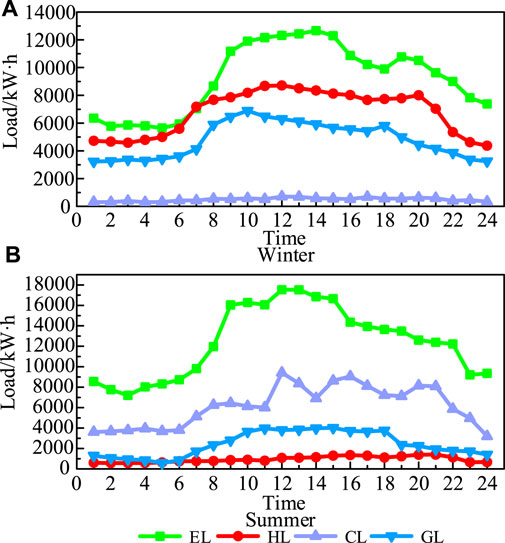
FIGURE 3. The load data of IES in winter and summer.
Using the energy efficiency indices calculation equation of the IES proposed in this study, we can get the energy efficiency indices value of the typical day in winter and summer (24 h) and count the maximum and the minimum value of the indices. Then, we do a comprehensive analysis and comparison to the energy efficiency differences of IES, each subsystem, and each process. Table 3, Table 4, Table 5, Table 6, Table 7, and Table 8 show the highest and lowest value of energy efficiency indices for IES and each subsystem in EPP.
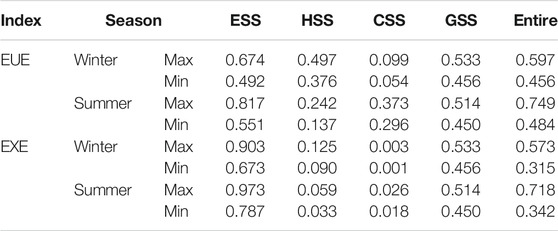
TABLE 3. The energy efficiency of IES.
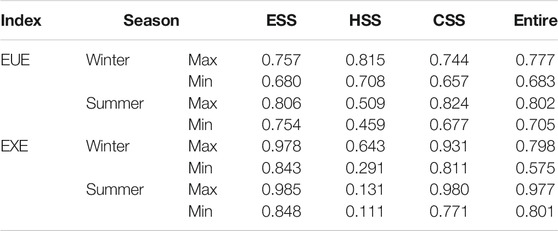
TABLE 4. The energy efficiency of EPP.
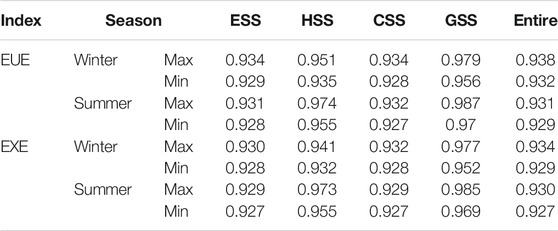
TABLE 5. The energy efficiency of ETP.
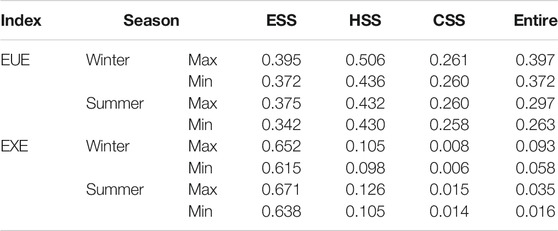
TABLE 6. The energy efficiency of ECP.
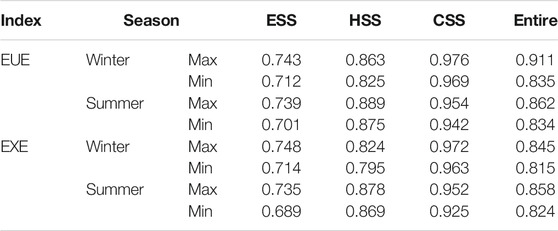
TABLE 7. The energy efficiency of ESP.
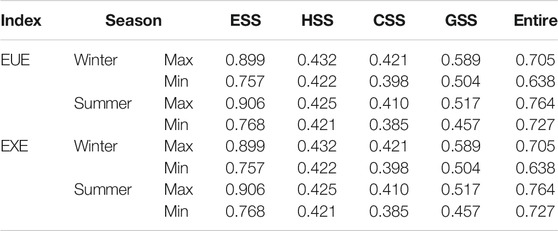
TABLE 8. The energy efficiency of EUP.
The size relationship between the EUE and the EXE is related to the quality of energy. It can be seen from Table 3 that the EXE of the ESS is higher than its EUE. It is because electricity, as the highest quality energy, is obtained through the conversion of lower quality primary energy sources. The energy quality of thermal and cooling energy is low and is generally generated by consuming high-quality energy, so the EXE of HSS and CSS are less than the EUE of them. The EUE and EXE of the IES are both higher in summer than those in winter. The reason is that more heat-generating units are involved in the operation of the IES in winter than that in summer, resulting in lower energy efficiency levels in the system.
a) Energy Efficiency of EPP
Table 4 shows that the EUE of HSS in summer is 0.459 but the EXE of HSS is significantly lower than that of ESS and the CSS, with only 0.111. It is caused by the high temperature in summer compared to that in winter which leads to the low energy quality coefficient of thermal energy. HSS provides low-quality energy production at the cost of high-quality energy consumption so that the degree of energy utilization of this subsystem is not satisfactory. Since the CSS of this IES produces only electricity in the EPP and does not produce cooling energy with a lower energy quality coefficient, the EUE and EXE of ESS and CSS are similar in this process. The EUE and the EXE of the IES in winter are lower than those in summer in EPP because the heat load demand is higher in winter but the overall efficiency of the main heat production equipment is lower compared to that of the power generation equipment, resulting in lower overall energy efficiency.
b) Energy Efficiency of ETP
The energy efficiency of the ETP is related to the quantity of energy transmission. Table 5 shows that the EUE and EXE of HSS and GSS in winter is lower than that in summer due to the high demand for thermal energy and gas in winter. It also can be seen that the EUE and EXE of ESS and CSS are higher in summer than those in winter. This is because there has been an increase in the amount of electricity delivered by transmission lines. On the whole, the EUE and EXE of ETP in winter is higher than those in summer. The reason is that the share of electrical energy in the ETP in winter is less than that in summer.
c) Energy Efficiency of ECP
Table 6 shows that, in ECP, the EXE of CSS is very low in winter and summer which leads to the low EXE of IES. There are two reasons: one is that the energy level of thermal and cooling energy is very low and both are generated by consuming high energy at high energy levels, so the EXE is low. The other is that the electric energy output accounts for a very small proportion of the output of ECP, so although the EXE of the ESS is much higher in this process than that of the HSS and CSS, the EXE of IES in this process is still low.
d) Energy Efficiency of ESP
The energy efficiency of the ESP mainly depends on the storage and discharge energy of energy storage equipment. As it can be seen from Table 7, the energy efficiency of the ESP of HDD is higher in winter than in summer, because the storage and discharge energy of thermal energy are larger in winter. Due to the higher storage and discharge energy in summer than that in winter, the overall energy efficiency of the ESP in winter is higher than that in summer.
e) Energy Efficiency of EUP
As can be seen in Table 8, the energy efficiency of EUP in summer is higher than that in winter. This is because the efficiency of the electric energy consumption is much higher than that of the thermal, gas, and cooling energy consumption, and the proportion of the electric to total load is higher than that in winter. Therefore, the overall efficiency in EUP in summer is improved compared to winter.
In the previous section, the energy efficiency indices of the whole system, each subsystem, and each process are calculated considering a typical winter and summer day. In order to make good use of these data to evaluate the energy efficiency of each subsystem and each process, the AHP-entropy weight method (Yang et al., 2020) is introduced to process the results of these indices. The AHP-entropy method is an index calculation method that combines subjective weight and objective weight. First, the subjective weight based on the AHP is obtained from the following steps: 1) determining the hierarchy structure of each index; 2) forming the judgment matrix; and 3) consistency check of subjective weight. Second, the objective weight determined by the entropy weight method is obtained from the following three steps: 1) normalization processing of each index; 2) calculating the entropy value of each index; and 3) calculating the entropy weight of each index. At last, the general weight of each index which reflects the actual situation is calculated by integrating the subjective and objective weight. The information entropy results in winter and summer are shown in Table 9 and Table 10.
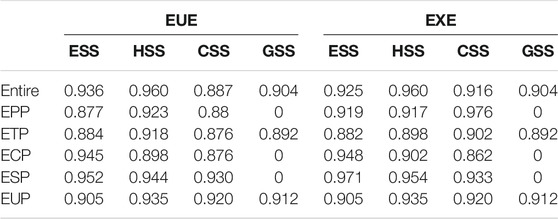
TABLE 9. The information entropy results in winter.
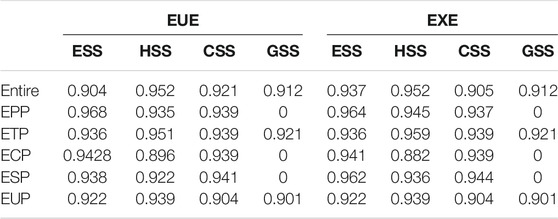
TABLE 10. The information entropy results in summer.
Calculate the weight of each subsystem in each process according to the information entropy, and then combine them with the weights calculated by the AHP method for calculation. The results are the weights used in this study for the energy efficiency evaluation, as shown in Figure 4.

FIGURE 4. The weight of each subsystem in winter and summer.
It can be seen from Figure 4 that the weights of HSS and CSS vary greatly under different seasons. The main cause of that is the less demand for the heat and gas load in summer which leads to the less weight of HSS and GSS in summer.
From the aforementioned analysis, it is clear that the amount of energy efficiency of each subsystem depends on the amount of the various loads and the equipment involved in the operation of each subsystem. Based on the weights and the normalized data of each index, the evaluation results of each subsystem in the integrated energy system can be obtained.
As we can see in Figure 5, in winter, the HSS has the best energy efficiency level, the ESS and the GSS took second place, and the CSS is the worst. The evaluation results in production and ETP of CSS are very close to that of ESS. It is because the CSS only considers the production of electricity and the transmission of electricity and gas involved just like the ESS so that the efficiency levels of these two subsystems EPP and ETP are very similar. However, the overall evaluation results of these two subsystems are quite different. The causes are included: 1) the energy quality coefficient is very low due to the low temperature in winter and 2) the demand for cooling energy is less, resulting in lower weights of CSS in each process. The energy efficiency level of GSS is high because the demand for gas is high in winter and the transmission loss is low.
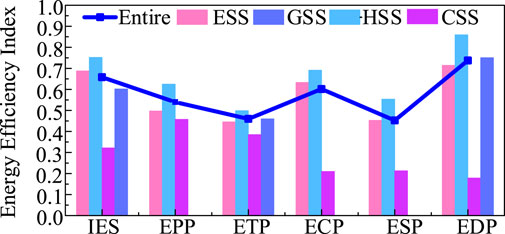
FIGURE 5. The energy efficiency evaluation results of the IES in winter.
From the evaluation results of this park in summer shown in Figure 6, it can be seen that, unlike the evaluation results of the cooling system in winter, the energy efficiency level of the HSS always keeps at a low level. This is because the energy quality of thermal energy and the demand for thermal energy in summer is much lower than that in winter. And then the biggest difference between the thermal energy supply in summer and the cooling energy supply in winter is that the thermal energy is present in all processes of the IES which leads to the low energy efficiency level in each process of the HSS. The ESS and the CSS have high energy efficiency levels because the coupling degree and the demand for cooling energy and gas are high. The GSS has a significant decrease in energy efficiency level compared to winter because the gas load demand is lower in summer and the overall efficiency of the EUP is lower than that in winter.
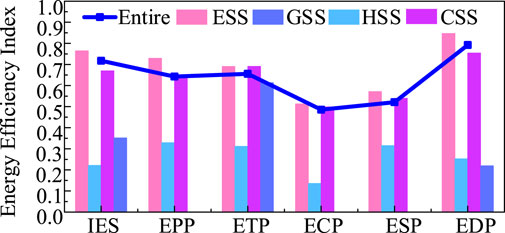
FIGURE 6. The energy efficiency evaluation results of the IES in summer.
In this study, the calculation models of EUE and EXE for the IES are constructed. The energy efficiency of each process (including EPP, ETP, ECP, ESP, and EUP) and each subsystem (including ESS, HSS, CSS, and GSS) can be obtained through the proposed models. Based on the example of an IES park, the validity of these models is verified. By comparing the energy efficiency of IES in winter and summer, it can be seen that the energy efficiency in summer is better than that in winter because of the higher energy efficiency level of EPP and ETP in summer. In addition, it was found after analysis that there is a relationship between the EUE and the EXE. The calculation of EXE is based on the EUE, and they are positively correlated. Therefore, it is of great significance for the improvement of the energy efficiency of the IES.
The proposed models provide a novel idea and direction for the energy efficiency evaluation of the IES. They can provide the tool for the energy efficiency improvement of processes, subsystems, and the IES. These models can guide the IES operator to make the scientific and practical dispatch planning and operation management strategy.
For further study, future work can form the energy efficiency in more detail. For EPP, we will consider the uncertainty of distributed energy resources. For energy resources supply, we will take the energy price and cost of each subsystem into consideration to establish a more comprehensive model.
The original contributions presented in the study are included in the article/Supplementary Material; further inquiries can be directed to the corresponding author.
HS and QH designed the model and the computational framework and analyzed the data. HS and ZW carried out the implementation and performed the calculations. HS and QH wrote the manuscript with input from all authors. QH conceived the study and was in charge of overall direction and planning.
The authors declare that this study received funding from the Project of State Grid Jiangsu Electric Power Co., Ltd (No. J2020115). The funder was not involved in the study design, collection, analysis, interpretation of data, the writing of this article or the decision to submit it for publication.
HS, QH, and ZW were employed by the company State Grid Jiangsu Electric Power Co., Ltd.
All claims expressed in this article are solely those of the authors and do not necessarily represent those of their affiliated organizations, or those of the publisher, the editors, and the reviewers. Any product that may be evaluated in this article, or claim that may be made by its manufacturer, is not guaranteed or endorsed by the publisher.
Abeysekera, M., Wu, J., Jenkins, N., and Rees, M. (2016). Steady state analysis of gas networks with distributed injection of alternative gas. Appl. Energ. 164, 991–1002. doi:10.1016/j.apenergy.2015.05.099
Abu-Rayash, A., and Dincer, I. (2020). Development of an integrated energy system for smart communities. Energy 202, 117683. doi:10.1016/j.energy.2020.117683
Alves, O., Monteiro, E., Brito, P., and Romano, P. (2016). Measurement and classification of energy efficiency in HVAC systems. Energy and Buildings 130, 408–419. doi:10.1016/j.enbuild.2016.08.070
Chen, S., Wei, Z., Sun, G., Cheung, K. W., Wang, D., and Zang, H. (2019). Adaptive Robust Day-Ahead Dispatch for Urban Energy Systems. IEEE Trans. Ind. Electron. 66 (2), 1379–1390. doi:10.1109/TIE.2017.2787605
Ding, H., Li, J., and Heydarian, D. (2021). Energy, exergy, exergoeconomic, and environmental analysis of a new biomass-driven cogeneration system. Sustainable Energ. Tech. Assessments 45, 101044. doi:10.1016/j.seta.2021.101044
Hu, X., Zhang, H., Chen, D., Li, Y., Wang, L., Zhang, F., et al. (2020). Multi-objective planning for integrated energy systems considering both exergy efficiency and economy. Energy 197, 117155. doi:10.1016/j.energy.2020.117155
Huang, X., Xu, Z., Sun, Y., Xue, Y., Wang, Z., Liu, Z., et al. (2018). Heat and power load dispatching considering energy storage of district heating system and electric boilers. J. Mod. Power Syst. Clean. Energ. 6 (5), 992–1003. doi:10.1007/s40565-017-0352-6
Huang, Z., Yu, H., Chu, X., and Peng, Z. (2017). Energetic and exergetic analysis of integrated energy system based on parametric method. Energ. Convers. Manag. 150, 588–598. doi:10.1016/j.enconman.2017.08.026
Ibrahim, T. K., Basrawi, F., Awad, O. I., Abdullah, A. N., Najafi, G., Mamat, R., et al. (2017). Thermal performance of gas turbine power plant based on exergy analysis. Appl. Therm. Eng. 115, 977–985. doi:10.1016/j.applthermaleng.2017.01.032
Li, M., and Wang, Z. (2021). Modeling and Optimization of Integrated Energy System Based on Energy Circuit Theory. IEEJ Trans. Elec Electron. Eng. 16 (5), 696–703. doi:10.1002/tee.23349
Li, P., Wang, Z., Wang, N., Yang, W., Li, M., Zhou, X., et al. (2021). Stochastic robust optimal operation of community integrated energy system based on integrated demand response. Int. J. Electr. Power Energ. Syst. 128, 106735. doi:10.1016/j.ijepes.2020.106735
Li, S., Guo, L., Zhang, P., Wang, H., Cai, Z., Zhu, X., et al. "Modeling and Optimization on Energy Efficiency of Urban Integrated Energy System," 2018. 2nd IEEE Conference on Energy Internet and Energy System Integration (EI2), Beijing, China. IEEE, pp. 1–6. doi:10.1109/EI2.2018.8582411
Liu, X., Wu, J., Jenkins, N., and Bagdanavicius, A. (2016). Combined analysis of electricity and heat networks. Appl. Energ. 162, 1238–1250. doi:10.1016/j.apenergy.2015.01.102
Mancarella, P. (2014). MES (multi-energy systems): An overview of concepts and evaluation models. Energy 65, 1–17. doi:10.1016/j.energy.2013.10.041
Meibom, P., Hilger, K. B., Madsen, H., and Vinther, D. (2013). Energy Comes Together in Denmark: The Key to a Future Fossil-free Danish Power System. IEEE Power Energ. Mag. 11 (5), 46–55. doi:10.1109/MPE.2013.2268751
OMalley, M., and Kroposki, B. (2013). Energy Comes Together: The Integration of All Systems [Guest Editorial]. IEEE Power Energ. Mag. 11 (5), 18–23. doi:10.1109/MPE.2013.2266594
Qin, C., Wang, L., Han, Z., Zhao, J., and Liu, Q. (2021). Weighted directed graph based matrix modeling of integrated energy systems. Energy 214, 118886. doi:10.1016/j.energy.2020.118886
Wang, J.-J., Yang, K., Xu, Z.-L., and Fu, C. (2015). Energy and exergy analyses of an integrated CCHP system with biomass air gasification. Appl. Energ. 142, 317–327. doi:10.1016/j.apenergy.2014.12.085
Wang, J., Zhong, H., Yang, Z., Wang, M., Kammen, D. M., Liu, Z., et al. (2020). Exploring the trade-offs between electric heating policy and carbon mitigation in China. Nat. Commun. 11(1), 6054. doi:10.1038/s41467-020-19854-y
Willem, H., Lin, Y., and Lekov, A. (2017). Review of energy efficiency and system performance of residential heat pump water heaters. Energy and Buildings 143, 191–201. doi:10.1016/j.enbuild.2017.02.023
Xi, L., Wu, J., Xu, Y., and Sun, H. (2021). Automatic generation control based on multiple neural networks with actor-critic strategy. IEEE Trans. Neural Networks Learn. Syst. 32(6), 2483–2493. doi:10.1109/TNNLS.2020.3006080
Yang, G., Sun, J., and Xiao, H. (2020). Research on Testability Allocation Method Based on AHP-Entropy Weight Combination. IEEE International Conference on Information Technology. Chongqing: Big Data and Artificial Intelligence (ICIBA), 49–53. doi:10.1109/ICIBA50161.2020.9276984
Keywords: integrated energy system, multi-energy complementarity, energy efficiency, energy utilization efficiency, exergy efficiency
Citation: Su H, Huang Q and Wang Z (2021) An Energy Efficiency Index Formation and Analysis of Integrated Energy System Based on Exergy Efficiency. Front. Energy Res. 9:723647. doi: 10.3389/fenrg.2021.723647
Received: 11 June 2021; Accepted: 19 July 2021;
Published: 20 August 2021.
Edited by:
Yingjun Wu, Hohai University, ChinaReviewed by:
Tao Chen, Southeast University, ChinaCopyright © 2021 Su, Huang and Wang. This is an open-access article distributed under the terms of the Creative Commons Attribution License (CC BY). The use, distribution or reproduction in other forums is permitted, provided the original author(s) and the copyright owner(s) are credited and that the original publication in this journal is cited, in accordance with accepted academic practice. No use, distribution or reproduction is permitted which does not comply with these terms.
*Correspondence: Qifeng Huang, aHFmeXFocXlAMTI2LmNvbQ==
Disclaimer: All claims expressed in this article are solely those of the authors and do not necessarily represent those of their affiliated organizations, or those of the publisher, the editors and the reviewers. Any product that may be evaluated in this article or claim that may be made by its manufacturer is not guaranteed or endorsed by the publisher.
Research integrity at Frontiers
Learn more about the work of our research integrity team to safeguard the quality of each article we publish.