- 1Shenzhen Power Supply Bureau Co., Ltd., Shenzhen, China
- 2School of Electrical Engineering, Southeast University, Nanjing, China
As a kind of movable storage device, the electrical vehicles (EVs) are able to support load shaving through orderly charging. The existing researches mostly focus on the design of EVs charging control technology with little consideration of trip-chain-based consumer psychology of EV owners. To fill this gap, this article proposes a price-based orderly charging strategy for EVs considering both consumer psychology and trip chain. Then, the load shaving problem is transformed into a multiobjective optimization problem, to minimize peak-to-valley difference and network loss. A time-of-use price optimization model based on consumer psychology is established to describe the charging behavior of EV owners influenced by electricity price. Finally, the examples verify the feasibility of the proposed strategy by comparing the impact of EVs connected to grid under different ratios, different load transfer rates, and different scenarios.
Introduction
Electric vehicle (EV) is a zero-emission and low-emission green transportation tool, whose large-scale promotion can effectively alleviate the increasingly severe social problems such as energy crisis and environmental pollution today. Therefore, it has received extensive attention from all walks of life. Monte Carlo (MC) simulation is a stochastic simulation method based on probability and statistical theory. It is a method that uses random numbers to solve many calculation problems, which connects the problem to be solved with a certain probability model, and realizes statistical simulation or sampling with an electronic computer to obtain an approximate solution.
The development of vehicle-to-grid (V2G) technology has made EVs a mobile energy storage device with functions including “peak shaving and valley filling,” frequency modulation, and increasing reserve capacity (Cheng et al., 2014; Shafie-khah et al., 2016; Tang and Wang, 2015). Meanwhile, through proper scheduling of EVs charging and discharging, the ability of power system to absorb wind power, photovoltaic power, and other intermittent renewable energy can be enhanced (Ashtari et al., 2012; Li and Zhang, 2012; Xing et al., 2021).
As for the EVs charging and discharging control strategy in distribution network, there have been discussions in various directions at home and abroad. The trip data of household vehicles in the United States are analyzed by Rautiainen et al. (2012), where it is assumed that EVs and fuel vehicles have the same trip rules. Probabilistic models of trip start and end time, daily mileage, and charging characteristics are established through distribution fitting, and MC sampling is adopted to estimate EVs charging load distribution. Under the premise of considering constraints of EVs charging demand, a charging and discharging control strategy for EVs participating in power system frequency modulation services is proposed by Liu et al. (2013). For a three-phase unbalanced power distribution system, a mixed-integer linear programming model for orderly charging of EVs with the goal of minimizing power generation costs is established by Franco et al. (2015). A mixed integer programming model for EVs charging and discharging based on distributed control is established by Xing et al. (2016), where an efficient solution method for the characteristics of typical load curves is proposed. An optimal charging model with the minimum network loss within a given period as the objective function is established by Clement-Nyns et al. (2010), where impact of a large number of EVs on distribution system is analyzed from the perspective of network loss and voltage offset. The theory of traffic trip chain is introduced into the study of EVs load forecasting by Guo et al. (2014), Tang and Wang (2016), where a dynamic trip chain is assigned to each EV in the area. It characterizes the all-weather trip trajectory and driving law of EVs, and simulates the trip and charging behavior of EVs.
In the above-mentioned references, the main focus is on the design of EVs charging control technology with little consideration of trip-chain-based consumer psychology of EV owners. This article creatively considers both consumer psychology and trip chain, and proposes a price-based orderly charging strategy for EVs. First, based on the trip characteristics and charging behavior of EVs, the two characteristic variables of EV’s daily mileage and daily return time are modeled. Second, the load shaving problem is transformed into a multiobjective optimization problem, to minimize peak-to-valley difference and network loss. Then, a time-of-use price optimization model based on consumer psychology is established to describe the charging behavior of EV owners influenced by electricity price. Finally, the examples are provided to compare the impact of EVs connected to grid under different ratios, different load transfer rates, and different scenarios, whose results verify the feasibility of the proposed strategy.
Establishment of EVs Load Model
Classification of EVs
The EVs load model is closely related to the type, charging characteristics, and trip demand of EVs; meanwhile, the type of EVs directly determines the required charging characteristics and trip demand. According to different uses, EVs can be divided into different types such as electric buses, electric cars, and electric taxis. Electric taxis need to change shifts frequently, whose daily mileage, charging time, and location are relatively random, so their charging controllability is relatively weak. Therefore, this article mainly investigates two types of EVs, electric buses and electric cars.
Trip Chain and its Characteristic Variables
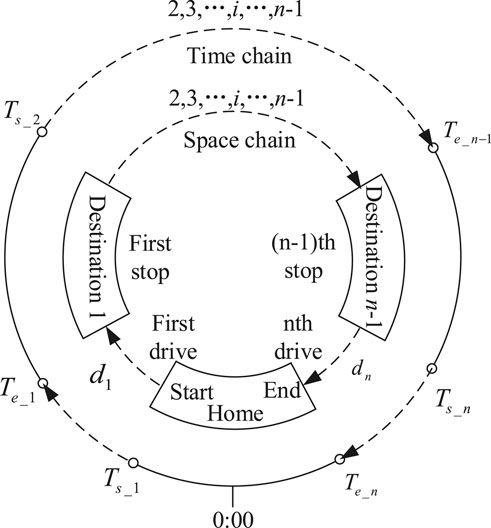
The trip chain refers to the connection form of different trip purposes in a certain time sequence to complete one or several activities. It is generally described as the process of a user starting from home and returning home during a scheduling period. During the process, the user will trip several times, and each time includes driving process and destination stopping process, which is the ith drive and the ith stop (i = 1,2, … ,n) in Figure 1.
The trip chain includes time chain and space chain. Similarly, its characteristic variables can also be divided into two categories.
1) Space chain characteristic variables, which describe the transfer of user trip in the space during scheduling period, including daily mileage, daily parking times, etc. This article mainly considers the daily mileage
According to reference (Sun et al., 2020; Heinisch et al., 2021), the daily mileage of buses conforms to normal distribution, and its probability density function is
where
According to reference (Sun et al., 2020; Heinisch et al., 2021), the daily mileage of cars conforms to log-normal distribution, and its probability density function is
where
2) Time chain characteristic variables, which describe the patterns of user trip in the time during scheduling period, including daily return time, daily trip time, etc. This article mainly considers the daily return time
According to reference (Muratori et al., 2018; Dagdougui et al., 2020), the daily return time of buses and cars both conform to normal distribution, and their probability density functions are
where
The probability density functions of characteristic variables of EVs’ daily mileage and daily return time are taken to carry out MC simulation. Then the distribution of the above random variables is taken as input. Starting from the time of first trip, data are extracted sequentially based on the mutual determination of each variable, to generate a complete trip chain.
In the trip chain, under the condition that some variables are known, the remaining variables can be calculated. It is assumed that EV is fully charged before first trip during the scheduling period, that is the state of charge (SOC) is 1, so its SOC at the beginning of charging is
where
It is assumed that EV has enough time to fully charge at night, and its charging speed can also meet the above requirements, so its charging duration is
where Pch is the charging power of EV and
Establishment of Consumer Psychology Model
Price Response Model Based on Consumer Psychology
The user’s response to electricity prices is embodied in adjusting own electricity usage periods according to price signals, changing electricity usage patterns by time periods, and so on. The price elasticity of electricity demand is the relative change in electricity consumption caused by the relative change in electricity price, which is
where
However, the user response model based on the electricity demand price elasticity matrix cannot reflect consumer psychology. There is a minimum noticeable difference in the stimulus of selling electricity price to users. When electricity price is less than the minimum noticeable difference, users basically have no response, and when selling electricity price is greater than an upper limit, users will no longer provide more transferable loads, whose response capacity is approaching saturation (Zhou et al., 2016). Therefore, this section builds a demand response (DR) model for electricity prices based on consumer psychology, and the load transfer rate from the peak to valley period is shown in Figure 2.
For a certain user, the EV load transfer rate from the peak to valley period is
where
Under the influence of time-of-use price, EV load will shift from peak to valley period. Given the value of λEV, the EV load in each period is
where
Except for EVs, other loads will also respond to changes in electricity prices. Similarly, the other load transfer rate from peak to valley period is
where
where
In summary, the baseline load of distribution network at each period without considering consumer psychology is
Considering consumer psychology, the total load of distribution network at each period is
Time-of-Use Price Optimization Model
Objective Function
Taking peak price
where
1)
where Pmax and Pmin are the maximum and minimum loads of the distribution network during scheduling period, respectively.
2)
where
Constraints
The model needs to meet five types of constraints. Constraints (1)–(2) ensure the operation requirements of distribution network, and constraints (3)–(5) maintain the benefits of EVs’ users to encourage users to follow the strategy to orderly charge.
1) Load change speed constraint
To prevent transferred load from exceeding the regulating capacity of generators, load change at adjacent moments needs to meet
where RU and RD are the upper and lower limits of load change at adjacent moments, respectively.
2) Load transfer rate constraint
3) Average price constraint
The average price after implementation of time-of-use price is
The average price before and after implementation of time-of-use price is required to remain unchanged, which is
where
4) Users charging cost constraint
The charging cost of users before and after implementation of time-of-use price are respectively
Users respond to time-of-use price by changing original electricity consumption habits, whose purpose is to make charging cost not higher than the original one after implementation of time-of-use price, which is
5) Users satisfaction constraint
Generally, the less the load changes, the higher the user satisfaction, so users satisfaction is defined as
where
Model Solving Method
The price response model based on consumer psychology is solved by matlab with MC simulation. The time-of-use price optimization model is solved by matlab with yalmip/gurobi toolboxes, which transforms the original load distribution problem into a large-scale mixed integer programming (MIP) problem. Specifically, on the basis of branch and bound method, outer approximation method and tangent secant method are introduced, which reduces invalid branches in the optimization of binary tree, and finally the optimal solution within tolerance range is obtained.
The power flow and node voltage of distribution network containing EVs are solved by matlab with matpower toolbox, specifically using the standard Newton-Raphson method. The testing process in this article is carried out on Gurobi 9.1.1 and Matpower 7.1.
Case Study
Basic Data and Parameter Settings
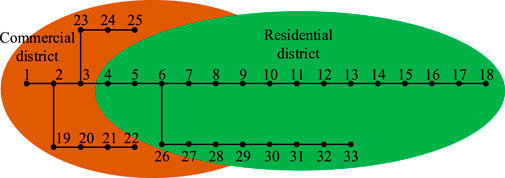
In this article, the IEEE-33 node distribution network with buses and cars is used for simulation verification, whose topology is shown in Figure 3.
According to the structure of trip chain and function of plot, the IEEE-33 node distribution network is divided into two functional districts, a residential district and a commercial district. Nodes 1–3, 19–25 are divided into commercial district, and nodes 4–18, 26–33 are divided into residential one, as shown in Figure 4. It is assumed that the final arrival of buses during scheduling period are all in commercial district, similarly, that of cars are all in residential district. EVs are only charged after daily returning, which has no effect on distribution network load during the driving process. It is assumed that each plot contains sufficient charging piles. The influence of location distribution of charging piles on charging behavior and route selection of EVs is not considered.
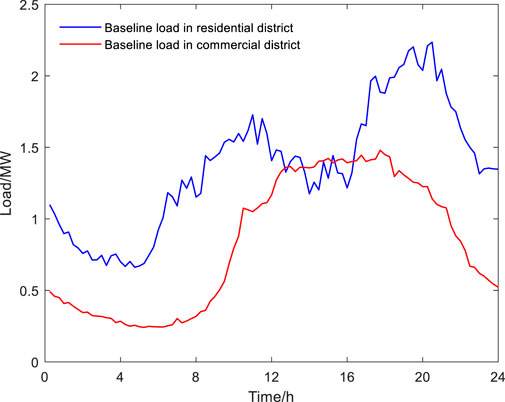
Based on actual situation, the day-ahead scheduling period with a time interval of 1 h is adopted. The baseline load curves of residential and commercial districts on a typical day in Shenzhen city are selected, as shown in Figure 5. The total load of two functional districts is distributed to each node in proportion.
The parameters of EVs are set as listed in Table 1. Users’ parameters are set as
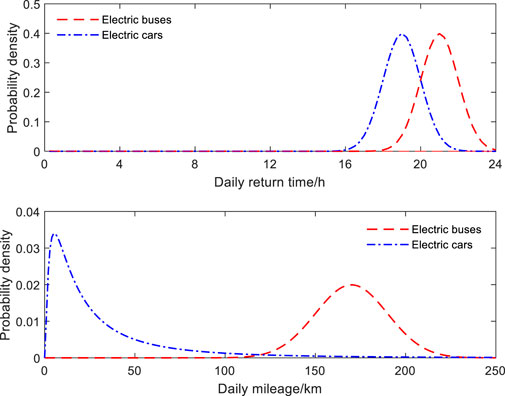
According to formula Equations 1–3 and the parameters in Table 1, the probability distributions of daily return time and daily mileage of buses and cars are shown in Figure 6.
Performance of EVs Charging Under Different Proportions
According to the probability density function of EVs’ daily return time and daily mileage, the situation of EVs connected to grid is simulated by MC simulation. It is assumed that EV starts charging immediately when it returns, until its battery is fully charged, which is a kind of disorderly charging strategy. The characteristic variables data of nb buses and nc cars are obtained by simulation, then the situations when EVs account for 25, 50, and 100% of total number of vehicles are considered respectively. The results are shown in Figure 7.
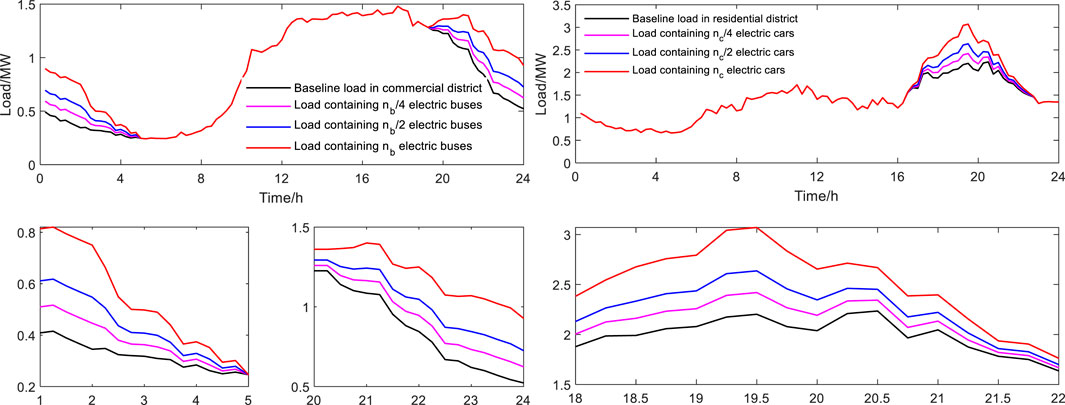
FIGURE 7. Disorderly charging load of different EVs proportions. (A) Electric buses. (B) Electric cars.
Enlarging the nonoverlapping part of curves corresponding to different proportions of EVs, it can be seen that: 1) Compared with buses, cars have a greater impact on the load of their district due to their larger number. 2) Since daily return times of buses are already in valley period of commercial district load, if buses start charging immediately when they return, their charging period will coincide with valley period, which has certain “valley filling” effect. 3) Since daily return times of cars are just close to starting time of evening peak period of residential district load, if cars do that, their charging period will coincide with evening peak period, resulting in “peak plus peak” situation.
Performance of EVs Charging Under Different Load Transfer Rates
Taking the load transfer rate as a control variable, simulations are performed on nb buses and nc cars. Since
The results are shown in Figure 8. It can be seen that: 1) The greater the load transfer rate, the smaller the peak-to-valley difference, and the more obvious the effect of peak shaving and valley filling. 2) Since buses’ charging period coincides with valley period, and cars’ charging period coincides with evening peak period, impact of changes in load transfer rate on the load in commercial district is mainly reflected in “valley filling,” while that in residential district is mainly reflected in “peak shaving."
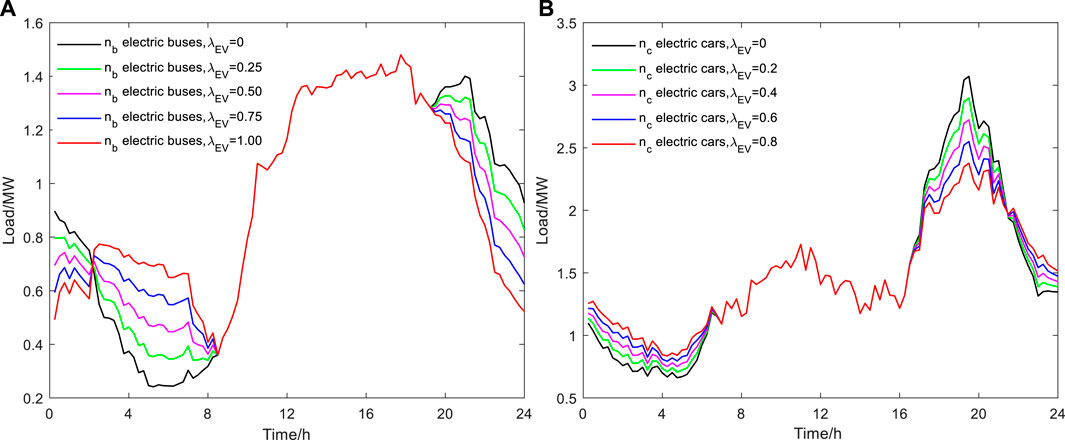
FIGURE 8. Disorderly charging load of different load transfer rates of EVs. (A) Electric buses. (B) Electric cars.
Comparison of Different Charging Strategies of EVs
The following 3 scenarios are considered:
Scenario 1: The disorderly charging strategy for EVs is adopted. EVs start charging immediately when they return.
Scenario 2: The traditional orderly charging strategy for EVs is adopted. It is assumed that EV users are completely rational. Under the influence of time-of-use price (the whole day only includes peak and valley periods), EVs start charging at the beginning of valley period.
Scenario 3: The orderly charging strategy considering consumer psychology and trip chain is adopted. It is assumed that charging time of EVs is evenly distributed in valley period through the intelligent charging control technology. The probability density function of EVs charging starting time is
where
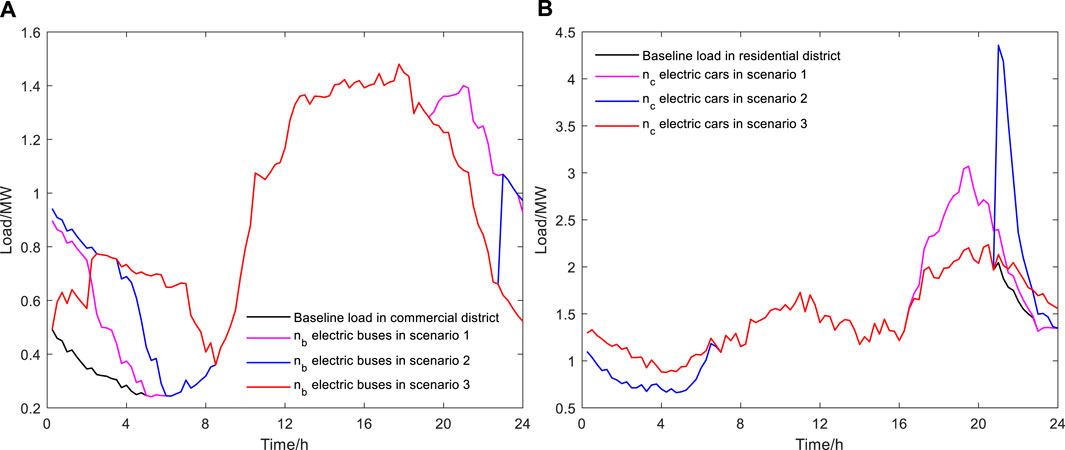
In each scenario, simulations are performed on nb buses and nc cars. The results are shown in Figure 9. It can be seen that: 1) Due to the unreasonable control of charging load in scenario 1, charging of EVs at night is mostly concentrated before 24:00, which makes load distribution at night more uneven and increases local peak-to-valley difference. 2) Compared with Scenario 1, Scenarios 2 and 3 can transfer charging load under the influence of time-of-use price. However, Scenario 2 still lacks sufficient control of charging load, so a large number of EVs are integrated into grid for charging at the same time, causing a sudden load change at the beginning of valley period. 3) Since cars have a more obvious impact on load than buses, the sudden load change is also more obvious in Scenario 2, which has reached the level of impacting grid. 4) Scenario 3 evenly distributes charging time of EVs in valley period, which makes full use of power generation potential of valley period. It has the least impact on grid without generating new load peaks, and truly realizes “valley filling.”
In each scenario, voltage of each node when nb buses and nc cars trip in the distribution network is calculated. The results are shown in Figure 10. It can be seen that: 1) Since the access of EVs will increase total load of distribution network, voltage per unit values of three scenarios are all slightly lower than that of baseline load. 2) It is generally required that safety voltage per unit value is between 0.95 and 1.05. Owing to the sudden load change at the beginning of valley period in Scenario 2, the voltage drops below the lower limit. 3) The charging process in Scenario 3 has the least impact on grid, whose voltage deviation is smaller than Scenarios 1 and 2.
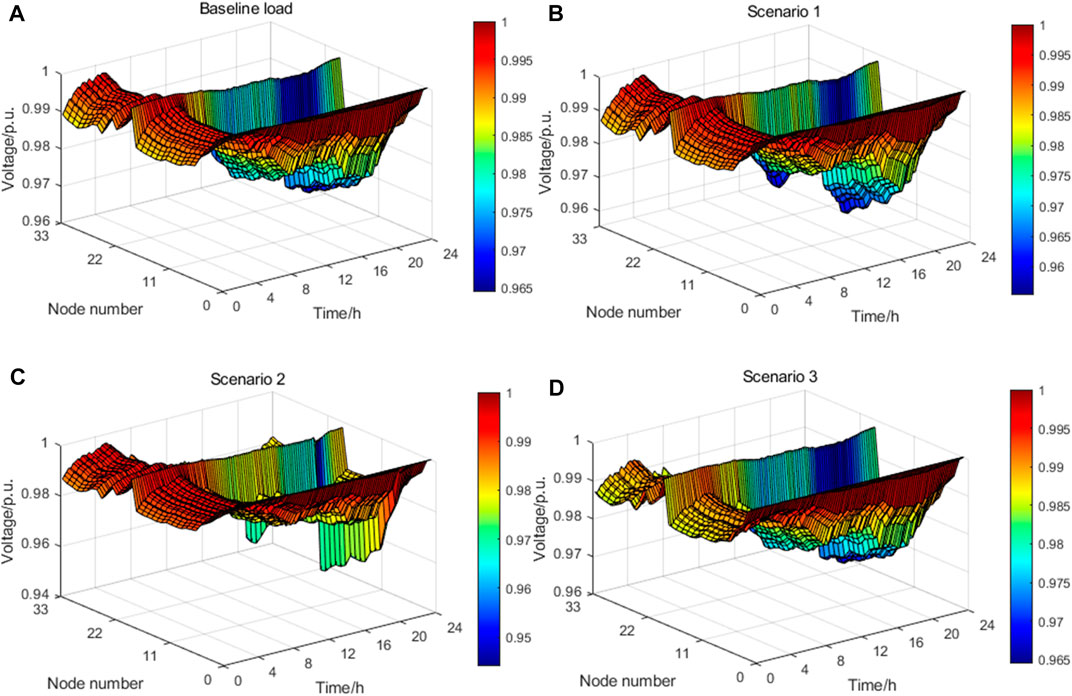
FIGURE 10. Nodal voltage surface diagram. (A) Baseline load. (B) Scenario 1. (C) Scenario 2. (D) Scenario 3.
The calculation results of total load indicators in different scenarios are shown in Table 2. It can be seen that: 1) Scenarios 1 and 2 have no obvious improvement effect on peak-to-valley difference and network loss. Even due to the sudden load change in Scenario 2, the peak-to-valley difference rate slightly increases. 2) Scenario 3, where the orderly charging strategy considering consumer psychology and trip chain is adopted, can greatly reduce peak-to-valley rate and network loss rate, and play a role in fully improving load curve.
Optimization Results of Time-of-Use Price
The function surface diagrams of peak-to-valley difference rate and network loss rate with respect to load transfer rate in residential district and commercial district are drawn respectively, as shown in Figure 11. It can be seen that: the greater the two load transfer rates, the peak-to-valley difference rate generally tends to decrease, and the network loss rate shows a slower growth trend.
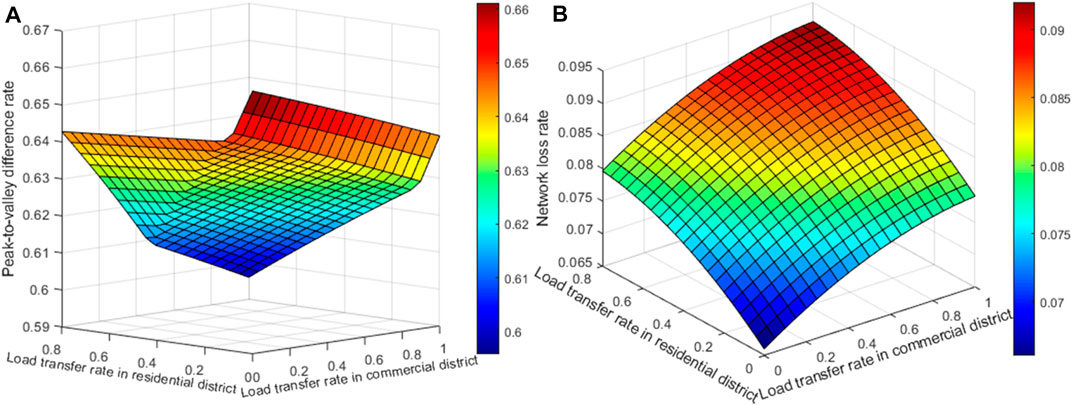
FIGURE 11. Function surface diagram of indicators. (A) Peak-to-valley difference rate. (B) Network loss rate.
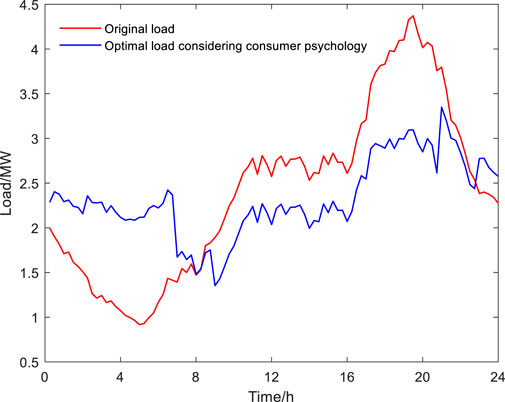
To solve the optimization problem established in Trip Chain and its Characteristic Variables, the relative MIP gap tolerance in gurobi is set to 0.01%. Considering that peak-to-valley difference rate and network loss rate are both dimensionless physical quantities, and the two have little difference in their status when measuring the qualities of load curve, so the weight coefficients of multiobjective function are selected as
It can be seen that: 1) The optimal load curve considering consumer psychology is relatively stable on the whole, showing an obvious effect of “peak shaving and valley filling.” 2) The load during peak and valley periods both have a certain amount of transfer. Moreover, EVs load transfer rate in residential and commercial district and other load transfer rate are all in linear region. In summary, by establishing the time-of-use price optimization model, EVs can be guided to charge orderly, which can reduce peak-to-valley difference and network loss, and provide a theoretical basis for system operators to determine time-of-use price.
Conclusion
Aiming at the hot issue of impact of large-scale EVs connected to grid on distribution network load, this article proposes a price-based orderly charging strategy for EVs considering both consumer psychology and trip chain. A time-of-use price optimization model based on consumer psychology is established to describe the charging behavior of EV owners influenced by electricity price. The examples are provided to compare the impact of EVs connected to grid under different ratios, different load transfer rates, and different scenarios. The conclusions are as follows:
1) The impact of disorderly charging for EVs without considering consumer psychology on distribution network is related to their daily return time. Disorderly charging of buses can achieve a certain “valley filling” effect; that of cars can result in “peak plus peak” situation.
2) When considering consumer psychology, the greater the load transfer rate, the smaller the peak-to-valley difference, and the more obvious the effect of peak shaving and valley filling. Impact of changes in load transfer rate on the load in commercial district is mainly reflected in “valley filling,” while that in residential district is mainly reflected in “peak shaving."
3) Among a variety of charging strategies, the orderly charging strategy considering consumer psychology and trip chain can greatly reduce peak-to-valley difference and network loss, and make voltage deviation smaller.
4) Time-of-use price optimization model, established based on consumer psychology and trip chain, can guide EVs to charge orderly, and provide a theoretical basis to determine time-of-use price.
In the future work, the uncertainty of renewable energy power will be considered, combined with the SOC transition probability of EVs based on Markov Chain, to further investigate impact of the SOC of EVs on distribution network load in different scenarios.
Data Availability Statement
The original contributions presented in the study are included in the article/Supplementary Material, further inquiries can be directed to the corresponding author.
Author Contributions
JG and CL proposed the methodology. JL, BG, and ZL conducted the theoretical analysis as well as the simulation verification. YC wrote the original draft which was reviewed and edited by YL and YB. All authors agree to be accountable for the content of the work.
Funding
This research was supported by the Science and Technology Project of China Southern Power Grid Corporation (Research on key technologies of flexible load participation in regional power grid dispatching in megalopolis 090000KK52190230).
Conflict of Interest
Authors JG, CL, JL, BG, and ZL were employed by the Shenzhen Power Supply Bureau Co., Ltd. The remaining authors declare that the research was conducted in the absence of any commercial or financial relationships that could be construed as a potential conflict of interest.
The authors declare that this study received funding from the Science and Technology Project of China Southern Power Grid Corporation. The funder had the following involvement with the study: provide practical application scenario for the case study.
Publisher’s Note
All claims expressed in this article are solely those of the authors and do not necessarily represent those of their affiliated organizations, or those of the publisher, the editors and the reviewers. Any product that may be evaluated in this article, or claim that may be made by its manufacturer, is not guaranteed or endorsed by the publisher.
References
Ashtari, A., Bibeau, E., Shahidinejad, S., and Molinski, T. (2012). PEV Charging Profile Prediction and Analysis Based on Vehicle Usage Data. IEEE Trans. Smart Grid. 3, 341–350. doi:10.1109/TSG.2011.2162009
Cheng, X., Hu, X., Yang, L., Husain, I., Inoue, K., Krein, P., et al. (2014). Electrified Vehicles and the Smart Grid: the ITS Perspective. IEEE Trans. Intell. Transport. Syst. 15, 1388–1404. doi:10.1109/TITS.2014.2332472
Clement-Nyns, K., Haesen, E., and Driesen, J. (2010). The Impact of Charging Plug-In Hybrid Electric Vehicles on a Residential Distribution Grid. IEEE Trans. Power Syst. 25, 371–380. doi:10.1109/TPWRS.2009.2036481
Dagdougui, Y., Ouammi, A., and Benchrifa, R. (2020). High Level Controller-Based Energy Management for a Smart Building Integrated Microgrid with Electric Vehicle. Front. Energ. Res. 8, 248. doi:10.3389/FENRG.2020.535535
Franco, J. F., Rider, M. J., and Romero, R. (2015). A Mixed-Integer Linear Programming Model for the Electric Vehicle Charging Coordination Problem in Unbalanced Electrical Distribution Systems. IEEE Trans. Smart Grid. 6, 2200–2210. doi:10.1109/TSG.2015.2394489
Guo, Q., Xin, S., Sun, H., Li, Z., and Zhang, B. (2014). Rapid-Charging Navigation of Electric Vehicles Based on Real-Time Power Systems and Traffic Data. IEEE Trans. Smart Grid. 5, 1969–1979. doi:10.1109/TSG.2014.2309961
Heinisch, V., Göransson, L., Erlandsson, R., Hodel, H., Johnsson, F., and Odenberger, M. (2021). Smart Electric Vehicle Charging Strategies for Sectoral Coupling in a City Energy System. Appl. Energ. 288, 116640. doi:10.1016/j.apenergy.2021.116640
Li, G., and Zhang, X.-P. (2012). Modeling of Plug-in Hybrid Electric Vehicle Charging Demand in Probabilistic Power Flow Calculations. IEEE Trans. Smart Grid. 3, 492–499. doi:10.1109/TSG.2011.2172643
Liu, H., Hu, Z., Song, Y., and Lin, J. (2013). Decentralized Vehicle-to-Grid Control for Primary Frequency Regulation Considering Charging Demands. IEEE Trans. Power Syst. 28, 3480–3489. doi:10.1109/TPWRS.2013.2252029
Muratori, M. (2018). Impact of Uncoordinated Plug-in Electric Vehicle Charging on Residential Power Demand. Nat. Energ. 3, 193–201. doi:10.1038/s41560-017-0074-z
Rautiainen, A., Repo, S., Jarventausta, P., Mutanen, A., Vuorilehto, K., and Jalkanen, K. (2012). Statistical Charging Load Modeling of PHEVs in Electricity Distribution Networks Using National Travel Survey Data. IEEE Trans. Smart Grid. 3, 1650–1659. doi:10.1109/TSG.2012.2206411
Shafie-khah, M., Heydarian-Forushani, E., Osório, G. J., Gil, F. A. S., Aghaei, J., Barani, M., et al. (2016). Optimal Behavior of Electric Vehicle Parking Lots as Demand Response Aggregation Agents. IEEE Trans. Smart Grid. 7, 2654–2665. doi:10.1109/TSG.2015.2496796
Sun, Q., Xu, S., and Zhu, S. (2020). Distribution Network Planning Considering DG Timing Characteristics and EV Spatiotemporal Characteristics. Electric Power Automation Equipment. 40, 30–38. doi:10.16081/j.epae.202008010
Tang, D., and Wang, P. (2015). Probabilistic Modeling of Nodal Charging Demand Based on Spatial-Temporal Dynamics of Moving Electric Vehicles. IEEE Trans. Smart Grid. 7, 1. doi:10.1109/TSG.2015.2437415
Tang, D., and Wang, P. (2016). Nodal Impact Assessment and Alleviation of Moving Electric Vehicle Loads: From Traffic Flow to Power Flow. IEEE Trans. Power Syst. 31, 4231–4242. doi:10.1109/TPWRS.2015.2495254
Xing, H., Fu, M., Lin, Z., and Mou, Y. (2016). Decentralized Optimal Scheduling for Charging and Discharging of Plug-in Electric Vehicles in Smart Grids. IEEE Trans. Power Syst. 31, 4118–4127. doi:10.1109/TPWRS.2015.2507179
Xing, Q., Cheng, M., Liu, S., Xiang, Q., Xie, H., and Chen, T. (2021). Multi-Objective Optimization and Dispatch of Distributed Energy Resources for Renewable Power Utilization Considering Time-Of-Use Tariff. Front. Energ. Res. 9, 68. doi:10.3389/FENRG.2021.647199
Keywords: electrical vehicles, consumer psychology, trip chain, time-of-use price, peak shaving and valley filling
Citation: Gou J, Lin C, Li J, Geng B, Li Z, Cao Y, Li Y and Bao Y (2021) Charging Strategy for Electric Vehicles Considering Consumer Psychology and Trip Chain. Front. Energy Res. 9:723370. doi: 10.3389/fenrg.2021.723370
Received: 10 June 2021; Accepted: 19 July 2021;
Published: 18 August 2021.
Edited by:
Yingjun Wu, Hohai University, ChinaReviewed by:
Lei Xi, China Three Gorges University, ChinaFu Rong, Nanjing University of Posts and Telecommunications, China
Copyright © 2021 Gou, Lin, Li, Geng, Li, Cao, Li and Bao. This is an open-access article distributed under the terms of the Creative Commons Attribution License (CC BY). The use, distribution or reproduction in other forums is permitted, provided the original author(s) and the copyright owner(s) are credited and that the original publication in this journal is cited, in accordance with accepted academic practice. No use, distribution or reproduction is permitted which does not comply with these terms.
*Correspondence: Yang Cao, MjIwMTkyNzc5QHNldS5lZHUuY24=
 Jiwei Gou1
 Yang Cao