 Joshua Güsewell
 Katharina Scherzinger2
94% of researchers rate our articles as excellent or good
Learn more about the work of our research integrity team to safeguard the quality of each article we publish.
Find out more
ORIGINAL RESEARCH article
Front. Energy Res. , 03 November 2021
Sec. Bioenergy and Biofuels
Volume 9 - 2021 | https://doi.org/10.3389/fenrg.2021.719697
For the existing biogas plants (BGP) in Germany, the period of the public support scheme begins to end in 2021. From a technical point of view, essential components have an operational life span of more than 20 years and allow for an extended operation. However, a profitable extension would require suitable follow-up concepts and depends on the underlying plant-specific setup, the regional conditions, as well as the regulatory and economic framework. Based on an expert evaluation, four promising follow-up concepts were identified in a multistage process consisting of expert interviews, workshops, and an online survey. These follow-up concepts are “Basic flexibilization,” “Substrate change,” “Seasonal flexibilization,” and “Biomethane upgrading.” They were assessed with a plant-specific biogas repowering model for a heterogeneous data set of 2,508 BGPs and were compared in three scenario frameworks to derive robust development paths. To capture the heterogeneity of the existing BGPs in Germany, the model was developed further regarding regional parameters such as power output, substrate mix, and emission factors. Across all the scenarios, “Seasonal flexibilization” proves to be the most promising follow-up concept for more than 50% of the BGPs. This is followed by “Substrate change,” which is particularly suitable for larger BGPs with high shares of energy crops and no heat utilization. Biomethane upgrading is usually the second choice compared to participation in extended public support schemes for electricity production. However, it is the only concept that is profitable under current market conditions due to the high CO2-quota prices in the German fuel sector. The development pathways also show a significant potential to increase the net GHG reduction, which on BPG average can be nearly doubled. Our approach shows that the interplay of the heterogeneous BGP structure, the applied economic decision variable, and the nonuniform framework conditions in different energy markets is of crucial importance when assessing similar biogas markets, identifying robust follow-up pathways, or designing framework policies.
In the early 2020s, the first generation of renewable energy plants in Germany reaches the end of their 20 years’ support period by the German Renewable Energy Sources Act (EEG). At the same time, the German electricity system is in a crucial phase of its energy transition. Conventional, dispatchable capacities such as nuclear and coal power plants are phased out or starting to be phased out. The share of renewable electricity is targeted to rise from 38 to 65% in 2030% (CDU, CSU, and SPD, 2018). Of this electricity, 14%, equivalent to 31.46 GWhel, is produced in biogas plants (BGPs) including the biomethane conversion pathway. The majority of these BGPs were built in the agricultural sector (Daniel-Gromke et al., 2018).
The biogas sector is growing in the European Union (EU) as well as worldwide. Yet, unlike Germany, most countries in the EU are less dominated by agricultural BGPs. The examples of Sweden and Norway, with a focus on biomethane production for fuel use, also show that the end-use energy sector can differ considerably (Scarlat et al., 2018). Regarding the future role of biogas, further growth is projected. The International Energy Agency’s outlook on biogas and biomethane predicts that global demand for direct use of biogas is to double or quadruple, depending on the underlying scenario (IEA, 2020). In comparison with carbon capture and storage bioenergy also plays a vital role in many scenario pathways toward limiting global warming at 1.5°C (IPCC, 2018).
Sorda et al. (2013) found that the German framework conditions in place at the time offer considerable economic potential for BGP expansion and overly favor smaller BGPs, even though larger plants and resource-sharing cooperations would be more efficient. Similarly, Balussou et al. (2018) conclude a shift toward new small manure and biowaste BGPs under the frameworks of the EEG 2012 and 2014 and that the majority of the existing BGPs would switch to a flexible operation. An extended operation period after 20 years is not regarded in either study, although that would be possible for many BGPs from a technical point of view. Unlike photovoltaic and wind power plants, electricity from biogas causes high fuel costs, primarily due to substrate provision and production. This makes a cost-covering operation hardly feasible under current market conditions without public support schemes. Outside Germany, BGPs are usually operated under some kind of support scheme as well (Banja et al., 2019). Likewise, similar issues will arise when support schemes change or expire at a certain point.
To address this issue, an extended support period of 10 additional years for existing bioenergy power plants was introduced in the EEG 2017 (Deutscher Bundestag, 2016). However, remuneration rates are considerably lower than before, require participation in a bidding process, and thereby increase economic pressure (Güsewell et al., 2019). In addition, new regulatory demands and amendment in the framework requirements, such as the flexibilization in the electricity sector (Szarka et al., 2013) or further digestate storage of the German fertilizer ordinance (BMEL, 2017), continuously induce necessary adaptions. The additional costs are usually offset by little or no revenues and thus increase the economic pressure. Further pressure is exerted by societal demands and the ecological impact of BGPs. In Germany, BGPs are characterized by a high share of energy crops (Daniel-Gromke et al., 2018), which are associated with negative ecological impacts compared to the use of manure, residues, or organic waste streams (O'Keeffe et al., 2019).
In consideration of changing framework conditions and ongoing new requirements, one can conclude the biogas and bioenergy sector in Germany is entering an important transition phase, also called the “Post-EEG” period. Besides, there are currently different incentives and mechanisms in the energy sectors. While in the electricity sector there is technology-specific constant remuneration in addition to the EU emissions trading system, there is a technology open and volatile market base GHG quota in the fuel sector. In the heat sector, climate protection efforts are comparatively low1. Expanding the perspective to the EU or the world the picture on the framework conditions becomes even more diverse. With the background of a necessary ambitious climate policy (Howard and Sylvan, 2021) more framework changes in the near future are likely.
Therefore, BGPs need new concepts to prove themselves robustly in these uncertain and complex conditions and extend their operation either within or even beyond a new support framework. Gökgöz et al. analyzed and compared such concepts for a single BGP and concluded that local sales and distribution of biomethane as a compressed natural gas substitute in combination with a flexible operated CHP unit can be a profitable concept for the future. However, when analyzing so-called follow-up concepts, the strong regional differences due to the underlying agricultural structure must be considered. These differences can be found, for example, in the size of the plant, the substrate mixture, or prices and have led to the very heterogeneous structure of the BGPs in Germany today. Accordingly, the BGPs in Matschoss et al. (2019) are grouped into five different categories regarding the regional substrate mix.
Against this background, the questions arise of how many existing BGPs can extend their operation and how much dispatchable renewable capacity can contribute to the power system, but also how the interplay of different follow-up concepts, the heterogeneous structure of the BGPs, and changing and nonuniform framework conditions might affect this development. Therefore, the goals of this study are:
1) Identify promising and select suitable follow-up concepts to extend the operation period of the existing BGPs.
2) Analyze and assess the technical, ecological, and economic effects of selected follow-up concepts regarding the heterogeneous structure of BPGs by the example of three distinct German regions.
3) Define reference BGPs representing the heterogeneous structure and identify beneficial parameters for a successful extension of operation regarding the BGPs characteristics and framework conditions.
4) Determine the optimal and robust follow-up concepts and the associated development paths for the existing BGPs in these regions under different scenario frameworks including a simulation of the EEG bidding process and the possible decommissioning.
To achieve these goals, a methodical approach consisting of an expert evaluation (Identifying Promising Follow-Up Concepts) and an analysis with an established biogas repowering assessment model was chosen. Several model adaptions had to be made to adequately model the follow-up concepts and the heterogeneous structure of the BGPs (Model Analysis and Regional Adaptations). Furthermore, reference BGPs representing this heterogeneous structure were defined (Reference BGPs Representing the Existing Heterogeneous Structure). The follow-up concepts were evaluated with key performance indicators (KPI) like the differential amount required for a cost-covering operation, which has to be balanced by public funds or newly established markets for ecological services (Assessment with Key Performance Indicators). Finally, three scenario frameworks were formulated to determine robust follow-up concepts (Scenario Frameworks to Determine Development Pathways). Scenario parameters include the design of the extended EEG support scheme, energy market prices, as well as technical progress of biogas technologies.
The expert evaluation consisted of a multistage interview and survey process to select a manageable number of follow-up concepts. After a project-internal identification and evaluation of possible follow-up concepts, experts from different sectors of the biogas industry were interviewed in a guideline-based way. Based on the results of the interviews, a standardized online survey (n = 40) was carried out and included the query on the following concepts (concepts selected for detailed modeling assessment are highlighted in bold):
• Flexibilization of combined heat and power (CHP) use on-site
o Nationwide marketing of electricity (Flex Base)
o Regional marketing of electricity
o Future system services in the electricity sector
• Substrate Change
o Alternative energy crops
o Agricultural residues and manure
• Heat utilization
o Seasonal flexibilization (Seasonal Flex)
o Direct heat use in a gas boiler
• Biomethane upgrading
o Upgrading and grid injection (Biomethane)
o Upgrading and local fuel supply in the transport sector
o Pooling of BGPs via microgrids with central upgrading
• Digestate processing
Each concept had to be assessed with five evaluation criteria such as economic success or impact on biodiversity. Each criterion was also weighed regarding its importance for an extended operation. For a comparison of the follow-up concepts, an overall index was calculated. This index combines the weighting of the evaluation criteria with the concept-specific evaluation (see Supplementary Table S9 for the results).
According to this overall index, the follow-up concept of “Substrate Change” was assessed as very positive and relevant (index of 0.49). Therefore, it was prioritized for modeling. In addition, the concept with the second-best index, “Seasonal Flex,” was further investigated in the model. The nationwide marketing received the lowest index value (0.38). However, because it is a concept that is already widely implemented in Germany, it was analyzed as the reference base (Flex Base). Besides, biomethane upgrading and the subsequent injection into the natural gas grid (Biomethane) is chosen because the option of producing a different product for various markets makes a concept comparison interesting. Even though the overall index of this concept was assessed lower compared to the other biomethane upgrading concepts such as local fuel supply in the transport sector, grid injection of biomethane is currently the most common concept.
The model analysis was conducted using an established biogas repowering assessment model for the existing BGPs implemented in Matlab (see Güsewell et al. (2019) for more details on the general model and Güsewell et al. (2021) for more details on the CHP dispatch optimization). Figure 1 gives a graphical overview of the model. Major regression functions for different BGPs components are given in the supplementary materials. Regional data based on monitoring studies and surveys were integrated into the model to include the existing BGPs of the German federal states of Baden-Wuerttemberg (BW), Thuringia (TH), and Lower Saxony (Niedersachsen, NI) (Implementing Regional Heterogeneity). Another model focus was on additional input data such as the calculation of regional greenhouse gas (GHG) emissions factors for alternative substrates like the cup plant (Silphium perfoliatum L.) (Greenhouse Gas Emission Factors of Substrate Provision). Further adaption had to be made to incorporate the follow-up concepts (The Selected Follow-Up Concepts and Their Core Design).
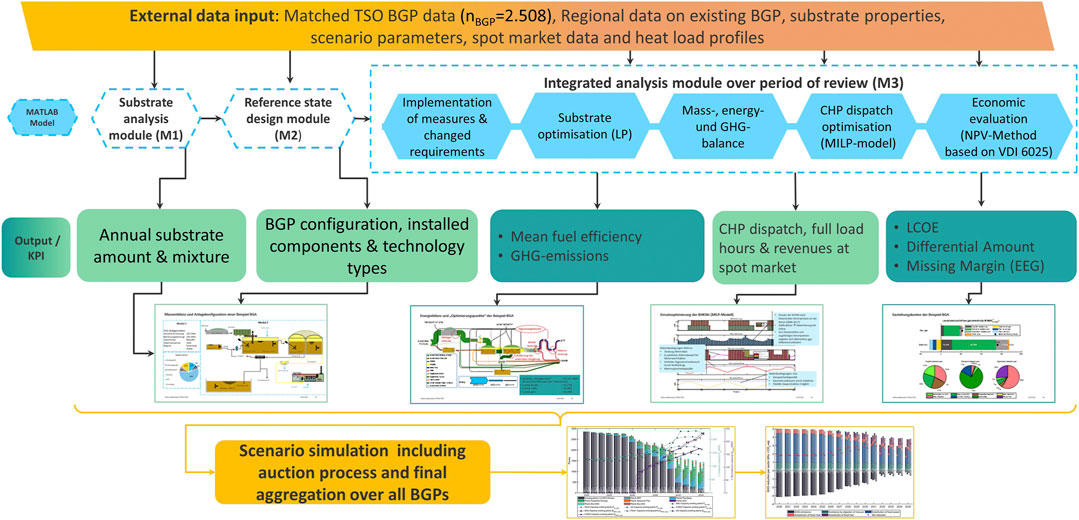
FIGURE 1. Overview of the plant-specific model for existing biogas plants; BGP, Biogas plants; MILP/LP, Mixed-integer linear programming; CHP, combined heat and power; GHG, Greenhouse gas; NPV, Net present value; LCOE, Levelized cost of energy/electricity.
As described above, four final follow-up concepts were selected for the model analysis. The configuration details of these concepts are listed in Table 1. It was assumed that each implementation of the on-site CHP concepts intends to participate in the extension period of the EEG. To do so, participation in the bidding process is required and the requirements of the EEG, like a minimal power quotient (PQ)2 of two, must be met. Consequently, flexible electricity production in line with the demand is pursued. Electricity revenues are based on the nationwide marketing at the German day-ahead auction. The dispatch optimization was done using the historical data for the years 2008–2019 (Open Power System Data, 2020). The concepts “Substrate Change” and “Seasonal Flex” are thus a combination of nationwide marketing and their specific concept idea. For example, in the “Substrate Change” concept, conventional energy crops such as maize silage are replaced with alternative crops such as Cup plant, wheat, and maize straw. The aim is to reduce the GHG impact while maintaining the rated power output. The newly established emission factors of Supplementary Table S11 are used for the alternative substrates. It was assumed that the necessary substrates are available at each site. The goal of “Seasonal Flex” is a higher heat utilization rate because seasonal heat demand often limits full heat utilization with year-round gas and heat production. In contrast, the gas production of “Seasonal Flex” follows the average heat demand of each month, e.g., in winter months, the production is higher than the yearly average. The yearly rated power output is also reduced to be in line with the applied synthetic heat demand profile for a generic residential area. More details of the seasonal flexibilization and the comparison of different operation modes are given in Güsewell et al. (2021). For the “Biomethane” concept, there are no changes in rated power and gas production. The CHP unit is replaced with a membrane-upgrading unit. The process electricity and heat demand must be supplied by the grid and a heat boiler, respectively. The biomethane is marketed as a fuel in the transport sector.
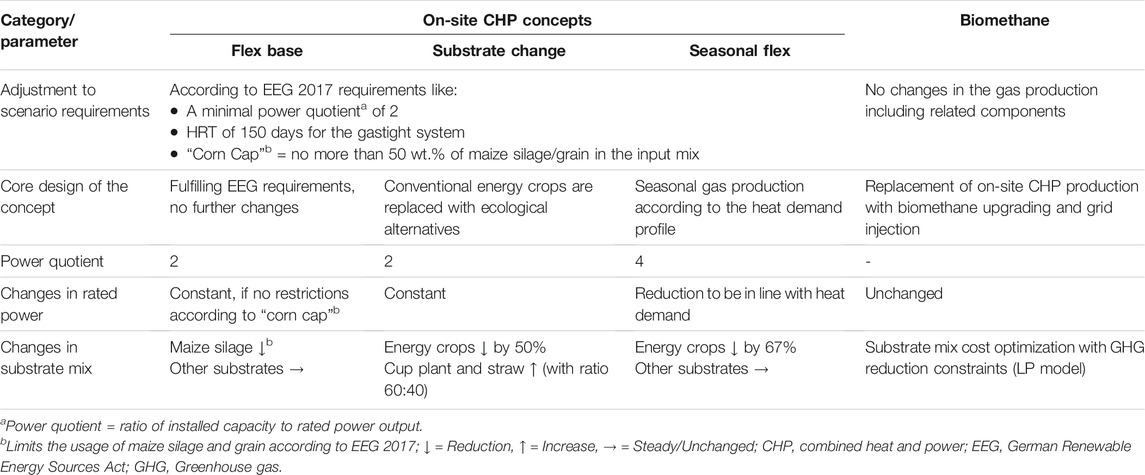
TABLE 1. Core design, adjustments, and impacts on power output and substrate mix of the four selected follow-up concepts.
In the substrate analysis module (see Figure 1), plausible data from 2,508 BGPs were used. The data are derived from the matched and merged EEG plant master and transaction data released by the German transmission system operators (TSOs) (ÜNB, 2019). Table 2 shows an overview of the main input data in the three states and provides an insight into regional variations regarding parameters such as installed capacity. In addition, Figure 2 shows the regional distribution rated power output (A) and the average substrate mix (B)/(C). E.g., the plants in TH are rather big with an average installed capacity of 0.53 MWel and often make use of the available heat. They also have the highest share of manure in their substrate mix, yet the manure amount is the lowest in absolute terms, as there are comparable few BGPs in TH.
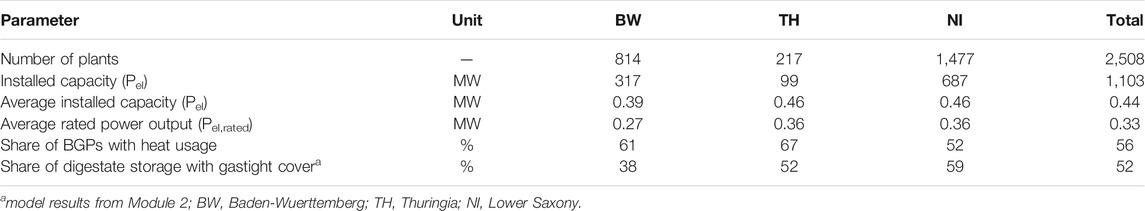
TABLE 2. Main model input data derived from the transmission system operators data for the year 2018.
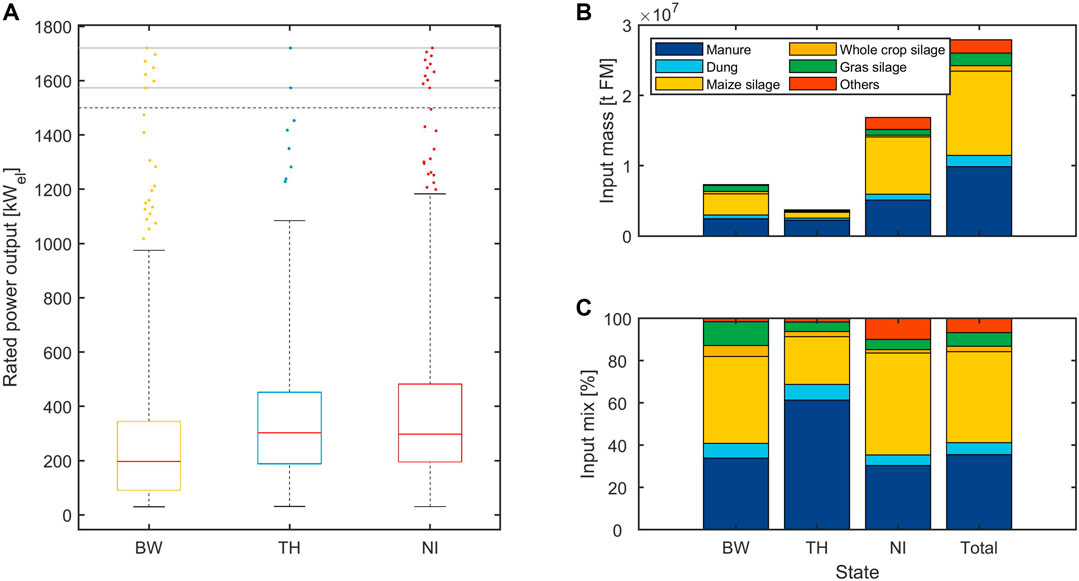
FIGURE 2. Regional distribution of rated power output (A) and average substrate mix in the states of BW, TH, and NI in absolute (B) and relative (C) terms (based on Härdtlein et al. (2013), Reinhold (2015), TLL (2015), Reinhold (2017), Matschoss et al. (2019)); BW, Baden-Wuerttemberg; TH, Thuringia; NI, Lower Saxony.
Next to the main input derived from the TSO data, the following parameters are differentiated according to their regional allocation (data derived: Schmehl et al., 2012; Härdtlein et al., 2013; Reinhold, 2015; TLL, 2015; 3N, 2017; Reinhold, 2017). For the model Modules 1 and 2 (M1, M2 in Figure 1) these parameters include inter alia the engine type (spark-ignited or ignition oil) and the number of CHP units, the process type (single- or two-staged), the average substrate mix, as well as types of digesters and digestate storage. For Module 3 (M3) they further include the average net heat usage rates, manure area potential, substrate area yields, and price as well as average plant-field distances. Details of the technical data are shown in S 1 to 5 and for the substrate data in S 11. Unavailable regional data were replaced with Germany-wide data, e.g., for engine types in NI.
As the regional data were not available on the same consistent basis, new classifications had to be implemented. While for BGPs in BW these classifications were based on the size of the BGP, for the BGPs in TH and NI they had to be changed to a classification based on the regional district. Next to different classification methods, different calculation methods had to be used. For example, the HRT used for the design of the net digestion volumes was calculated according to average values of the size class for BW (see Supplementary Table S3), Eq. 1 for TH (Reinhold, 2015), and depending on the manure share and the process type for NI (Liebetrau et al., 2011) (also see Supplementary Table S4).
with Xmanure being the weight share of the manure substrates in the substrate mix.
Additionally, it was assumed that 13% of the digestate storage tanks in TH are lagoons that cannot be covered gastight (Reinhold, 2017). Also, there were no region-specific data available for the agitator and feed technology in TH and NI. Hence, the type of technology and daily electric consumption were assumed based on the data of BW.
GHG emissions of energy crops and other biogas substrates play a major role in overall GHG balance and specific GHG emissions of biogas or electricity from biogas. Regional conditions also have an impact on these emissions (Dressler et al., 2012). Therefore, GHG emissions factors were determined for the regions of BW, NI, and TH. The emission balance was calculated based on the life cycle assessment (LCA) approach of DIN EN ISO 14040 and 14044 (DIN, 2006; ISO, 2006) using the LCA software Umberto and Matlab. The specific calculations are based on similar studies such as in Pucker et al. (2010), Schmehl et al. (2012), Bacenetti et al. (2013), and Jacobs et al. (2017). Many basics are also based on Rösemann et al. (2019).
First, all emission sources of the substrate cultivation were identified, these are shown in Figure 3. The input for the substrate cultivation process is shown in green on the left and the resulting emissions are shown in red on the right. The production and use of seeds, fuels, pesticides, and mineral fertilizers are sources for emissions of CO2 or N2O. Each emission type was converted into CO2 equivalents using corresponding factors (IPCC, 2013). The functional unit is one ton of fresh mass.
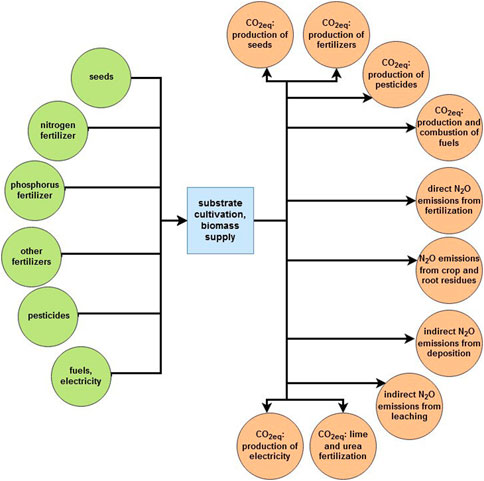
FIGURE 3. Emission sources of substrate cultivation and biomass supply.
Second, the emissions balance requires the yields of the substrates, demand of fertilizers and used fertilizers, pesticides demand, fuel demand (based on field size, mechanization of machines, and farm-to-field distance), seed quantity, crop and root residues, nutrient composition of the substrates (N, P, K), fertilizer application techniques, and Nitrogen ground reserves. Many of these parameters are distinguished regionally, e.g., the average field size is 2, 5, and 20 ha for BW, NI, and TH, respectively, and are substrate specific such as the mechanization degree. Different emission factors based on literature data were used for the identified emission sources (KTBL, 2013; Roth et al., 2013; KTBL, 2014; Effenberger et al., 2016; UBA, 2016; Wernet et al., 2016; EEA, 2019; Rösemann et al., 2019; LWK; Niedersachsen, 2021).
For the substrates listed in Supplementary Table S11, the emissions balance results in the stated CO2 equivalents per ton of fresh mass. The main differences between the regions result from different yields, impact sizes, and the associated fuel requirements, as well as the different nitrogen reserves (N-Min) in the ground. Negative emissions result for all manure-type substrates, as the use of these substrates in BGPs avoids emissions compared to conventional open storage. For manure-type substrates, no differences in the federal states are assumed.
A twofold approach was followed to enable a structured comparison of results at the individual plant level. First, a clustering was carried out in which different characteristic parameters describing the initial setup of the BGPs are defined (Table 3). The goal of clustering is to reduce the computational time of the dispatch optimization and establish which clusters predominate in the database used (see The Selected Follow-Up Concepts and Their Core Design). The combination of different classes for the characteristic parameters of Table 3 leads to a theoretical number of 90 (=5x3x3x2) clusters. However, only 80 of these clusters showed one or more BGP, with an average of 31 BGPs across all the clusters. From each of these 80 clusters, a maximum of three BGPs was chosen for the detailed dispatch optimization. The results of these three BGPs were then assigned to all other BGPs in the same cluster. This is possible because key influencing parameters of dispatch optimization such as the plant size, substrate mix (influences e.g., the internal heat demand), and external heat demand (restricting the optimization) are similar within a cluster.
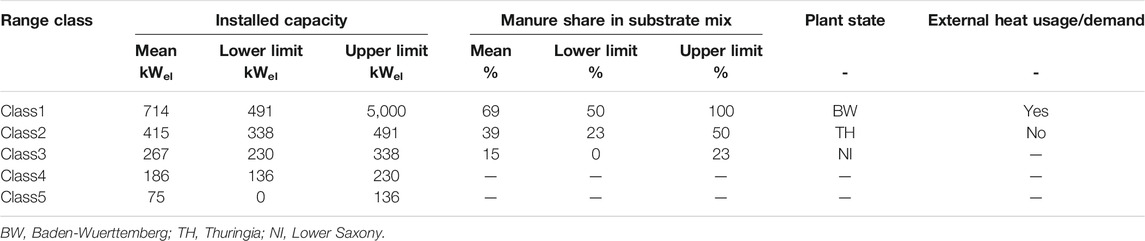
TABLE 3. Characteristic parameter and range classes to determine representative plant clusters.
Second, six major clusters were normatively selected from the 80 clusters, to define reference BGPs for a detailed comparison of the results of fundamentally different BGPs. The goal of this selection was to maintain a high parameter variance while reducing the clusters to a manageable number and representing a large share of the database. Besides the parameters of Table 3, the type of digestate cover was added to characterize the reference BGP, as this can have a considerable impact on the operation of the extended period. For each of the six clusters, a single BPG was chosen to specify the parameters (Table 4). In total, 23% of the BGPs in the data set are represented by these six clusters and 17.22% if the digestate cover is included as an additional assignment parameter.
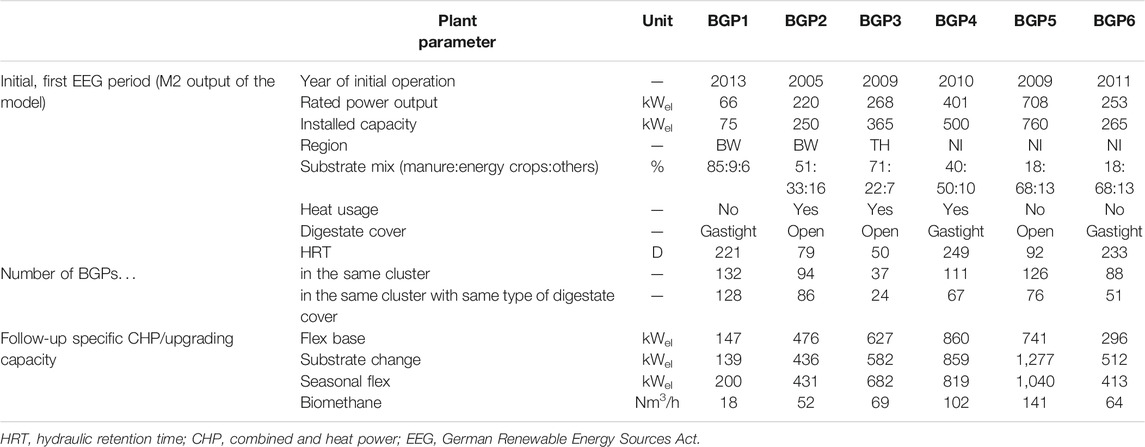
TABLE 4. Main parameters of the reference biogas plants (BGPs) determined for the initial, first EEG period and the follow-up concepts in the REF scenario.
To assess the follow-up concepts regarding technical, ecological, and economic aspects, KPIs were defined and evaluated (Table 5). Next to the levelized cost of electricity (LCOE), the missing margin, the differential amount, and the normalized net present value (NPV) were used for the economic evaluation. The missing margin is the amount needed for cost-covering operation when participating in the EEG bidding process and includes additional revenues such as the flex bonus, a measure to incentivize flexibilization within the EEG support scheme. In comparison, the differential amount only considers market revenues and presents the amount needed for cost-covering operations outside the EEG system. The normalized NPV is used as the criterion to determine which follow-up concept is implemented in the development paths of the scenario analysis. The mean fuel efficiency and GHG emissions are the technical and ecological KPI, respectively.
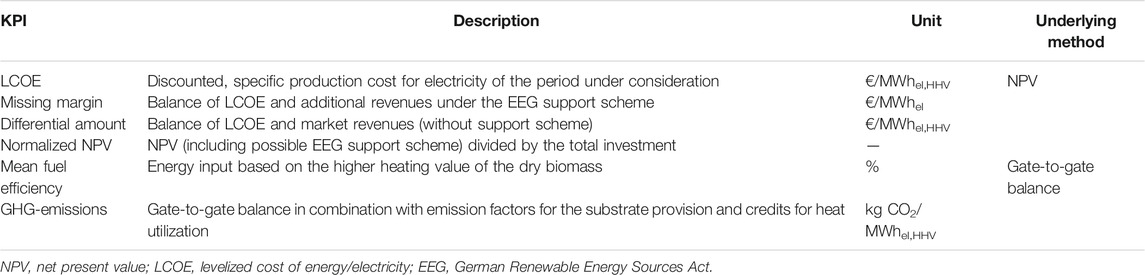
TABLE 5. Key performance indicators (KPI) for the assessment of follow-up concepts and extended operation of biogas plants.
For the scenario analysis, three frameworks were formulated to analyze essential exogenous parameters for the comparison of the follow-up concepts and the possible development pathways of the BGP in the three regions until 2035. Table 6 provides an overview of these parameters, which can be categorized as EEG requirements, technical adaptations and progress, and economic development. The frameworks only differ for the EEG requirements and the economic development. For the economic parameters, time-series taken from various system studies were used (see Supplementary Table S10). Technical adjustments and the development of CHP and biomethane upgrading technologies are the same in all the scenarios. Parameters such as the growth rate for the electric efficiency of new CHP units are given because they can have a big impact on the profitability of BGPs (Güsewell et al., 2019). The first scenario called “EEG 2017 extension” is the scenario reference (REF). Here, the requirements of the EEG 2017 are implemented, and it is assumed that no further changes will take place. These requirements include the so-called corn cap limiting the use of maize silage and grains, the maximum bid limit, the mandatory HRT in the gastight system, and a minimum PQ for flexible operation. In contrast to the EEG 2017 auction volumes do not end in 2022 but continue with the same volumes (see Supplementary Table S10). Regarding economic development, no increase in the market value of flexible power production from biogas is estimated. The market value is therefore only based on the dispatch optimization of the historical data. Additional revenues from the intraday market and provision of balancing power are also assumed. In the transport sector, high GHG-emission reduction goals equal high CO2 prices. The revenues for biomethane, therefore, consist of the energy sales for the gas plus the GHG-quota prices.
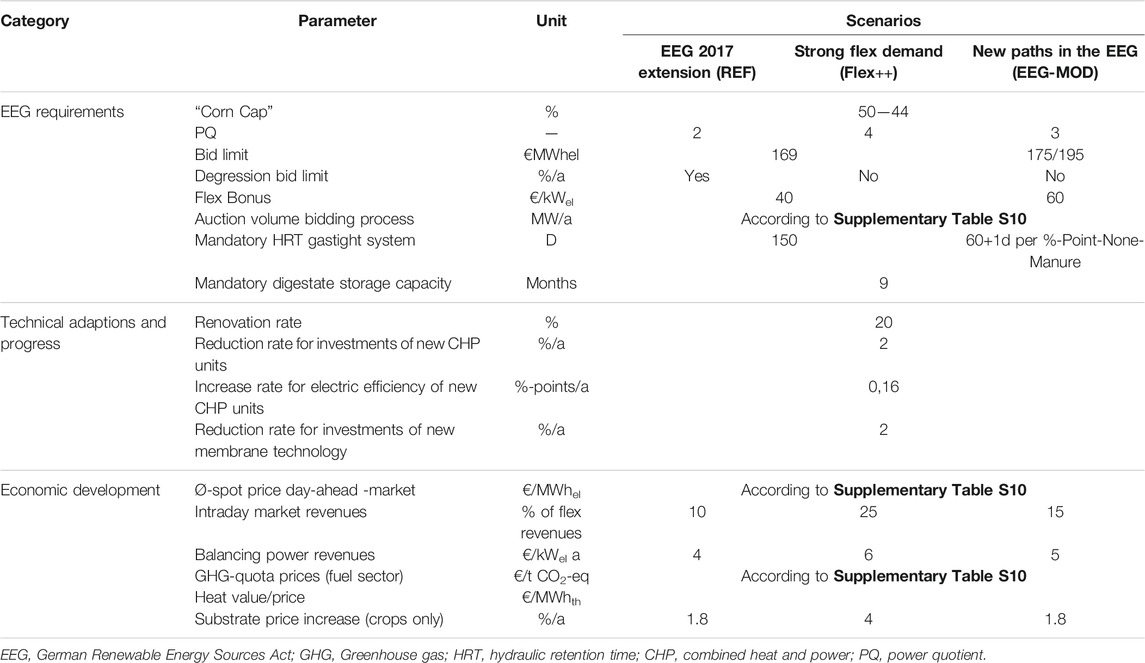
TABLE 6. Scenario framework parameters.
In the scenario “Strong flex demand” (Flex++), it is assumed that the demand for flexibility in the power system increases strongly due to a rapid expansion of volatile renewables in combination with a generally strong climate policy. This leads to a higher mandatory PQ of four. Also, there is an increase in market value, flexibility revenues, and higher CO2 prices up to 300 €/t CO2.
In the scenario “New paths in the EEG” (EEG-MOD), a possible EEG reform is played out. The most important requirements here are a modified minimum hydraulic retention time and a higher maximum bid limit for small BGPs below 200 kWel rated power. Besides, a minimum GHG emission reduction concerning the recast Renewable Electricity Directive (RED II) is introduced for BGPs participating in the EEG. The reduction must be at least 70% to the reference value of 659 g/kWhel.
For simplicity, no changes to the original state of the BGP within the first EEG support period are assumed. Also, the development paths do not regard new BGP installations. The bidding process of the EEG 2017 is also strongly simplified and explained below:
• The bidding auction volume, which applies to all bioenergy plants throughout Germany, is allocated according to the current capacity of the BGPs in the three regions under observation. Approximately 65% of bioenergy capacity comes from BGPs and 30% of them are located in BW, TH, and NI.
• Each BGP can only bid once. It always bids with the lowest missing margin of the three on-site CHP concepts if the missing margin lies below the bid limit and, in the case of the EEG-MOD scenario, below the minimum GHG reduction.
• Each BGP submits its bid 3 years before the start of the extended operation period. BGPs compete against each other in a uniform pricing model until the auction volume of the respective year is used up.
• “Leftover” volumes are transferred to the next bidding year.
After simulating the bidding process for each year, the NPV is calculated for each concept and BGP. For BGPs within the auction volumes, the income is based on the uniform price derived in the corresponding year, again only for on-site CHP concepts. If all NPVs are lower than zero, the BGP will be decommissioned after its original 20 years’ operation period. If there is more than one concept with a positive NPV, the concept with the highest normalized NPV will be implemented (for a flow chart of the general approach also see Supplementary Figure S1).
The plant-specific results are shown for the reference BGPs. The aggregated results are either grouped according to the region or the successful follow-up concept.
Table 7 shows the specific effects of the follow-up concepts on BGP4 in the REF scenario. Since BGP4 is affected by the corn cap (see Table 1), the substrate mix also slightly changes in the concept “Flex Base.” Despite a lower absolute substrate input, the rated power output increases due to efficiency gains by the bigger and newer CHP unit. In the concept “Seasonal Flex,” the substrate input is strongly reduced, the rated output halved, and the average HRT increases to over 300 days. Owing to the higher PQ, the installed capacity is in the range of the other CHP concepts, which lies between 800 and 900 kWel (for the other reference BGP compare Table 4). The upgrading capacity of the “Biomethane” concept is 102 Nm3/h, which is significantly below the current average of 623 Nm3/h of upgrading plants in German (Völler and Reinholz, 2019). While the lowest LCOE for the CHP concepts can be achieved by “Flex Base,” the missing margin is the lowest for “Seasonal Flex.” Higher heat utilization rates and specific heat revenues are the main drivers. The LCOE of biomethane is 90.7 €/MWhHHV, which is comparatively low for a plant of this size (Billig, 2016). “Biomethane” is also the only concept being close to profitability under “pure” market conditions (see differential amount). Still, 18.8 €/MWhHHV has to come from other income sources to operate on a cost-covering basis.
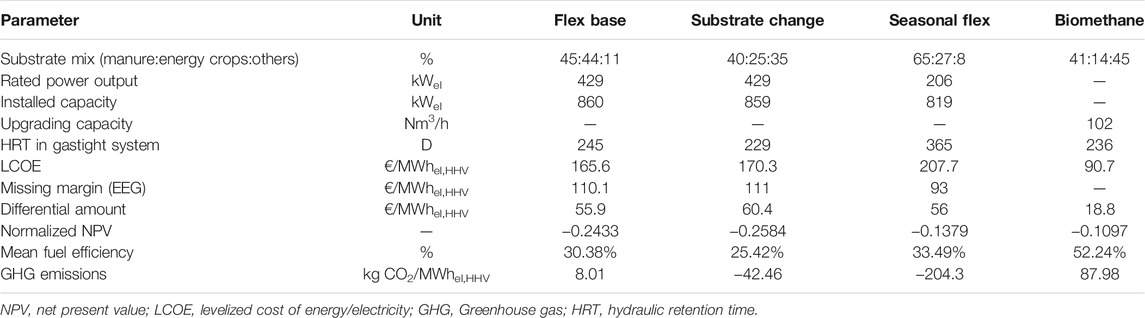
TABLE 7. Effect of the follow-up concept on the characteristic parameters and key performance indicators of BGP4 in the REF scenario.
BGP4 is not successful in the bidding process, even though the follow-up concept with the lowest missing margin and therefore possible bid is well below the maximum bid limit of 151.31 €/MWhel. The reason is the limited auction volume in the corresponding year of 2028. The available auction volume for that year is 39 MW while the submitted bid volume of all the participating BGPs is 160 MW. As a result, the EEG remuneration cannot be obtained by BGP4. The NPV based on market revenues only is negative.
The highest mean fuel efficiency can be achieved by “Biomethane” since no combustion process takes place in the CHP unit, which is associated with a considerable loss of energy. Looking only at the CHP concepts, “Seasonal Flex” shows the highest value with 33.49%. It is also the concept with the lowest GHG emissions since it combines a change in substrate mix and an increase in heat utilization.
As shown in Figure 4, the trends for BGP4 also apply to the other reference BGPs. LCOE of the CHP concepts are highest for the “Seasonal Flex” and lowest for “Flex Base,” except for BGP5 and 6. Here lowest LCOE is achieved by “Substrate Change.” One reason is the smaller reduction in rated power in comparison with “Flex Base.” Since these BGPs are located in NI, which accounts for the majority of all BGPs, the weight on the average LCOE for all plants (n = 2,508) is very strong and leads to the lowest average LCOE for “Substrate Change” (see Supplementary Figure S5). For the reference BGPs, the LCOE for “Biomethane” range from 82.23 to 128.2 €/MWhHHV. Again, the results highlight the economies of scale, being highest for BGP1 and lowest for BGP5.
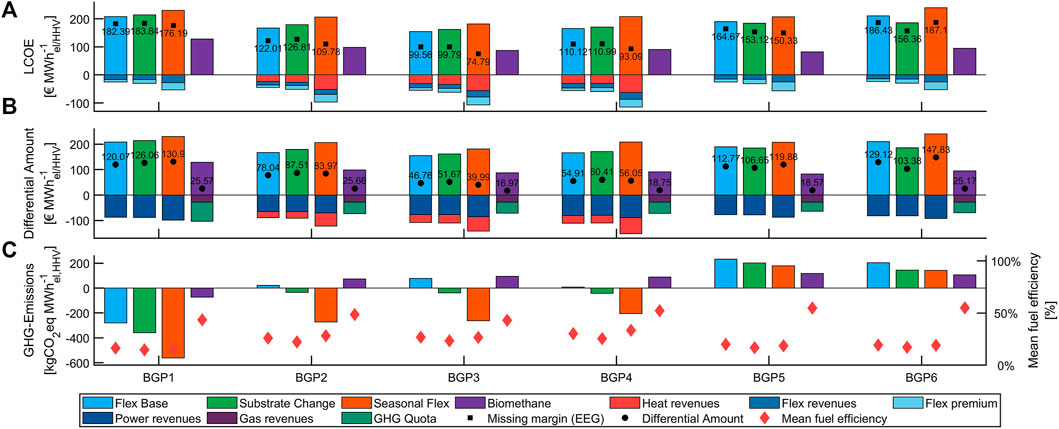
FIGURE 4. KPI comparison of follow-up concepts for the representative BGPs in the REF scenario; BGP, Biogas plants; LCOE, Levelized cost of energy/electricity; GHG, Greenhouse gas.
Except for BPG6, the lowest missing margins can be achieved by “Seasonal Flex.” “Seasonal Flex” can even be economically advantageous for plants without heat utilization, like BGP1&5. The reason is the higher power and flex revenues, which, in turn, are caused by a higher PQ as well as higher spot market prices in the winter months. The plant-specific results regarding the differential amount are slightly different, with “Flex Base” achieving the lowest values for BGP1, 2, and 4. Considering all plants, on average lowest values are achieved by “Substrate Change,” but differences to “Flex Base” are however very small (see Supplementary Figure S5).
As with BGP4, a “Substrate Change” usually leads to an improvement and thereby to a decrease in GHG emissions, but also a slight decrease in mean fuel efficiency. An explanation lies in the lower energy densities and methane yields of the newly introduced substrates, resulting in smaller power output and higher auxiliary consumption. For “Seasonal Flex,” the main factor for the GHG emission reduction is also the change in the substrate mix. The influence of the substrate mix is also evident when comparing the different reference BGPs and is also strongly linked to the size of the plant (compare with Table 4). Small plants like BGP1 show very low emissions due to high manure shares, while large plants like BGP5 and 6 show high emissions due to high shares of energy crops.
Concerning the auction results in the REF scenario, BGP1 and BGP6 show too high missing margins in all the concepts. Only BGP2 and BGP3 are successful in the auctions, which leads to positive NPV as can be seen in Figure 5. Although BGP2 shows a higher missing margin in comparison to BGP4, it is successful because competition is less in the corresponding auction year. Together with the comparatively low investments for “Seasonal Flex,” the highest normalized NPV can be achieved. For BGP1 and “Biomethane,” the normalized NPV comes closest to zero compared to all other concepts and BGPs in the case of an absent EEG support scheme. Even though investments are almost twice as high compared to CHP concepts, the high investments of “Biomethane” lead to generally higher normalized NPV compared to the CHP concepts under market conditions but are low when compared to successful participation in the EEG support scheme.
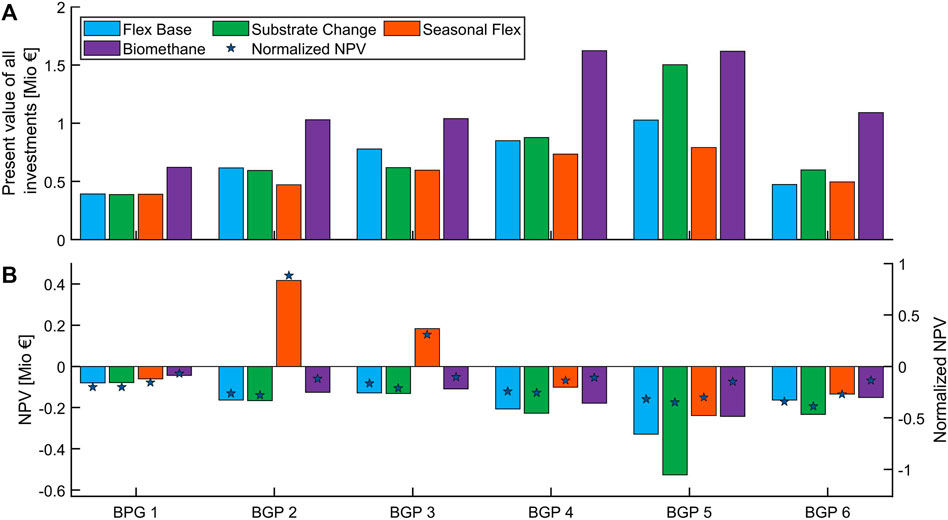
FIGURE 5. Comparison of investments (A), net present value (NPV), and normalized NPV (B) for the follow-up concepts of the representative biogas plants (BGPs) in the REF scenario.
The successful participation in the EEG support scheme strongly depends on the scenario framework as the results for the Flex++ and EEG-MOD show (compare Supplementary Tables S6, S7 for BGP4 and Supplementary Figures S2, S3 for all reference BGPs). In the Flex++ scenario, BGP4 is now successful in the bidding process. The reasons are the increased bidding volume and the nonexistent degression for the maximum bid limit. The obtained bid of 97.35 €/MWhel in the uniform pricing approach of the auction simulation leads to normalized NPV which is strongly positive (0.91). In contrast to the REF scenario, the best result for BGP4 is achieved by “Substrate Change” with a corresponding missing margin of 73.35 €/MWhel. The lower values can be explained by the higher PQ and higher flex revenues. For BGP4 the higher efficiency of “Seasonal Flex” cannot offset the advantage of economies of scale of “Substrate Change.” “Biomethane” also improves but remains unprofitable with a normalized NPV of -0.01. Besides BGP4, BGP1 and 5 are also successful in the auctions with “Substrate Change” and BGP3 with “Seasonal Flex.” BGP2, on the other hand, is no longer successful.
Figure 6 shows the KPIs LCOE, differential amount, mean fuel efficiency, and specific GHG emissions in the three regions as box plots under the theoretical implementation of “Flex Base” for all the plants in the REF scenario.
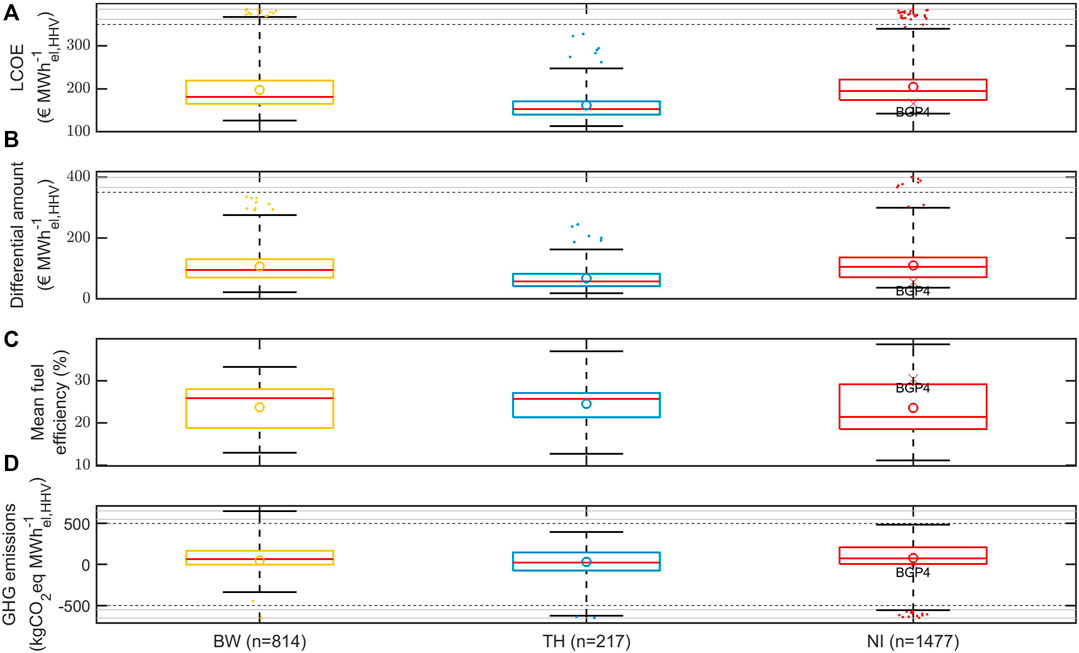
FIGURE 6. Regional differences and distribution of key performance indicators (A–D) for “Flex Base” in the REF scenario; BGP4 is additionally marked; Boxplots with a whisker value of 2.5; Circle = Mean value; Dots = Outliers; LCOE = Levelized cost of energy/electricity, GHG, Greenhouse gas; BW, Baden-Wuerttemberg; TH, Thuringia; NI, Lower Saxony.
Regarding the LCOE, the BGPs in NI stand out with the highest average value of 205 €/MWhel, resulting from the strong rated power reduction for many BGPs due to the corn cap and previous high shares of energy crops. As there is also a considerable amount of small BGPs, this leads to more outliers with very high LCOE. The largest range of LCOE is found in BW, as there is a high share of small BGPs, and the data basis is more heterogeneous compared to the one of NI. The lowest LCOE is found in TH due to the high number of large BGPs with high shares of manure and thus low variable gas costs. For the differential amount, the distribution is quite similar since revenues are assumed to be the same in each region.
Like the economic KPIs, the existing BGPs in TH show the lowest average GHG emissions and the highest mean fuel efficiency. For NI, there is a wide range of fuel efficiency due to the wide range of plants, including the smallest plant and the largest number of BGPs above 700 kWel,rated. The same applies to the range of specific GHG emissions, which is very high in NI, ranging from 485 to −500 kgCO2-eq/MWhel. Also, the mean and median values are highest for NI. Reasons for this are the high share of energy crops, but also higher GHG emission intensities for substrates such as maize silage (see Supplementary Table S11). This highlights the strong influence of the regional context and specific site properties on the GHG emission reduction potential, as noted e.g., in O'Keeffe and Thrän (2020).
Regional differences and influence are also visible when looking at a different concept (“Biomethane”) and scenario (EEG-MOD) (compare with Supplementary Figure S4). Again, the lowest LOCE is found in TH and the highest range in BW. The differences in LCOE between the BGPs of NI and BW are lower for “Biomethane” (with substrate optimization) than for “Flex Base” (without substrate optimization). The substrate optimization with regards to new requirements like low GHG emissions has therefore a greater impact on the BGPs of NI than of BW. Owing to the high GHG quota prices of the EEG-MOD scenario, almost 25% of all BGPs, in TH even more than 50%, show negative differential amounts, which corresponds to a cost-covering and profitable operation. In comparison with “Flex Base,” the mean fuel efficiency increases considerably as there is no CHP process step. On average, the mean fuel efficiency is highest in NI and lowest in TH. The same applies to the GHG emissions, which are on average 60 (BW), 39 (TH), and 81 (NI) kg CO2-eq/MWhHHV.
Figure 7 shows the development of the number of BGPs, the cumulative installed electric and biomethane capacity until the year 2035 for all three scenarios. Also, it shows the distribution of the plant-specific implemented follow-up concepts, including the number of BGPs still operating within the first EEG support period. In all the scenarios, there is a strong decline in the number of BGPs, whereby this is most pronounced in the REF scenario. Here, only 23% of the BGPs still operate in 2035. In the Flex++ (48%) and EEG-MOD (54%) scenarios, significantly more BGPs can keep up their operation in 2035. The impact on the installed capacity is much less severe due to the flexibilization and addition of new capacity. In the REF scenario, installed capacity drops by 61% until 2035, while it even rises by 29% in the Flex++ scenario. In the EEG-MOD, it initially rises until the end of the 2020s, only to fall again to 1,122 MWel in 2035, which corresponds to an almost stagnant development. This development varies greatly from region to region, e.g., in the REF scenario, the installed capacity in TH remains constant, while it falls by over 70% in NI (see Supplementary Figure S6).
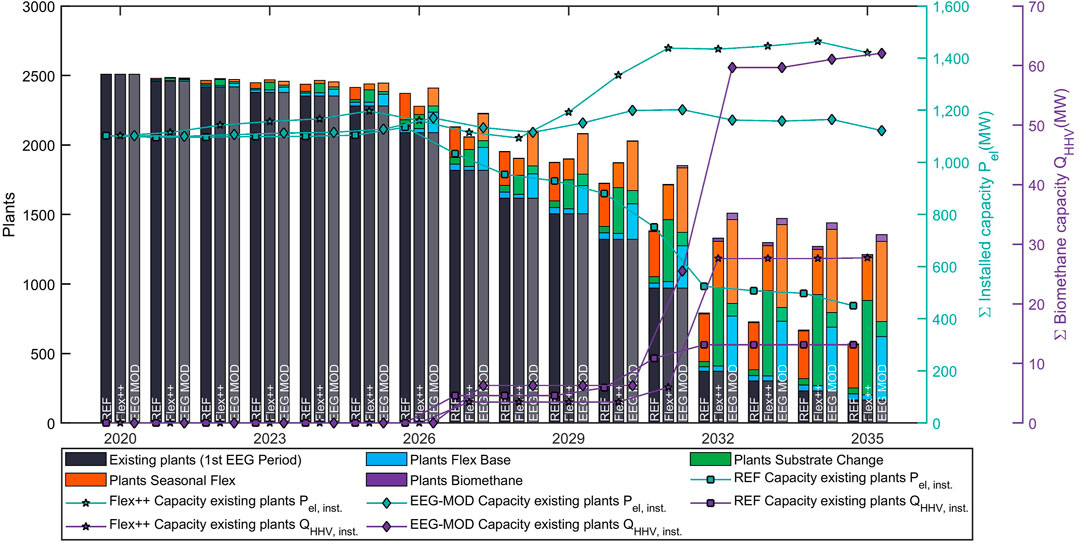
FIGURE 7. Development of existing plants until 2035 in all three regions (n = 2,508) by comparing the three scenarios. Showing distribution of plant-specific implemented follow-up concept, installed electric capacity, and biomethane capacity.
One influence on the different developments is the maximum bid limit, which is reduced by the degression in the REF scenario while it remains constant in the Flex++ and EEG MOD scenarios. For example, if the follow-up concepts with the lowest missing margin are implemented in the REF scenario, 1,632 plants could participate in the bidding process, whereas the frameworks of Flex++ and EEG-MOD would enable the participation of 2,356 and 2,164 plants, respectively. Another main reason is the different auction volumes. Despite the high PQ and participation rates in the Flex++ and EEG-Mod scenarios, the cumulative auction volumes would be almost sufficient (83 MW are missing in the REF scenario). However, the distribution of the auction volumes over time is decisive. The years from 2023 to 2029 play the main role here. In individual years, up to 445 MWel of auction volume are missing (Flex++ in 2029), while around 2035 up to 1,000 MWel remain due to carryover of left-over volumes to the subsequent years. For relatively new BGPs built after 2010, only the maximum bidding limit is, therefore, an obstacle, while older BGPs are subject to much stronger competitive pressure.
The distribution of the most profitable follow-up concepts also differs considerably in the scenarios. For example, in the REF scenario, “Seasonal Flex” is implemented almost exclusively. As shown in Figures 4, 5, “Seasonal Flex” is advantageous for BGPs with a certain size and generally low missing margins. The main advantage lies in the higher PQ. Changing framework conditions and equally high PQ for all concepts reduce the advantage of the “Seasonal Flex” concept. The “Substrate Change” becomes the most important concept (Flex++). For equal PQ, rated power output and economies of scale are the driving factors. The regional differences (size distribution and substrate mix) also play important roles here. Since the “Substrate Change” is more important in NI, BGPs in this state profit the most from higher PQ and higher auction volumes (also compare Supplementary Figures S6–S8). In the REF scenario, BGPs in NI reduce the most, due to comparable higher LCOE and missing margins as well as the limited auction volumes. Similarly, BGPs in BW profit strongest from the conditions in the EEG-MOD scenario, with additional support for small plants. In contrast to the Flex++ scenario, “Flex Base” gains significant shares in the EEG-MOD scenario, mainly in BW and NI. The existing BGPs in TH show the most robust development when comparing all scenarios. The main concept being implemented here is also the “Seasonal Flex” concept.
In the Flex++ and EEG-MOD scenarios, the higher GHG quota prices enable more BGPs to switch to “Biomethane” upgrading. This leads to a cumulative biomethane capacity of 27 MWHHV (Flex++) and 62 MWHHV (EEG-MOD) in 2035. The latter corresponds to 543 GWhHHV annually. In addition to the current biomethane sales of approximately 400 TWhHHV this would cover 39% of the current methane fuel market volume of 2.43 TWhHHV (Völler and Reinholz, 2019). However, the methane fuel market is expected to develop further by 2035. For example, forecasts for the liquefied natural gas market assume 9.7 to 32.5 TWhHHV in 2030 (Edel et al., 2019). The main drivers are seen in the requirements of the RED II for advanced fuels.
The larger number of BPGs in EEG-MOD can be attributed, on the one hand, to the lower substrate price increase and the resulting lower LCOE. On the other hand, smaller BGPs are favored in the bidding process in EEG-MOD. This dynamic pushes some of the larger BGPs out of the bidding process. However, these BGPs then “fall back” on the “Biomethane” concept as the next economically viable option. This shows that participation in EEG auctions is usually the most profitable option when there are several options to choose from. The regional distribution for the “Biomethane” concept is different once again. Roughly 70% are found in NI, 5–10% in TH, and 15–20% in BW (also compare Supplementary Figures S6–S8).
Scenario developments such as the decommissioning of BGPs or the implementation of certain follow-up concepts strongly affect the gross GHG emissions and the net reduction potential of the existing BGPs (Figure 8). All the scenarios register a strong reduction in the gross GHG emissions of the biogas, electricity respectively biomethane production. In 2035, emissions are only 2% (REF), 7% (Flex++), and 6% (EEG-MOD) of the 2020 value. The reduction is closely related to the decommissioning rate but also to changes in the overall substrate mix, in which the share of liquid and solid manure increases from 40% in 2020 to 70% (REF), 55% (Flex++), and 60% (EEG-MOD) in 2035 (see Supplementary Figure S10). Maize silage will account for a share of only 18% (REF) to 24% (EEG-MOD) in 2035. Technical progress like lower methane slip in CHP units and more gastight digestate storage systems also contributes to the reduction of gross GHG emissions.
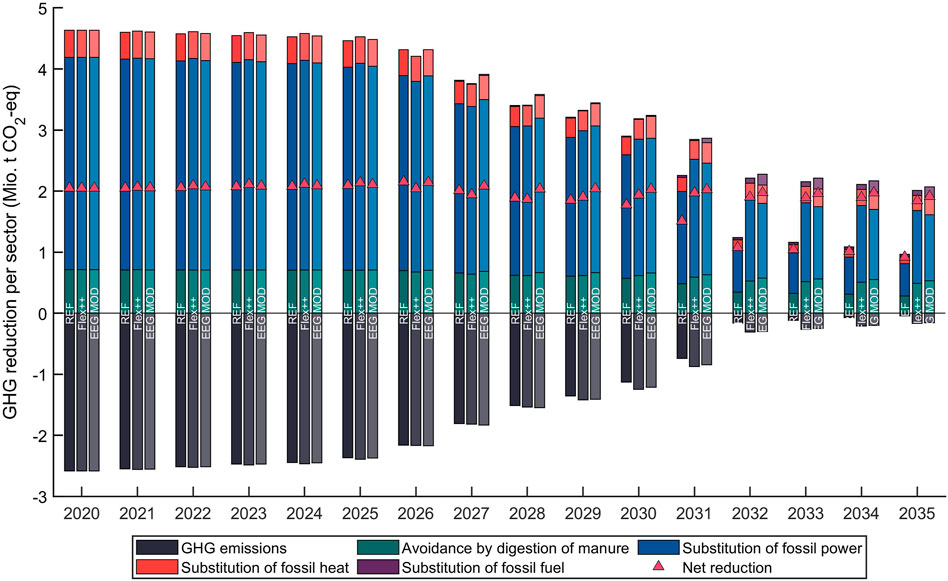
FIGURE 8. Development of greenhouse gas (GHG) emission reduction by all existing BGP until 2035 in all three regions (n = 2,508) comparing all three scenarios. Showing sector-wise shares of GHG emission avoidance, GHG emissions of biogas production, and the resulting net reduction.
Still, the absolute amount of manure decreases, leading to a decrease in the GHG avoidance of manure storage emissions. Together with the implementation of different follow-up concepts (e.g., increase in heat usage in the “Seasonal Flex” concept) and the changing reference values for the substituted energy type (see Supplementary Table S10), this changes the shares of the GHG emission avoidance in each sector. The share of substituting fossil electricity decreases while shares of manure emission avoidance, substituting fossil heat and fuel increase. The electricity sector, however, stays the main cause for avoiding GHG emissions.
All these developments also ensure that the decline of the net GHG reduction (= gross reduction less GHG emissions) in relation to the number of BGPs, electricity production, and substrate input is significantly lower (compare Figure 8 with Supplementary Figures S9, S10). Compared to 2020 the net reduction per BGP rises from 817 t CO2-eq/a to 1,615, 1,520 and 1,412 t CO2-eq/a in the REF, Flex++ and EEG-MOD, respectively. In the EEG-MOD scenario, 93% of the net GHG reduction of 2020 can be maintained. Thus, the existing BGPs become significantly more efficient in terms of GHG avoidance. However, the REF scenario also shows that a large share of 55% of the current GHG reduction potential may be lost. If not compensated by other measures outside the biogas sector, this would lead to an overall increase in GHG emissions, as the GHG reduction from manure digestion decreases by 25% (EEG mod) to 60% (REF).
From the results, several parameters can be identified that favor a successful extension period, e.g., through low LCOE. One important parameter is the plant size, with economies of scale becoming less important above a rated power output of 140–200 kWel,rated. Equally important are high shares of substrates characterized by low variable gas costs such as manure. This is more dominant for existing plants compared to new installations because the share of capital-related costs becomes smaller compared to demand-related ones such as substrate costs (see also Güsewell et al. (2019)). However, the shift in cost shares is counteracted by the effects of flexibilization, which leads to lower full-load hours and thus a higher share of fixed costs per unit of energy produced. Determining the optimal substrate mix depends on many aspects including location, future supply conditions such as yield development under increasing global warming, and the availability of manure or residues. High manure shares or other low GHG-intense substrates are also important regarding revenues in future decarbonized energy markets. This applies not only to the fuel sector, where low GHG-intense substrates are already more profitable today but also to renewable heat and power markets, as considered by the RED II and partly the EEG-MOD scenario.
As a result, small manure plants (BGP1) and plants with a high share of energy crops (BGP 4–6) face great difficulties when extending their operation. In the REF scenario, only 4% (BGP4) or 14% (BGP5) of the assigned BGPs can extend their operation. BPG1 and 6 have currently no prospect to extend operation. However, small manure plants still have long remaining runtimes until the 2030s under the EEG support scheme. The framework conditions may change in their favor by then. Larger manure plants like BGP2 and 3 have better chances in the REF scenario and 38 and 75%, respectively, extend their operation. As current markets do not compensate for the ecological advantage of smaller plants, further developments of the framework are particularly important for smaller plants. This is highlighted by the 85 and 89% of BGP1 type prevailing in the Flex++ and EEG-MOD scenarios, respectively.
An existing heat usage or the option to develop a heat sink is equally important for the extended operation. Of the BGPs prevailing, 63% (Flex++) to 75% (REF) utilize heat. High net heat utilization should be targeted in any CHP concept. The flexibilization, especially with a seasonal focus, contributes to this because higher heat loads can be covered. Existing gastight digestate storages are also relevant if higher gas storage or GHG reduction requirements exist. If these requirements are low or nonexisting, gastight digestate storage is not crucial or advantageous. Only 41% (REF) of prevailing BGPs initially have gastight storage compared to 63% (Flex++) and 56% (EEG-MOD). Assessing all factors from a regional perspective, the BGPs of TH are considered to be robustly positioned for different developments in the legal and economic framework.
The resulting differential amounts make clear that revenues from conventional power and heat markets are not sufficient under the current design. Even a significant increase in electricity market prices of 30% (Flex++ to REF) and higher flex revenues would allow only 3.5% of the CHP concepts to operate outside of the EEG support scheme. On-site CHP operation without public support schemes is still considered economically unfeasible in the short and medium terms. An exception for a few BGPs might be the self-supply of energy on the farm (Güsewell et al., 2020). Hence, a future cost-covering operation of BGPs demands drastic changes in the market design leading to high energy and CO2 prices. The future development of these parameters is highly uncertain. Estimates of trends, opportunities, and risks of future markets are given in Supplementary Table S8. Especially, the biomethane fuel market in the transport sector is currently estimated to be very dynamic, with many trends indicating increasing sales opportunities. For on-site CHP, an increase in the flexibility demand is expected. However, without a higher CO2 price, fossil gas-fired power plants will still have a cost advantage and high available capacities will not lead to shortage prices and higher margins (Kopiske et al., 2017). The increase in the value of flexibility is therefore likely to remain limited and operation outside a public support scheme will not be profitable. The extension of public support schemes, therefore, remains the largest opportunity but also poses higher risks compared to the past. Here, high auction volumes are regarded as more important than the limits on the maximum bids. Besides, rising substrate costs constitute a very high risk for all the concepts.
A silver bullet follow-up concept that is equally suitable for all BGPs is not apparent. The future options of the revenue structure and the initial setup of the BGPs are too diverse. Still, participation in the EEG auction with a strong flexibilization and high PQs is considered the most profitable option for the extended operation period. Higher PQs are important due to several reasons: First, economies of scale are stronger for gas utilization than gas production due to higher efficiency rates and lower specific investment and operating costs for larger CHP units. Second, lower full load hours increase the service life and reduction of replacement procurements. Last, higher PQs enable higher market value and specific revenues. Our conclusion regarding the most promising economic concepts differs from the one of Gökgöz et al. (2020), even though a combination of biomethane upgrading and CHP utilization is not part of this study. However, the result of this study is more robust considering the high number and heterogeneity of BGPs.
Although the auction process is more complex and involves more effort and higher risk than previously fixed feed-in remuneration, the remuneration of the bidding process and the flex bonus offer higher security than the entry into non-EEG concepts and new markets. The business model remains relatively unchanged since there is no new main product. However, flexibilization and direct marketing may represent a transfer of decision-making authority or intervention in the business, e.g., if the flexible CHP production is fully remote controlled.
Regarding the different CHP concepts, “Seasonal Flex” is a robust concept considering the shares across all scenarios. Not only is there an economic advantage of around 10 €/MWhel,rated power for many BGPs, but also a strong improvement of GHG emissions (see also Supplementary Figure S5). A risk-reducing strategy and promising option for operators could be outlined as follows: A moderate flexibilization within the first EEG period with PQs around two to three, followed by a reduction of rated power for the extension period. On the one hand, the later “smaller plant” has relatively high efficiency (because of the larger CHP unit); on the other hand, high flexibility is available at times when flexibility may have a significantly higher value than the current case. Moreover, sufficient wintertime flexibility would be retained in the case of “Seasonal Flex.” Also, the investments of the flexibilization are distributed over a longer period and a high PQ in the extended period can be achieved with a lower investment.
A “Substrate Change” could also play a significant role in the future. Even though in general it is associated with higher costs, as also stated in the study of Stürmer (2017), it can be economically advantageous if an otherwise inevitable reduction of rated power can be averted. For BGPs in NI, this is especially important, because most BGPs going for the “Substrate Change” are located in NI. To be able to monetarize the ecological improvements regarding GHG emissions, but possibly also biodiversity and soil quality, new financial instruments and changes in the regulatory framework are needed such as an area premium for crops favoring biodiversity, incentives for humus build up, a minimum requirement of certain crop types or more drastic environmental requirement regarding the agricultural subsidies of the EU.
The switch to “Biomethane” upgrading comes with higher investments, which on average across all scenarios and BGPs are twice as high (also compare (A) in Figure 5 and Supplementary Figure S1), and volatility of the sales markets3 compared to the CHP concepts under the EEG support scheme. Therefore, it is not economically advantageous in direct comparison. In the case of a scenario with a nonexisting EEG support scheme, it would be the only profitable path. As Matschoss et al. (2020) also have shown there is considerable potential in biomethane upgrading of the existing BGPs. However, the existing biomethane upgrading plants, currently supplying the biomethane CHP market, might also switch to the transport fuel sector, because feed-in tariffs for biomethane CHP are reduced (Horschig et al., 2018). Competition in the limited biomethane market in the transport sector might therefore increase and possible revenues decline.
One major limitation that can contribute to an overestimation of the “Seasonal Flex” is the simplifications regarding the heat demand profile. Except for the plant-specific process heat demand, it is assumed that the profile is the same for each BGP. Also, the initial heat utilization rate is the same average value in each region. In reality, these two factors vary greatly depending on the type of heat sinks supplied4 and the size of the plant.
Furthermore, each follow-up concept can be varied in many ways, e.g., by changing the PQ, the shares of the substrate mix, or the rated power output. The optimal configuration strongly depends on local plant-specific conditions such as substrate availability or nutrient limitations. Implementing the concepts for each BGP uniformly is a strong simplification when considering the development of all the existing BGPs. The uniform implementation also neglects the substrate availability regarding straw and cup plant for the “Substrate Change.”
There are also shortcomings in the analysis regarding the scenario results. First, competition, dependencies, and cooperative aspects between individual BGPs are neglected. These could exert an influence on the substrate and land markets in a region (Appel et al., 2016) and lead to locally higher substrate prices. Second, the auction bidding process was strongly simplified by neglecting strategic bidding behavior, assuming that each BGP takes part only once and in a fixed year, considering only a subsegment of the bioenergy market as well as applying a uniform-price approach instead of the actual pay-as-bid approach. Last, it is assumed that each BGP with a positive NPV extends its operation even if the NPV is very low. Questions of farm succession, financial and approval problems are not considered. All this reduces the number of BGPs extending their operation, while strategic bidding behavior and bidding several times might increase it. The fact that many BGPs undertake measures like flexibilization or gastight coverage of digestate storage long before the end of the first EEG period may further contribute to an underestimation of future extension of operations.
The significantly more complex business models due to stronger market integration increase the risk for the operator and make it more difficult to finance new investments. Long-term planning and stretching the investments over a long period could ease this difficulty but require sufficient remaining operating time under the current support scheme. At the same time, new organizational solutions are necessary for the implementation of follow-up concepts to take account of different knowledge and skills, to realize economies of scale, to reduce transaction costs, and to open up new markets. The costs associated with the establishment of organizational structures and institutional paths are generally difficult to quantify or to integrate as restrictions in system models. From this point of view, the modeled BGP developments are rather upper estimates.
The fundamental economic disadvantage of smaller plants and the extension of the raw gas utilization requires new solutions such as those developed by Beyrich et al. (2019) and the establishment of plant pooling via microgrids (Matschoss et al., 2020). The concept of a central biogas utilization via microgrids should be weighed against a central biogas production (biomass logistics vs. raw gas logistics). In this context, it will also be necessary to integrate the development and promotion of raw gas infrastructure strategically and consistently in regional spatial planning with the supply of other renewable energies and the possibilities of power-to-gas. Furthermore, solutions must be developed for the problem of the varying remaining operating times of existing BGPs in a pooling approach. This could be done, for example, by employing a gradual expansion of a well-scalable upgrading technology or the combination with a CHP unit, which initially absorbs the small amount of raw gas and is operated more flexibly at a later point in time when more raw gas can be allocated to upgrading (i.e., at a time when larger amounts of raw gas are available).
Expiring support schemes and changing framework conditions for renewable energies pose many challenges on existing power plants. For BGPs and their high variable gas production costs, this is particularly the case, not only in the German market but also in many other markets in the EU and the world. A cost-covering operation requires either support schemes like the German EEG or high carbon prices around 200 €/t-CO2-eq.
Extending the operation of the existing BGPs also requires new follow-up concepts to deal with economic, societal, and ecological pressure. This study shows that the choice between on-site CHP or biomethane upgrading strongly depends on the framework conditions, the achievable revenues, and the required investments. The nonuniform incentives currently favor the on-site CHP usage and make follow-up concepts within the extended EEG support scheme more profitable while involving fewer risks. The most promising economic and robust follow-up concepts include high flexibility (PQ), seasonal and substrate mix adaptations, while the concrete design will be shaped by plant-specific and regional conditions.
In contrast to studies showing a considerable potential of new installations of smaller manure plants, the picture changes when existing BGPs extend their operation. In general, medium to larger BGPs above a rated power output of 140–200 kWel,rated are more successful due to economies of scale. Further key factors for a successful extension of operation are high shares of substrates with low variable gas cost and high heat utilization rates. Hence, BGPs with high shares of energy crops face greater difficulties and will have to adapt more drastically if they want to prevail. Smaller manure BGPs depend more on favoring conditions such as strong climate policy, but in return also benefit stronger from appropriate frameworks due to their GHG emissions advantage. Nevertheless, structural changes and a reduction of existing BGPs are most likely. Future policies should, therefore, regard regional differences and small-scale structures.
The potential to improve the existing BGPs with new follow-up concepts is strong regarding the GHG reduction, but rather weak regarding LCOE. These fundamentals are also possible for other markets outside Germany but less distinct due to substrate mixes that are already extensive regarding energy crops. Likewise, results on market revenues might be transferred to other markets, at least within the EU, since especially power markets are strongly connected, and climate policies are based on common regulations.
The original contributions presented in the study are included in the article/Supplementary Material, further inquiries can be directed to the corresponding author.
JG: Conceptualization; Formal analysis; Funding acquisition; Investigation; Methodology; Project administration; Visualization; Writing - original draft; KS: Formal analysis; Investigation; Writing - original draft; LV: Formal analysis; Visualization; Investigation; Writing - original draft; LH: Funding acquisition; Supervision; Methodology; Writing - review and editing LE: Project administration; Funding acquisition; Supervision; Writing - review and editing.
The contribution is based on work carried out in the research project “Next Generation (BIOGAS) - one step forward. Regional holistic analysis of follow-up concepts to assess the cost recovery of existing plants worth continuing their operation” (FKZ: 22404616) and funded by the German Federal Ministry of Food and Agriculture via the German Agency for Renewable Resources (FNR). The open-access publication fund of the University of Stuttgart library funds the access publication fee.
The authors declare that the research was conducted in the absence of any commercial or financial relationships that could be construed as a potential conflict of interest.
All claims expressed in this article are solely those of the authors and do not necessarily represent those of their affiliated organizations, or those of the publisher, the editors and the reviewers. Any product that may be evaluated in this article, or claim that may be made by its manufacturer, is not guaranteed or endorsed by the publisher.
We thank all participants for their important contributions in the interviews, regional workshops, and the online survey.
The Supplementary Material for this article can be found online at: https://www.frontiersin.org/articles/10.3389/fenrg.2021.719697/full#supplementary-material
BGP, biogas plant; BW, Baden-Wuerttemberg (German federal state); CHP, combined heat and power; DM, dry matter; EEG, German renewable energy sources act (German: Erneuerbaren Energien Gesetz); EEG-MOD, Scenario: “New paths in the EEG”; el, electric; Flex++, Scenario: “Strong flex demand”; EU, European Union; GHG, greenhouse gas; LCA, life cycle assessment; LP, linear programming; HHV, higher heating value; HRT, hydraulic retention times; KPI, key performance indicator; LCOE, levelized cost of electricity/energy; MILP, mixed-integer linear programming; NI, lower saxony (German federal state, German: Niedersachsen); NPV, net present value; OLR, organic loading rates; Pel,rated, rated power output (MW); Pel,inst., installed power capacity (MW); PQ, power quotient; QHHV, inst., installed biomethane production capacity (MW); RED II, EU renewable electricity directive II; REF, reference scenario: “EEG 2017 extension”; TSO, transmission system operator; th, thermal; TH, Thuringia (German federal state); wt.%, weight percentage (%).
1The national carbon price on fossil fuels, introduced in 2021 (Deutscher Bundestag, 2019), starts with 25 €/tCO2, a rather low starting point compared to current CO2 damage costs or other national carbon prices.
2The power quotient is the inverse of the capacity factor and defined as the ratio between installed electric capacity and the rated power output (annual electricity production) of the BGP.
3The GHG-quota prices fluctuated between 150 and 420 €/t CO2 in the last years (Mattiza, 2021). The energetic value of biomethane is based on the price of natural gas, which is also very volatile (e.g., see increase of wholesale market prices in 2021 (ENER, 2021)).
4E.g., suppling an indoor pool may lead to high heat utilization with a less strong demand profile, while suppling only some single-family homes may lead to very low heat utilization with a very strong demand profile.
3N, 2017 3N (2017). Biogas in Niedersachsen: Inventur 2016. Hannover: Kompetenzzentrum Niedersachsen Netzwerk Nachwachsende Rohstoffe und Bioökonomie e. V. (3N).
Appel, F., Ostermeyer-Wiethaup, A., and Balmann, A. (2016). Effects of the German Renewable Energy Act on Structural Change in Agriculture - the Case of Biogas. Utilities Policy 41, 172–182. doi:10.1016/j.jup.2016.02.013
Bacenetti, J., Negri, M., Fiala, M., and González-García, S. (2013). Anaerobic Digestion of Different Feedstocks: Impact on Energetic and Environmental Balances of Biogas Process. Sci. Total Environ. 463-464, 541–551. doi:10.1016/j.scitotenv.2013.06.058
Balussou, D., McKenna, R., Möst, D., and Fichtner, W. (2018). A Model-Based Analysis of the Future Capacity Expansion for German Biogas Plants under Different Legal Frameworks. Renew. Sust. Energ. Rev. 96, 119–131. doi:10.1016/j.rser.2018.07.041
Banja, M., Jégard, M., Motola, V., and Sikkema, R. (2019). Support for Biogas in the EU Electricity Sector - A Comparative Analysis. Biomass and Bioenergy 128, 105313. doi:10.1016/j.biombioe.2019.105313
Beyrich, W., Kasten, J., Krautkremer, B., Denysenko, V., Rensberg, N., Schmalfuß, T., et al. (2019). “Verbundvorhaben: Effiziente Mikro- Biogasaufbereitungsanlagen (eMikroBGAA),”. Schlussbericht.
Billig, E. (2016). “Bewertung technischer und wirtschaftlicher Entwicklungspotenziale künftiger und bestehender Biomasse-zu-Methan-Konversionsprozesse. Dissertationsschrift,”. DBFZ-Report Nr. 26 (Leipzig: Universität Leipzig, veröffentlicht).
BMEL (2017). Verordnung über die Anwendung von Düngemitteln, Bodenhilfsstoffen, Kultursubstraten und Pflanzenhilfsmitteln nach den Grundsätzen der guten fachlichen Praxis beim Düngen (Düngeverordnung - DüV). Berlin: DüV.
CDU, CSU, and SPD (2018). Ein neuer Aufbruch für Europa Eine neue Dynamik für Deutschland Ein neuer Zusammenhalt für unser Land: Koalitionsvertrag zwischen CDU, CSU und SPD. 19. Berlin: Legislaturperiode.
Daniel-Gromke, J., Rensberg, N., Denysenko, V., Stinner, W., Schmalfuß, T., Scheftelowitz, M., et al. (2018). Current Developments in Production and Utilization of Biogas and Biomethane in Germany. Chem. Ingenieur Technik 90, 17–35. doi:10.1002/cite.201700077
Deutscher Bundestag (2016). Gesetz für den Ausbau erneuerbarer Energien (Erneuerbare-Energien-Gesetz - EEG 2017). Berlin: EEG 2017.
Deutscher Bundestag (2019). Gesetz über einen nationalen Zertifikatehandel für Brennstoffemissionen (Brennstoffemissionshandelsgesetz). Berlin: BEHG.
DIN (2006). Umweltmanagement – Ökobilanz – Anforderungen und Anleitungen 13.020.10. 14044. Berlin: Beuth Verlag GmbH, 2006.
Dressler, D., Loewen, A., and Nelles, M. (2012). Life Cycle Assessment of the Supply and Use of Bioenergy: Impact of Regional Factors on Biogas Production. Int. J. Life Cycle Assess. 17, 1104–1115. doi:10.1007/s11367-012-0424-9
Edel, M., Jegal, J., and Siegemund, S. (2019). Bio-LNG – eine erneuerbare und emissionsarme Alternative im Straßengüter- und Schiffsverkehr: Potenziale. Berlin: Wirtschaftlichkeit und Instrumente.
EEA (2019). EMEP/EEA Air Pollutant Emission Inventory Guidebook 2019: Technical Guidance to Prepare National Emission Inventories. Copenhagen: Publications Office of the European Union.
Effenberger, M., Gödeke, K., Grebe, S., Haenel, H.-D., Hansen, A., Häußermann, U., et al. (2016). Berechnungsstandard für einzelbetriebliche Klimabilanzen (BEK) in der Landwirtschaft. Darmstadt: Kuratorium für Technik und Bauwesen in der Landwirtschaft e.V. (KTBL).
Gökgöz, F., Liebetrau, J., and Nelles, M. (2020). Kombinierte Bereitstellung von Strom und Kraftstoff an Biogasanlagen - Wirtschaftlichkeit von Anschlussszenarien. LANDTECHNIK, Bd. 75 (3). doi:10.15150/LT.2020.3242
Güsewell, J., Bahret, C., and Eltrop, L. (2020). AuRaSa – BIOGAS: Auswirkungen von veränderten energie- und umweltrelevanten Rahmenbedingungen und Technologiefortschritt auf die Entwicklung sächsischer Biogasanlagen. Dresden: Saxon State Office for Environment, Agriculture and Geology (LfULG).
Güsewell, J., Eltrop, L., and Hufendiek, K. (2021). Seasonal Flexibilisation: A Solution for Biogas Plants to Improve Profitability. Adv. Appl. Energ. 2, 100034. doi:10.1016/j.adapen.2021.100034
Güsewell, J., Härdtlein, M., and Eltrop, L. (2019). A Plant-specific Model Approach to Assess Effects of Repowering Measures on Existing Biogas Plants: The Case of Baden-Wuerttemberg. GCB Bioenergy 11, 85–106. doi:10.1111/gcbb.12574
Härdtlein, M., Eltrop, L., Messner, J., and Dederer, M. (2013). Schwachstellen-Identifikation und Optimierungspotenziale von Biogasanlagen in Baden-Württemberg. Eine technisch-ökonomische Analyse auf der Basis einer Befragung von Biogasanlagenbetreibern. Stuttgart: Endbericht.
Horschig, T., Adams, P. W. R., Gawel, E., and Thrän, D. (2018). How to Decarbonize the Natural Gas Sector: A Dynamic Simulation Approach for the Market Development Estimation of Renewable Gas in Germany. Appl. Energ. 213, 555–572. doi:10.1016/j.apenergy.2017.11.016
Howard, P., and Sylvan, D. (2021). Gauging Economic Consensus on Climate Change. New York: Institute for Policy Integrity, New York University School of Law.
IEA (2020). “Outlook for Biogas and Biomethane: Prospects for Organic Growth,”. World Energy Outlook Special Report. New York: Institute for Policy Integrity, University School of Law.
IPCC (2013). “Climate Change 2013: The Physical Science Basis,” in Working Group I Contribution to the Fifth Assessment Report of the Intergovernmental Panel on Climate Change (Cambridge: Cambridge University Press).
IPCC (2018). Global Warming of 1.5°C: An IPCC Special Report on the Impacts of Global Warming of 1.5°C above Pre-industrial Levels and Related Global Greenhouse Gas Emission Pathways, in the Context of Strengthening the Global Response to the Threat of Climate Change, Sustainable Development, and Efforts to Eradicate Poverty
ISO (2006). Umweltmanagement – Ökobilanz – Grundsätze und Rahmenbedingungen. Geneva: 13.020.10. 14040:2006.
Jacobs, A., Auburger, S., Bahrs, E., Brauer-Siebrecht, W., Christen, O., Götze, P., et al. (2017). Greenhouse Gas Emission of Biogas Production Out of Silage maize and Sugar Beet - an Assessment along the Entire Production Chain. Appl. Energ. 190, 114–121. doi:10.1016/j.apenergy.2016.12.117
Kopiske, J., Spieker, S., and Tsatsaronis, G. (2017). Value of Power Plant Flexibility in Power Systems with High Shares of Variable Renewables: A Scenario Outlook for Germany 2035. Energy 137, 823–833. doi:10.1016/j.energy.2017.04.138
KTBL (2014). Betriebsplanung Landwirtschaft: 2014/15. Darmstadt: Kuratorium für Technik und Bauwesen in der Landwirtschaft e.V. (KTBL).
KTBL (2013). Faustzahlen Biogas. Darmstadt: Kuratorium für Technik und Bauwesen in der Landwirtschaft e.V. (KTBL).
Landwirtschaftskammer Niedersachsen (2021). Nährstoffgehalte in Organischen Düngern. Available at: https://www.lwk-niedersachsen.de/index.cfm/portal/duengebehoerde/nav/2280/article/32460.html.
Liebetrau, J., Daniel-Gromke, J., Oehmichen, K., Friehe, J., Clemens, J., and Hafermann, C. (2011). Emissionsanalyse und Quantifizierung von Stoffflüssen durch Biogasanlagen im Hinblick auf die ökologische Bewertung der landwirtschaftlichen Biogasgewinnung und Inventarisierung der deutschen Landwirtschaft. Leipzig: (FKZ: 22023606).
Matschoss, P., Pertagnol, J., Wern, B., Bur, A., Baur, F., Dotzauer, M., et al. (2019). Analyse der gesamtökonomischen Effekte von Biogasanlagen: MakroBiogas Wirkungsabschätzung des EEG. Leipzig, Berlin: Endbericht. Saarbrücken.
Matschoss, P., Steubing, M., Pertagnol, J., Zheng, Y., Wern, B., Dotzauer, M., et al. (2020). A Consolidated Potential Analysis of Bio-Methane and E-Methane Using Two Different Methods for a Medium-Term Renewable Gas Supply in Germany. Energ Sustain. Soc. 10, 41. doi:10.1186/s13705-020-00276-z
O'Keeffe, S., Franko, U., Oehmichen, K., Daniel‐Gromke, J., and Thrän, D. (2019). Give Them Credit‐the Greenhouse Gas Performance of Regional Biogas Systems. GCB Bioenergy 11, 791–808. doi:10.1111/gcbb.12603
O’Keeffe, S., and Thrän, D. (2020). Energy Crops in Regional Biogas Systems: An Integrative Spatial LCA to Assess the Influence of Crop Mix and Location on Cultivation GHG Emissions. Sustainability 12, 237. doi:10.3390/su12010237
Open Power System Data (2020). Data Package Time Series. (Primary data from various sources, for a complete list see URL) Available at: https://data.open-power-system-data.org/time_series/2018-06-30.
Pucker, J., Jungmeier, G., Siegl, S., Pötsch, E. M., Stuhlbacher, A., Ebner-Ornig, F. J., et al. (2010). “ÖKOBILANZ BIOGAS -ERFOLGSFAKTOREN ZUR NACHHALTIGEN NUTZUNGDER BIOGASTECHNOLOGIE AMBEISPIEL AUSGEWÄHLTER BIOGASANLAGEN,”. Endbericht Graz.
Reinhold, G. (2017). Integration der Biogaserzeugung in die Landwirtschaft Thüringens. Jena: Abschlussbericht.
Reinhold, G. (2015). Statistik der Biogasanlagen in Thüringen - Stand 2015,. Fachtagung Biogas 1/2015, 2015. Jena: Thüringer Landesanstalt für Landwirtschaft (TLL).
Rösemann, C., Haenel, H.-D., Dämmgen, U., Döring, U., Wulf, S., Eurich-Menden, B., et al. (2019). Calculations of Gaseous and Particulate Emissions from German Agriculture 1990 – 2017: Report on Methods and Data (RMD) Submission 2019. Braunschweig: Johann Heinrich von Thünen-Institut.
Roth, U., Döhler, H., Hartmann, S., Häußermann, U., Stadelmann, M., Wirth, B., et al. (2013). Umwelt-Campus Birkenfeld: IfaS Biomasse-Tagung.Energie-, Klima- und Ökobilanzen landwirtschaftlicher Biogasanlagen,
Scarlat, N., Dallemand, J.-F., and Fahl, F. (2018). Biogas: Developments and Perspectives in Europe. Renew. Energ. 129, 457–472. doi:10.1016/j.renene.2018.03.006
Schmehl, M., Hesse, M., and Geldermann, J. (2012). Ökobilanzielle Bewertung von Biogasanlagen unter Berücksichtigung der niedersächsischen Verhältnisse. Göttingen: Göttingen.
Sorda, G., Sunak, Y., and Madlener, R. (2013). An Agent-Based Spatial Simulation to Evaluate the Promotion of Electricity from Agricultural Biogas Plants in Germany. Ecol. Econ. 89, 43–60. doi:10.1016/j.ecolecon.2013.01.022
Stürmer, B. (2017). Feedstock Change at Biogas Plants - Impact on Production Costs. Biomass and Bioenergy 98, 228–235. doi:10.1016/j.biombioe.2017.01.032
Szarka, N., Scholwin, F., Trommler, M., Fabian Jacobi, H., Eichhorn, M., Ortwein, A., et al. (2013). A Novel Role for Bioenergy: A Flexible, Demand-Oriented Power Supply. Energy 61, 18–26. doi:10.1016/j.energy.2012.12.053
TLL (2015). Landwirtschaftliche Biogasanlagen in Thüringen. Available at: http://www.tll.de/bga_info/bga_inf.htm (Accessed February 14, 2018).
UBA (2016). Berichterstattung unter der Klimarahmenkonvention der Vereinten Nationen 2015: Nationaler Inventarbericht zum Deutschen Treibhausgasinventar 1990 - 2013. Dessau-Roßlau: Federal Environment Agency.
ÜNB (2019). EEG-anlagenstammdaten. Available at: https://www.netztransparenz.de/EEG/Anlagenstammdaten (Accessed May 05, 2021).
Völler, K., and Reinholz, T. (2019). Branchenbarometer Biomethan 2019: Dena-Analyse. Berlin: Deutsche Energie-Agentur GmbH (dena).
Keywords: biogas plants, biomethane upgrading, extended operation, follow-up concepts, regional scenario analysis, seasonal flexibilization, support scheme
Citation: Güsewell J, Scherzinger K, Holstenkamp L, Vincent L and Eltrop L (2021) Extending the Operation of Existing Biogas Plants: Which Follow-Up Concepts and Plants Will Prevail?. Front. Energy Res. 9:719697. doi: 10.3389/fenrg.2021.719697
Received: 02 June 2021; Accepted: 28 September 2021;
Published: 03 November 2021.
Edited by:
Sachin Kumar, Sardar Swaran Singh National Institute of Renewable Energy, IndiaReviewed by:
Pau Loke Show, University of Nottingham Malaysia, MalaysiaCopyright © 2021 Güsewell, Scherzinger, Holstenkamp, Vincent and Eltrop. This is an open-access article distributed under the terms of the Creative Commons Attribution License (CC BY). The use, distribution or reproduction in other forums is permitted, provided the original author(s) and the copyright owner(s) are credited and that the original publication in this journal is cited, in accordance with accepted academic practice. No use, distribution or reproduction is permitted which does not comply with these terms.
*Correspondence: Joshua Güsewell, am9zaHVhLmd1ZXNld2VsbEBpZXIudW5pLXN0dXR0Z2FydC5kZQ==
Disclaimer: All claims expressed in this article are solely those of the authors and do not necessarily represent those of their affiliated organizations, or those of the publisher, the editors and the reviewers. Any product that may be evaluated in this article or claim that may be made by its manufacturer is not guaranteed or endorsed by the publisher.
Research integrity at Frontiers
Learn more about the work of our research integrity team to safeguard the quality of each article we publish.