 Yonghai Gao
 Yanlong Wang
 Guizhen Xin1,2
- 1School of Petroleum Engineering, China University of Petroleum (East China), Qingdao, China
- 2Qingdao Marine Engineering and Subsea Equipment Inspection and Testing Co.Ltd, Qingdao, China
- 3Offshore Oil Production Company, Shengli Oilfield, SINOPEC, Dongying, China
- 4China Oilfield Services Limited, Tianjin, China
In deepwater gas well testing, the high-pressure and low-temperature environment in the wellbore provides conditions for hydrate formation. When the thermodynamic inhibitor is used, it needs a large amount and is difficult to inject. Low-dose hydrate inhibitors such as kinetic inhibitors are rarely used in high supercooling and natural gas–dominated environments. The mixed use of thermodynamic inhibitors and kinetic inhibitors provides a new way. By simulating the wellbore temperature and pressure conditions during the deepwater gas well testing, the inhibiting effect of the mixtures of PVCap and methanol with various concentrations was experimentally tested by using rocking cells with a step-cooling method at 21MPa. The effect of PVCap and its mixture with methanol on hydrate plugging was evaluated by monitoring the movement of slider in the rocking cell. The results showed that 5 wt%, 16 wt%, and 20 wt% methanol mixed with 0.5 wt% PVCap could prolong the induction time, and the higher the methanol concentration, the longer the hydrate induction time. Among them, the best combination of 20wt% methanol and 0.5wt% PVCap can inhibit the hydrate for 379 min. The hydrate was formed but did not block the rocking cell, indicating that the combination of PVCap and methanol could not only prolong the hydrate formation time but also avoid the blockage after hydrate formation. The hydrate formation rate with various inhibitor concentrations was calculated; it may provide some guidance for making a shut-in plan for on-site wells.
Introduction
With the development of deep-water, efficient and safe gas well testing is very important, and the prevention and control of natural gas hydrate (hereinafter referred to as hydrate) is a major problem faced by gas well testing (Zong, 2012; Wang et al., 2016a; Liu et al., 2018a). Natural gas hydrate is an ice-like crystal formed by water molecules and gas molecules at low temperature and high pressure (Koh et al., 2011; Gao et al., 2019a; Fu et al., 2020). During gas well testing, natural gas hydrate is easy to be formed in the test string. If the formed gas hydrate blocks the flow channel, it will seriously affect the safety of operation and may lead to test failure (Jassim et al., 2010; Arrieta et al., 2011; Li et al., 2012; Vitor de Assis et al., 2013; Guan et al., 2014; Wang et al., 2016b; Liu et al., 2018b; Gao et al., 2018; Zhang et al., 2019). At present, the most commonly used hydrate prevention method in deepwater gas well testing is to inject excessive hydrate thermodynamic inhibitor into the test string to completely inhibit the formation of hydrate in the wellbore (Creek, 2012; Bavoh et al., 2017; Wang et al., 2018; Zhao et al., 2020). The field application shows that the method of completely inhibiting the hydrate formation with a thermodynamic inhibitor such as methanol has a good control. However, this method requires a high injection rate of hydrate inhibitor, which results in huge cost of hydrate prevention and treatment (Bi et al., 2009; Da et al., 2012; Vitor de Assis et al., 2013). In addition, due to the injection of a large number of hydrate thermodynamic inhibitors, the produced water contains a high concentration of inhibitors, which makes post-processing difficult (Xu et al., 2017). On the other hand, heavy use of thermodynamic inhibitors can affect oil and gas quality, reduce the price of oil and gas, and reduce profits (Hyunho et al., 2018; Paz and Netto, 2020). The kinetic inhibitor can prolong the time of hydrate formation (Kamal et al., 2016). At present, some commonly used kinetic inhibitors can play a good inhibitory effect under the condition of the low subcooling degree, but under the condition of the high subcooling degree (more than 10°C), the inhibitory performance will be greatly weakened, or even fail (Zhang et al., 2007; ZareNezhad et al., 2015; Ke and Kelland, 2016). Moreover, in the environment dominated by the gas phase, due to the high flow velocity of gas and the low amount of the kinetic inhibitor, the kinetic inhibitor is difficult to be uniformly dispersed to the liquid phase, making it difficult for the kinetic inhibitor to play its role (Song et al., 2019; Wang et al., 2019). At present, there have been reports on the combined use of kinetic inhibitors and thermodynamic inhibitors (Cohen et al., 1998; Huo et al., 2012; Lee et al., 2016a; Lee et al., 2016b; Shen et al., 2019), but most of them are used to verify the synergistic effect of thermodynamic inhibitors on kinetic inhibitors. In this study, the synergistic effect of kinetic inhibition on thermodynamic inhibitors was explored when thermodynamic inhibitors were used as main agents. This study can adjust the amount of thermodynamic inhibitor in field application.
The idea of hydrate control can be changed according to the actual working conditions. It is not necessary to completely prevent hydrate formation in the field operation. It can be done safely by extending the hydrate formation time. Due to the high subcooling degree of deepwater operation (Wu et al., 2015; Gao et al., 2017; Gao et al., 2019b; Olajire, 2020) (over 18°C) and complex working conditions, the use of kinetic inhibitors alone is at high risk, while the use of thermodynamic inhibitors alone is difficult to inject inhibitors when the water content is high. Therefore, the combination of thermodynamic inhibitor and kinetic inhibitor can ensure the safety of testing and effectively reduce the use of the hydrate thermodynamic inhibitor, which has important field application significance.
Experimental Equipment and Method
Experimental Scheme
During the deepwater test, the long shut-in state after cleanout of well is the most likely period for hydrate formation. Aiming at the difficult problem of hydrate control in the shut-in condition during the deepwater test, this study simulates the formation of the hydrate in the shut-in condition when temperature drops to ambient temperature during the deepwater test. The inhibition effect of methanol and PVCap (polyvinyl alcohol caprolactam) on hydrate was evaluated. The kinetic inhibitor was PVCap, which was recognized to have a good inhibitory effect. The PVCap (Mw = 5,000 and polydispersity = 1.303) used is manufactured by BASF.
Experimental Facility and Procedure
The experiment of inhibitor optimization evaluation was carried out with a rocking cell apparatus. The experimental apparatus is composed of a 115-ml cell, rocker, and swinging motor. There is a slider in the rocking cell, and the slider can move back and forth when the cell is rocking. The slide positions can be monitored. The hydrate plugging in the cell can be estimated by analyzing the position of the slider. The equipment is manufactured by Qingdao Hengjitai Electromechanical Technology Co., Ltd. The kettle body is made up of 316 stainless steel with good corrosion resistance and can withstand the pressure of 30 MPa. The slider slides on the stainless-steel measuring rod of the displacement sensor due to gravity. The slider is equipped with special magnetic ring inside, and the magnetic field changes when the slider moves. Such magnetic field changes are detected and processed at a very fast speed, so the displacement sensor can accurately measure the displacement value of the slider in the kettle at any moment. The circuit diagram of the experimental apparatus is shown in Figure 1.
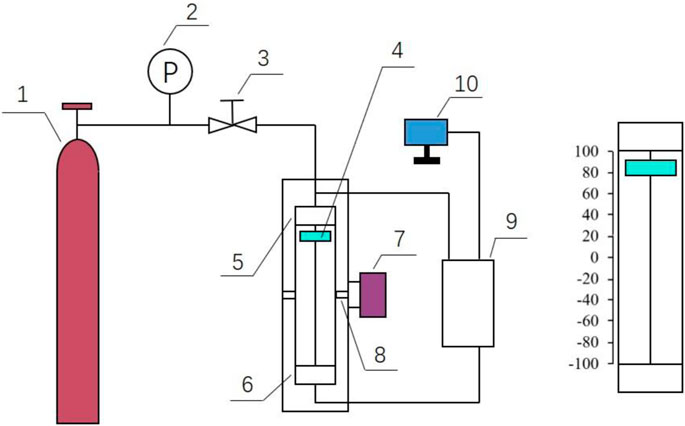
FIGURE 1. Schematic of rocking cell. 1-methane gas cylinder, 2-pressure gauge, 3-valve, 4-slider, 5-temperature sensor, 6-pressure sensor, 7-swinging kettle motor, 8-swinging bar, 9-data acquisition box, and 10-t display.
The data acquisition system consists of sensors, data acquisition box, and display. Sensors are used to monitor temperature and pressure in real time. The monitoring data of the sensor are fed back to the display screen through the data acquisition box.
The rocking cell is completely immersed in the water bath. The cooling system is mainly composed of a low-temperature thermostatic tank, which provides water for the cell to reach the set temperature. The experiment is a cooling experiment, and the target temperature is 2°C. The adjustable temperature range of the cryogenic thermostat is 10–100 °C, and the temperature control error is ±0.1°C, which fully meets the experimental requirements. The experimental gas was a high-purity methane gas (a purity of 99.999% or more). Considering the gas–liquid ratio during hydrate generation and the volume of rocking kettle, it was decided to inject 35 ml liquid into the cell each time to simulate the formation produced liquid and residual liquid in the wellbore.
The experiment of hydrate inhibitor evaluation was completed with the rocking cell. The experimental procedure is as follows. First, the cell was repeatedly cleaned with deionized water, and the vacuum pump was used to vacuum the cell. Second, the prepared inhibitor solution was injected into the rocking cell. After stabilization, the temperature of the water bath box was set at 20°C and maintained for a moment. When the temperature was stable, methane gas was injected into the cell to make the pressure in the cell reach 21MPa and wait for the pressure to be stable. Finally, the water bath temperature was set at 2°C, and the temperature dropped at a constant speed. At the same time, the swing device and the real-time data collection system were turned on.
Analysis of Experimental Results
Control Experimental Results of the Pure Water System
When hydrates are formed, they consume gases and release heat, so a sudden drop in pressure and a sudden rise in temperature are signs of hydrate formation. It can be seen from Figure 2 that there are only two stages in the hydrate formation process, namely, the dissolved nucleation area and a large number of growth areas. The reason is that the high pressure in this experiment leads to a short nucleation time, and dissolution and nucleation are carried out simultaneously. The pressure “sudden drop point” appeared at about 60 min, with the pressure dropping sharply and the temperature suddenly rising slightly. This indicates that a large amount of hydrate starts to form at 60 min. Within 60–150 min, the downward trend slowed down after the pressure dropped significantly, but there was still hydrate formation. The pressure curve does not change at about 800 min, indicating that the response has been completed.
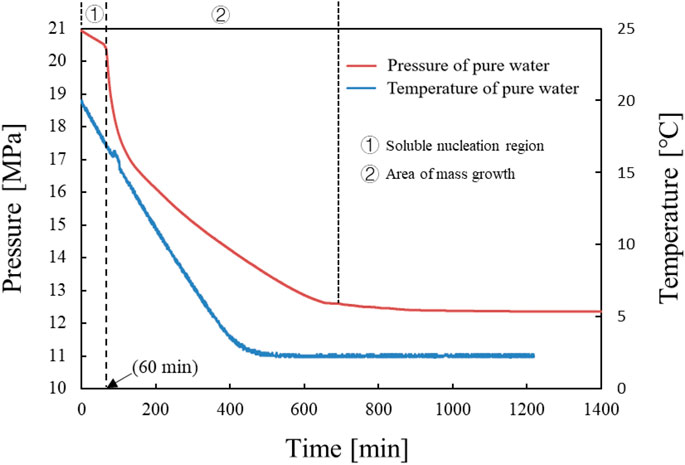
FIGURE 2. Temperature and pressure profiles for hydrate formation in the pure water system.
Figure 3 is the graph of the position of the slider changing with time in the experiment, which is composed of a single position point at different moments. When the hydrate generated in the reactor blocks the slider’s displacement channel, the slider will remain at a certain point or a certain area. This phenomenon is represented in the image as a straight line or a change in the position of an area. According to Figure 3B, the slider position curve indicates that the slider will not move at about 140 min. This indicates that the hydrate has become a dense hydrate, causing the hydrate to clog the reaction kettle. According to Figures 2, 3, it is found that the hydrate plugging point is delayed by 60 min compared with the pressure sudden drop point. This indicates that a large amount of hydrate formation does not necessarily cause immediate wellbore blockage.
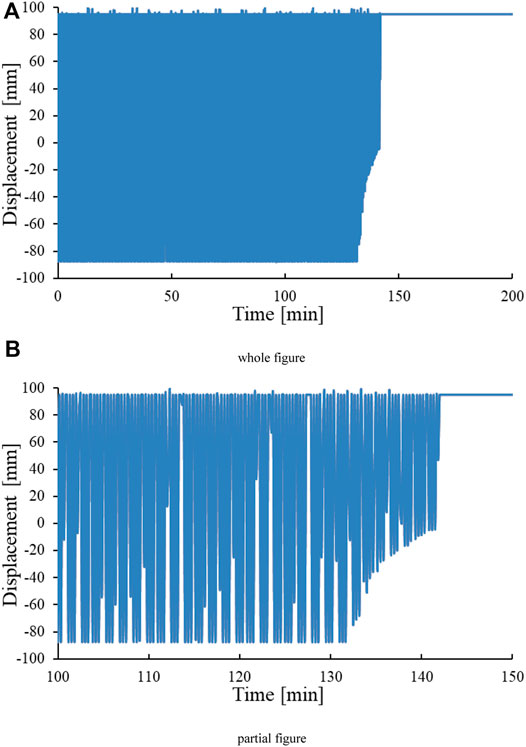
FIGURE 3. Slider position over time in the pure water system. (A) Whole figure. (B) Partial figure.
Inhibition of Hydrate by PVCap
It can be seen from Figure 4 that in the pure water, 0.5wt% PVCap, and 0.8wt% PVCap systems, the time for hydrate formation in large quantities was 80, 140, and 130 min, respectively. The durable supercooling degrees of 0.5wt% PVCap and 0.8wt% PVCap were 4.82°C and 3.82°C, respectively. The effect of 0.5wt% PVCap on hydrate inhibition time and the durable supercooling degree was better. However, 0.5wt% PVCap alone can only maintain 140 min without hydrate formation.
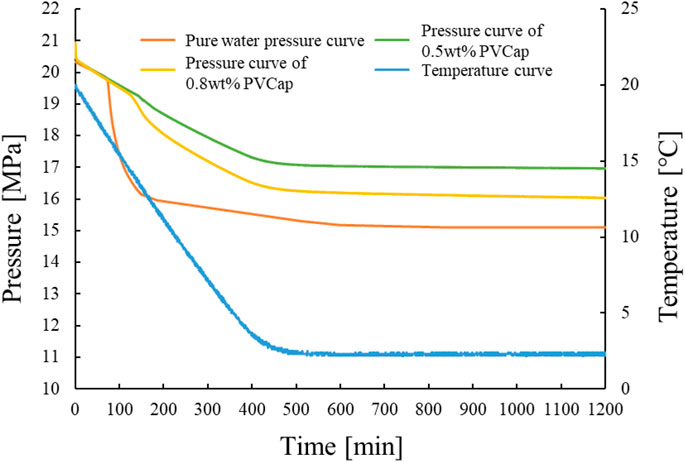
FIGURE 4. Temperature and pressure profiles for hydrate formation with different concentrations of PVCap.
Figure 5 shows that both 0.5wt% PVCap and 0.8wt% PVCap have a prolonged effect on hydrate induction time. The slider stuck in the reactor for 140, 170, and 140 min, respectively, proving that the formation of a large amount of hydrate does not necessarily lead to wellbore plugging immediately.
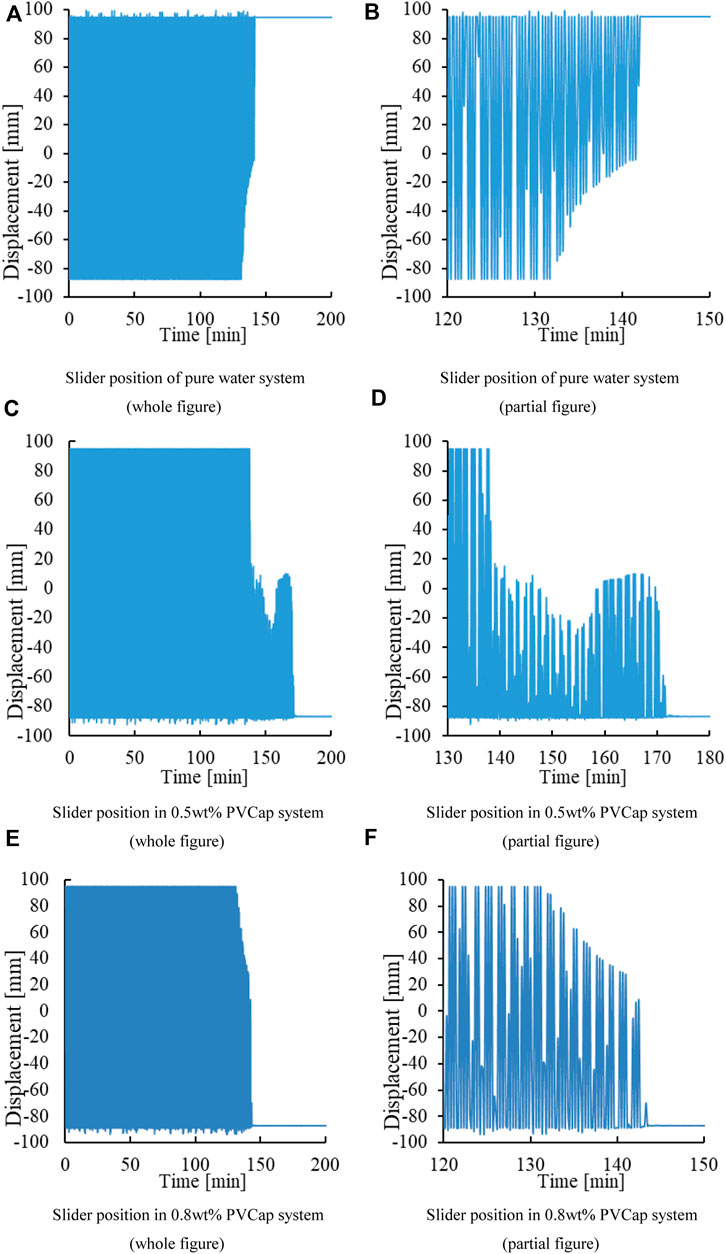
FIGURE 5. Slider positions in pure water and PVCap solutions. (A) Slider position of the pure water system (whole figure). (B) Slider position of the pure water system (partial figure). (C) Slider position in the 0.5wt% PVCap system (whole figure). (D) Slider position in the 0.5wt% PVCap system (partial figure). (E) Slider position in the 0.8wt% PVCap system (whole figure). (F) Slider position in the 0.8wt% PVCap system (partial figure).
The dynamic inhibitor has a certain durable time. After the inhibition time of the hydrate inhibitor, the hydrate will enter into an explosive growth period. At this point, the system pressure drops sharply and a large amount of methane gas forms gas hydrate. The reason is that this experiment is a cooling process, and the low precooling degree makes PVCap molecules better form hydrogen bonds with the hydrate cage structure. They adsorb on the surface of the hydrate cage and prevent water molecules from participating in the formation of the cage structure. At the same time, the cage structure around the inhibitor molecule is destroyed and the hydrate nucleation is delayed. With the decrease of temperature, the driving force of hydrate formation is enhanced with the increase of the subcooling degree. At the same time, PVCap molecules are wrapped around the cage structure and lose their activity. Methane molecules dissolve in large quantities in water molecules and quickly combine to form a complete cage structure. This results in an increase in the hydrate growth rate.
Experimental Results of Different Concentrations of Methanol and PVCap
According to the principle of concentration gradient and considering the general usage in the field, 5, 16, and 20wt% were decided as the methanol dose rate. Figure 6 shows that the inhibition time of 5wt%, 16wt%, and 20wt% methanol was 127, 180, and 255 min, respectively. Figure 7 shows that when 0.5wt% PVCap is mixed with 5wt%, 16wt%, and 20wt% methanol, a large amount of gas hydrate takes 220, 310, and 379 min, respectively, to be formed. According to Figures 6, 7, compared with pure methanol solution, adding 0.5wt% PVCap to methanol solution significantly prolonged the inhibitor time of the hydrate. Experiments show that at the same PVCap concentration, the inhibition time of gas hydrate is greatly extended with the increase of methanol content. It can be seen that adding kinetic inhibitors into the thermodynamic inhibitor system can prolong the hydrate inhibition time. When the field is closed for a short time, the hydrate formation time can be prolonged by adding appropriate kinetic inhibitors to methanol.
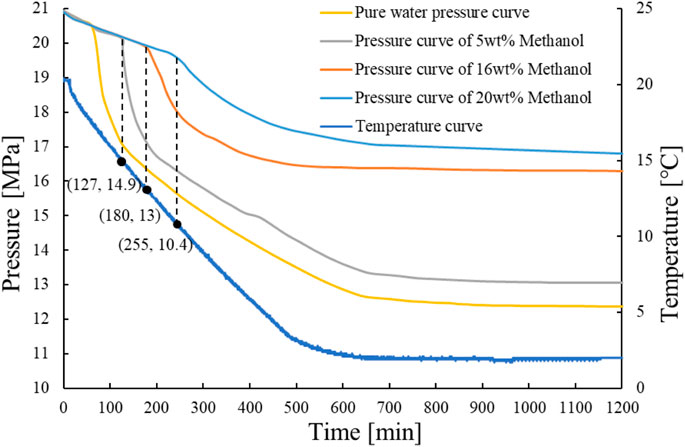
FIGURE 6. Temperature and pressure distributions in methanol solutions of different concentrations.
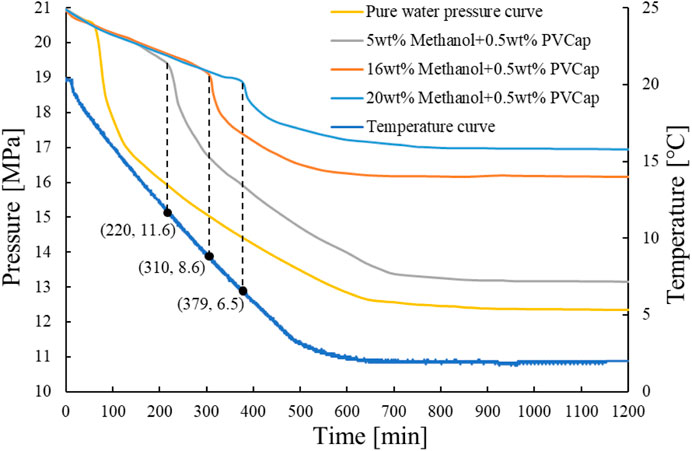
FIGURE 7. Temperature and pressure profile in different concentrations of methanol and PVCap.
As can be seen from Figure 8, in the 0.5wt% PVCap+5wt% methanol system and 0.5wt% PVCap+16wt% methanol system, the time when the slider was stuck was approximately the same as the time when the pressure drop point appeared on the pressure change curve. The slide block of the 0.5wt% PVCap+20wt% methanol system was not stuck in the experimental process. The motion range of the slider in this system is limited at about 800 min. According to the curve of pressure changing with time, the hydrate formation phenomenon appeared in the system around 379 min. This phenomenon indicates that the formation time of the hydrate is different from the blocking time of the passage of swing cell. The reason is that adding a lot of methanol reduces the hydrate production. Hydrate exists in the cell in the form of hydrate slurry. Hydrate slurry, unreacted methane gas, water, and sliders reciprocate along with the swing of the cell. This leads to the continuous aggregation and dispersion of hydrate slurry in the kettle, which cannot be fixed into blocks. This makes the size of the movable area of the slider different, resulting in the formation of the hydrate without blocking the pipeline.
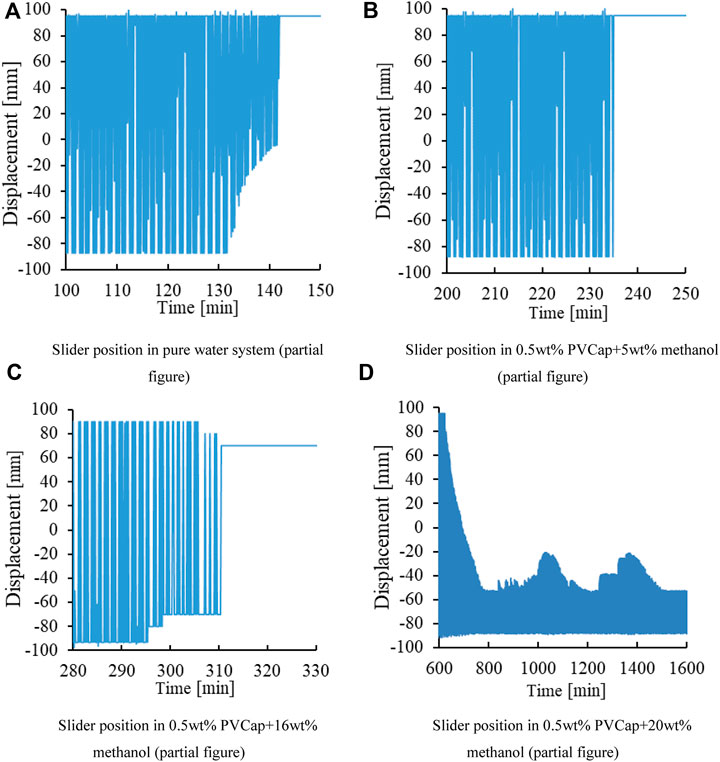
FIGURE 8. Slider position in the PVCap and methanol combination system. (A) Slider position in the pure water system (partial figure). (B) Slider position in 0.5wt% PVCap+5wt% methanol (partial figure). (C) Slider position in 0.5wt% PVCap+16wt% methanol (partial figure). (D) Slider position in 0.5wt% PVCap+20wt% methanol (partial figure).
The temperature and pressure curve during hydrate formation can judge whether hydrate is formed or not. The effect of the inhibitor on the hydrate blocking process can be better analyzed by using the function of measuring the slide position of the swing kettle channel. The simulation is closer to the actual situation.
Gas Consumption and the Hydrate Formation Rate
In the process of hydrate formation, the amount of gas consumed by hydrate formation can reflect the speed of crystal growth in the system. The growth rate of hydrate can be reflected by gas consumption (Sa et al., 2013). In this article, gas consumption within 160 min after hydrate formation is calculated.
Gas consumption is calculated as follows. According to the pressure and temperature before and after the reaction, the gas consumption after the reaction is calculated; thus, the amount of hydrate generated is calculated.
where P is the gage pressure, MPa; V is the volume, cm3; n is the amount of substance, mol; T is the temperature, K; R is the constant, 8.314J/(mol·K); and Z is the gas compression factor, constant. The process is as follows.
According to Eq. 1, the number of substances in the initial gas
where
Since the gas will be consumed during the reaction to form the solid hydrate, the gas volume will change after the reaction.
where V is the volume, ml; M is the molar mass, g/mol; n is the amount of substance, mol;
According to the hydrate formation reaction, Eqs. 3,4 can be calculated in the process of hydrate formation volume 135.07
According to Eq. 1, Δ n gas consumption can be calculated.
where VS is the total volume of the cell volume, ml; VW is the volume of water after the reaction, ml; VH is the volume of the hydrate formed, ml; and VG is the volume of the remaining gas, ml.
By comparing the data in Table 1, it can be seen that the inhibition time of hydrates increases with the increase of methanol concentration in the methanol-only system. Methanol has a good synergism effect on PVCap, and increasing methanol concentration can significantly prolong the induction time of hydrates. The induction time of 0.5wt% PVCap+5wt% methanol hydrate was 230–237 min. The induction time of 0.5wt% PVCap+20wt% methanol hydrate was 372–379 min. The inhibition time of 0.5wt% PVCap and methanol with different concentrations was increased compared with that of methanol alone. Moreover, the inhibition time of hydrates in the 0.5wt% PVCap+5wt% methanol system was extended by 100–107min compared with that in the 5wt% methanol system, which was close to that in the 20wt% methanol system.

TABLE 1. Hydrate amount and formation time.
Conclusion
The results showed that the mixed use of 5wt%, 16wt%, and 20wt% methanol with 0.5wt% PVCap solution was better than that of single use of PVCap. The higher the methanol content, the longer the induction time. The induction time of methane hydrate formation could be significantly prolonged by adding methanol into PVCap aqueous solutions. It is speculated that the thermodynamic inhibitor reduces the subcooling of the system, and the kinetic inhibitor plays a better role at lower subcooling. It indicates that the combined usage of kinetic and thermodynamic inhibitors has a better effect than single use, and the number of thermodynamic inhibitors could be reduced. A certain amount of the kinetic inhibitor could be added into the injected methanol to prolong the inhibition time. It indicates that the combined usage of kinetic and thermodynamic inhibitors could not only prolong the hydrate induction time but also avoid the hydrate blockage, which may provide guidance for planning for on-site shut-in.
Data Availability Statement
The raw data supporting the conclusion of this article will be made available by the authors, without undue reservation.
Author Contributions
YG, LC, and XW contributed to the conception and design of the study. GX organized the database. YW performed the statistical analysis. GX wrote the first draft of the manuscript. YW and CY wrote sections of the manuscript. All authors contributed to manuscript revision, read, and approved the submitted version.
Conflicts of Interest
Author GX was employed by the company Qingdao Marine Engineering and Subsea Equipment Inspection and Testing Co. Ltd. XW was employed by Offshore Oil Production Company, Shengli Oilfield, SINOPEC. CY was employed by China Oilfield Services Limited.
The remaining authors declare that the research was conducted in the absence of any commercial or financial relationships that could be construed as a potential conflict of interest.
Publisher’s Note
All claims expressed in this article are solely those of the authors and do not necessarily represent those of their affiliated organizations, or those of the publisher, the editors and the reviewers. Any product that may be evaluated in this article, or claim that may be made by its manufacturer, is not guaranteed or endorsed by the publisher.
Acknowledgments
The authors gratefully acknowledge the financial support provided by the National Key Research and Development Program of China (2017YFC0307304) and the National Natural Science Foundation of China (No. 51876222).
References
Arrieta, V. V., Torralba, A. O., Hernandez, P. C., García, E. R., Maia, C. T., and Guajardo, M. (2011). Case History: Lessons Learned from Retrieval of Coiled Tubing Stuck by Massive Hydrate Plug when Well Testing in an Ultradeepwater Gas Well in Mexico. SPE Prod. operations 26 (4), 337–342. doi:10.2118/140228-pa
Bavoh, C. B., Lal, B., Partoon, B., Gonfa, G., Khor, F. F., and Shariff, A. (2017). Inhibition Effect of Amino Acids on Carbon Dioxide Hydrate. Chem. Eng. Sci. 171. 331–339. doi:10.1016/j.ces.2017.05.046
Bi, M., Jia, Z. Q., Wu, H. Q., and Wu, F. Y. (2009). Update Progress in Research and Application of Natural Gas Hydrate Inhibitor. Nat. Gas Industry 29 (12), 75–78. doi:10.3787/j.issn.1000-0976.2009.12.024
Cohen, J. M., Wolf, P. F., and Young, W. D. (1998). Enhanced Hydrate Inhibitors: Powerful Synergism with Glycol Ethers. Energy Fuels 12 (2), 216–218. doi:10.1021/ef970166u
Creek, J. L. (2012). Efficient Hydrate Plug Prevention. Energy Fuels 26 (Jul.-Aug), 4112–4116. doi:10.1021/ef300280e
Da, Z., Luo, D., and Liang, W. (2012). Gas Hydrate Prediction and Prevention during DST in Deep Water Gas Field in South China Sea. Richardson, Texas: Abu Dhabi International Petroleum Exhibition & Conference.
Fu, W., Wang, Z., Zhang, J., Cao, Y., and Sun, B. (2020). Investigation of Rheological Properties of Methane Hydrate Slurry with Carboxmethylcellulose. J. Pet. Sci. Eng. 184, 106504. doi:10.1016/j.petrol.2019.106504
Gao, Y., Chen, Y., Chen, L., Ji, G., Wang, K., and Sun, B. (2019). Experimental Investigation on the Permeability of a Hydrate-Bearing Reservoir Considering Overburden Pressure. Fuel 246, 308–318. doi:10.1016/j.fuel.2019.01.166
Gao, Y., Chen, Y., Meng, W., Zhang, C., and Sun, B. (2018). Hydrate Critical Deposition Size in Deep Water Gas Well Test and Sensitive Factors. J. China Univ. Pet. (Edition Nat. Science) 42 (6), 161–170. doi:10.3969/j.issn.1673-5005.2018.06.019
Gao, Y., Chen, Y., Wang, Z., Chen, L., Zhao, X., and Sun, B. (2019). Experimental Study on Heat Transfer in Hydrate-Bearing Reservoirs during Drilling Processes. Ocean Eng. 183 (JUL.1), 262–269. doi:10.1016/j.oceaneng.2019.04.092
Gao, Y., Sun, B., Xu, B., Wu, X., Chen, Y., Zhao, X., et al. (2017). A Wellbore/Formation-Coupled Heat-Transfer Model in Deepwater Drilling and its Application in the Prediction of Hydrate-Reservoir Dissociation. SPE J. 22, 756–766. doi:10.2118/184398-PA
Guan, L., Ren, J., Sun, B., and Gao, Y. (2014). An Optimization of Hydrate Inhibitor and its Injection Method for the Testing of deepwater Gas wells. China Offshore Oil and Gas.
Huo, H. J., Ren, S. R., Wang, R. H., and Hong-Jian, N. I. (2012). Experiment on Synergetic Effects of Kinetic and Thermodynamic Hydrate Inhibitors. J. China Univ. Pet. 36 (5), 110–113. doi:10.3969/j.issn.1673-5005.2012.05.020
Hyunho, K., Wonwo, Y., Youngsub, B., and Yutaek, B. (2018). Economic Evaluation of Meg Injection and Regeneration Process for Oil FPSO. J. Pet. Sci. Eng. 164, 417–426.
Jassim, E., Abdi, M. A., and Muzychka, Y. (2010). A New Approach to Investigate Hydrate Deposition in Gas-Dominated Flowlines. J. Nat. Gas Sci. Eng. 2 (4), 163–177. doi:10.1016/j.jngse.2010.05.005
Kamal, M. S., Hussein, I. A., Sultan, A. S., and von Solms, N. (2016). Application of Various Water Soluble Polymers in Gas Hydrate Inhibition. Renew. Sust. Energ. Rev. 60, 206–225. doi:10.1016/j.rser.2016.01.092
Ke, W., and Kelland, M. A. (2016). Kinetic Hydrate Inhibitor Studies for Gas Hydrate Systems: a Review of Experimental Equipment and Test Methods. Energy Fuels 30 (12), 10015–10028. doi:10.1021/acs.energyfuels.6b02739
Koh, C. A., Sum, A., and Jr, E. (2011). Natural Gas Hydrates in Flow Assurance (2), 13–36. doi:10.1016/C2009-0-62311-4
Lee, W., Shin, J.-Y., Kim, K.-S., and Kang, S.-P. (2016). Kinetic Promotion and Inhibition of Methane Hydrate Formation by Morpholinium Ionic Liquids with Chloride and Tetrafluoroborate Anions. Energy Fuels 30 (5), 3879–3885. doi:10.1021/acs.energyfuels.6b00271
Lee, W., Shin, J.-Y., Kim, K.-S., and Kang, S.-P. (2016). Synergetic Effect of Ionic Liquids on the Kinetic Inhibition Performance of poly(N-Vinylcaprolactam) for Natural Gas Hydrate Formation. Energy Fuels 30 (11), 9162–9169. doi:10.1021/acs.energyfuels.6b01830
Li, J., Gao, Y., Zheng, Q., Sun, B., and Guan, L. (2012). Hydrate Formation Prediction in deepwater Gas Well Testing. Renqiu, China: Oil Drilling & Production Technology.
Liu, W., Hu, J., Li, X., Sun, F., Sun, Z., and Zhou, Y. (2018). Research on Evaluation Method of Wellbore Hydrate Blocking Degree during deepwater Gas Well Testing. J. Nat. Gas Sci. Eng. 59, 168–182. doi:10.1016/j.jngse.2018.08.027
Liu, W., Hu, J., Li, X., Sun, F., Sun, Z., and Zhou, Y. (2018). Research on Evaluation Method of Wellbore Hydrate Blocking Degree during deepwater Gas Well Testing. J. Nat. Gas Sci. Eng. 59, 168–182. doi:10.1016/j.jngse.2018.08.027
Olajire, A. A. (2020). Flow Assurance Issues in Deep-Water Gas Well Testing and Mitigation Strategies with Respect to Gas Hydrates Deposition in Flowlines—A Review. J. Mol. Liquids 318. doi:10.1016/j.molliq.2020.114203
Paz, P., and Netto, T. A. (2020). On the Rheological Properties of Thermodynamic Hydrate Inhibitors Used in Offshore Oil and Gas Production. Jmse 8, 878. doi:10.3390/jmse8110878
Sa, J.-H., Kwak, G.-H., Lee, B. R., Park, D.-H., Han, K., and Lee, K.-H. (2013). Hydrophobic Amino Acids as a New Class of Kinetic Inhibitors for Gas Hydrate Formation. Sci. Rep. 3. doi:10.1038/srep02428
Shen, X.-d., Zhou, X.-b., and Liang, D.-q. (2019). Kinetic Effects of Ionic Liquids on Methane Hydrate. Energy Fuels 33 (2), 1422–1432. doi:10.1021/acs.energyfuels.8b03108
Song, S., Shi, B., Yu, W., Ding, L., Liu, Y., Li, W., et al. (2019). Study on the Optimization of Hydrate Management Strategies in deepwater Gas Well Testing Operations. J. Energ. Resour. Tech. 142 (3), 1–11. doi:10.1115/1.4045168
Vitor de Assis, J., Mohallem, R., Trummer, S., and Franco, E. (2013). Hydrate Remediation during Well Testing Operations in the Deepwater Campos Basin, Brazil. Brazil. doi:10.2118/163881-MS
Wang, Z., Yu, J., Zhang, J., Liu, S., Gao, Y., Xiang, H., et al. (2019). Improved thermal Model Considering Hydrate Formation and Deposition in Gas-Dominated Systems with Free Water. Fuel 236 (JAN.15), 870–879. doi:10.1016/j.fuel.2018.09.066
Wang, Z., Zhao, Y., Sun, B., Chen, L., Zhang, J., and Wang, X. (2016). Modeling of Hydrate Blockage in Gas-Dominated Systems. Energy Fuels 30 (6), 4653–4666. doi:10.1021/acs.energyfuels.6b00521
Wang, Z., Zhao, Y., Sun, B., Chen, L., Zhang, J., and Wang, X. (2016). Modeling of Hydrate Blockage in Gas-Dominated Systems. Energy Fuels 30 (6), 4653–4666. doi:10.1021/acs.energyfuels.6b00521
Wang, Z., Zhao, Y., Sun, B., and Yu, J. (2018). Features and Prevention of Gas Hydrate Blockage in Test Strings of Deep-Water Gas wells. Nat. Gas Industry B 5, 344–350. doi:10.1016/j.ngib.2018.01.008S2352854018300731-
Wu, M., Yang, H., Liang, H., Jiang, H., and Chen, M. (2015). Key Techniques and Practices of Critical Flow Based Tests for Deep Water Exploration wells: a Case Study of Deep Water Area in the Qiongdongnan basin. Nat. Gas Industry. doi:10.3787/j.issn.1000-0976.2015.10.008
Xu, S., Fan, S., Fang, S., Wang, Y., and Lang, X. (2017). Excellent Synergy Effect on Preventing CH4 Hydrate Formation when glycine Meets Polyvinylcaprolactam. Fuel 206 (oct.15), 19–26. doi:10.1016/j.fuel.2017.05.030
ZareNezhad, B., Mottahedin, M., and Varaminian, F. (2015). Experimental and Theoretical Investigations on the Enhancement of Methane Gas Hydrate Formation Rate by Using the Kinetic Additives. Pet. Sci. Tech. 33 (8), 857–864. doi:10.1080/10916466.2015.1010042
Zhang, J., Wang, Z., Liu, S., Zhang, W., Yu, J., and Sun, B. (2019). Prediction of Hydrate Deposition in Pipelines to Improve Gas Transportation Efficiency and Safety. Appl. Energ. 253, 113521. doi:10.1016/j.apenergy.2019.113521
Zhang, W. D., Yin, Z. Y., Liu, X. L., and Ren, S. R. (2007). Experimental Study of Polyvinylcaprolactam as Kinetic Methane Hydrate Inhibitor. Nat. Gas Industry. doi:10.1016/S1872-5813(07)60034-6
Keywords: gas well testing, PVCap, methanol, hydrate formation, inhibiting
Citation: Gao Y, Wang Y, Xin G, Wang X, Yue C and Chen L (2021) Experimental Study on the Effect of Combination of Thermodynamic Inhibitors’ and Kinetic Inhibitors’ Hydrate Inhibition. Front. Energy Res. 9:718673. doi: 10.3389/fenrg.2021.718673
Received: 01 June 2021; Accepted: 05 July 2021;
Published: 18 August 2021.
Edited by:
Jiafei Zhao, Dalian University of Technology, ChinaReviewed by:
Yue Hu, John Wood Group PLC, United KingdomJiaqi Wang, Harbin Engineering University, China
Copyright © 2021 Gao, Wang, Xin, Wang, Yue and Chen. This is an open-access article distributed under the terms of the Creative Commons Attribution License (CC BY). The use, distribution or reproduction in other forums is permitted, provided the original author(s) and the copyright owner(s) are credited and that the original publication in this journal is cited, in accordance with accepted academic practice. No use, distribution or reproduction is permitted which does not comply with these terms.
*Correspondence: Yonghai Gao, dXBjZ2FveWhAMTI2LmNvbQ==