 Hua-chen Xi
 Bing Li
 Wen-hui Mai2
- 1State Key Laboratory of Complex Electromagnetic Environment Effects on Electronics and Information System (CEMEE), Luoyang, China
- 2College of Engineering, Shantou University, Shantou, China
In this paper, a feature extraction method for evaluating the complexity of the Electromagnetic Environment (EME) of the photovoltaic power station is presented by using logarithmic morphological gradient spectrum (LMGS) based on the mathematical morphological theory. We use LMGS to evaluate electromagnetic environment signals. We also explored the impact of structure element (SE) on the MS, MGS, and LMGS. Three types of SE, mean the line SE, square SE and diamond SE, are utilized and compared for computing the LMGS. EME signals with four complexity degrees are simulated to evaluate the effectiveness of the presented method. The experimental results have shown that the feature extraction scheme proposed in this paper is a reasonable method to classify the complexity of EME.
Introduction
With the rapid development of photovoltaic power generation technology and power electronics technology in the 21st century, photovoltaic power generation technology is becoming more and more mature. Human beings have built many large photovoltaic power stations on a large scale and use pollution-free green electric energy. On the other hand, the power of photovoltaic power stations is constantly expanding. Various electronic devices in photovoltaic power stations will produce electromagnetic radiation and form a complex and changeable electromagnetic environment. This will have an important impact on the efficiency of electronic equipment. Therefore, it is of great significance to study the complexity of the electromagnetic environment in photovoltaic power stations (Christoforidis et al., 2013; Wang et al., 2013; Salinas, 2018).
There are few related studies on the electromagnetic environment analysis of photovoltaic power stations, but there are many pieces of research on battlefield electromagnetic environment analysis, which can be used for reference to the electromagnetic environment analysis of photovoltaic power stations.
Tetley et al. proposed the analysis and prediction method of electromagnetic environment based on the mathematical model for the first time and gave the basic model of the electromagnetic environment from the point of view of mathematical analysis (Tetley, 1961). To classify the electromagnetic environment in different complexity degrees, feature extraction of electromagnetic environment signal is a key step. In the past research, diverse features, such as spatial coverage, spectrum occupancy, time occupancy, energy domain average power density spectrum, and so on, have been developed and widely used to evaluate the electromagnetic environment in different complexity degrees (Chen et al., 2010; Zou et al., 2018; Liu et al., 2019; Fu, 2020). Dong and Li (2008) proposed a complexity assessment method of electromagnetic environment based on the Analytic Hierarchy Process (AHP), which refined the evaluation index, defined the evaluation standard parameters, and determined the scaling criterion. Wang and He (2008).introduced multivariate connection number to construct a comprehensive evaluation method of electromagnetic environment complexity, and the weight was set according to the principle of equal distribution. Li et al. (2017).provided a method to evaluate the complexity of electromagnetic environment based on generalized S-transform and probabilistic neural network (PNN), which used generalized S-transform to analyze the interfered sample signals in the electromagnetic environment, extracted signal parameters to train PNN, and classified them. (Li et al., 2013).proposed a new fractal dimension evaluation method based on morphological coverage to evaluate the complexity of the electromagnetic environment. (Li et al., 2019).proposed a method based on S-transform to simultaneously calculated timeshare, frequency share and energy share in the time-frequency domain and used the extreme learning machine to evaluate the environmental complexity. (Yin et al., 2019).proposed an electromagnetic environment assessment algorithm based on Fast S-transform and time-frequency space model. The time complex number, frequency complex number, and energy complex number were calculated at the same time, and F norm and root mean square were selected as evaluation indexes.
As a multi-scale analysis method based on mathematical morphology, mathematical morphological spectrum has been widely used in the field of image processing and feature extraction of mechanical vibration signals (Gao et al., 2015). The main idea is to filter the research object with structural elements of different scales and shapes to express the internal information of the research object.
Mathematical morphological spectrum is a very effective method to deal with image granularity and shape features proposed by Matheron (Matheron, 1975). Its vitality is strong, and it is widely used in image shape and texture feature description, image segmentation, image restoration, image denoising, and other fields. The main idea is to use sieves of different sizes and shapes to filter the image to understand its morphological characteristics. However, the traditional mathematical morphological spectrum is defined based on morphological open operation and difference operator, which is very effective in the analysis of binary images. In the past research, mathematical morphological spectrum has been applied to mechanical fault diagnosis, electronic device fault diagnosis and other fields (Song et al., 2018; Gao, 2019). (Zhao et al., 2018) proposed a method for Fault damage degree Identification based on high-order differential morphology gradient spectral entropy. (Zhao et al., 2020).proposed a performance degradation prediction (HMEPEM) method based on high-order differential mathematical morphology gradient spectral entropy, phase space reconstruction, and limit learning machine, and applied it to predict the performance degradation trend of rolling bearings. (Lv et al., 2014).applied the theory of multi-scale mathematical morphological spectrum and morphological spectral entropy to the vibration fault diagnosis of water pump, which could achieve the purpose of fault diagnosis.
However, previous studies have found that the traditional mathematical morphological spectrum is not very effective in analyzing complex electromagnetic environment signals.
Therefore, the purpose of this paper is to study the application of the mathematical morphological spectrum method in the extraction of characteristic parameters of complex electromagnetic environment signals and to improve the original calculation method of the mathematical morphological spectrum. In this work, we discussed the influence of different types of structural elements and methods on the representation ability of mathematical morphological spectrum, verified the method with a variety of standard signals and electromagnetic environment signals, and compared various morphological spectrums.
The paper is organized as follows. In Logarithmic Morphological Gradient Spectrum, we introduce the mathematical morphological spectrum feature extraction method and support vector machine classification method used in this paper. In Experimental Results, the electromagnetic environment information is simulated, and the signal is tested by the method in Logarithmic Morphological Gradient Spectrum. The experiments are described and commented on in Conclusion.
Logarithmic Morphological Gradient Spectrum
Mathematical Morphological Spectrum
The main idea of the mathematical morphological spectrum is to use structural elements of different scales and shapes to filter the research object, to represent the internal information of the research object. Mathematically, the mathematical morphological particle analysis is defined in the form of set
Where “∘” is the morphological operation symbol,
In the formula, “⊕” is the symbol of morphological dilation operation.
Set a continuous-time domain function f(n), structure-function g(m), then the mathematical morphological spectrum expression of the function f(n) is as follows:
In the formula,
In the form,
The mathematical morphological spectrum can be simplified to the open operation morphological spectrum at scale
Mathematical Morphological Gradient Spectrum
The difference of the function f(n) after the expansion and erosion of the structural element g(m) forms the concept of the function morphological gradient. When processing the signal, the morphological gradient not only considers both the positive and negative pulse information of the signal but also can efficaciously extract the morphological features of the signal (Liu et al., 2016). The morphological gradient operator expression is as follows:
Introducing the concept of morphological gradient into the mathematical morphological spectrum in formula above, the concept of mathematical gradient spectrum (MGS) is obtained (Zhang et al., 2013):
For the one-dimensional discrete signal, considering the extension of the morphological gradient operator, the morphological gradient spectrum can be simplified as follows:
In the formula, the dilate and erode morphology gradient spectrum of
Logarithmic Morphological Gradient Spectrum
Although both mathematical morphology spectrum and mathematical morphology gradient spectrum describe the change law of signal shape at different scales, it is found that the discrimination between EME signal spectral lines with different complexity is very poor by extracting the mathematical morphology spectrum characteristics of EME signal at different scales. The morphological gradient spectral curves calculated at different scales can distinguish EME signals with different complexity, but the distinguishing effect is poor. In this section, the morphological gradient spectrum is logarithmically processed, and the feature extraction method based on the logarithmic mathematical morphological gradient spectrum is adopted. Combined with the properties of logarithmic function and expansion corrosion morphology gradient spectrum, the expansion corrosion morphology gradient spectrum is processed logarithmically. The expression of the logarithmic morphological gradient spectrum on the positive interval is obtained.
Experimental Results
EME Simulation
Photovoltaic Power Station mainly consists of control devices and solar panel area (Wang et al., 2013). The control devices include the inverter cabinet, DC voltage regulator cabinet, DC control cabinet, AC control cabinet and so on. And there are lots of thin-film solar panels of different power in the solar panel area. These devices will produce a variety of electromagnetic signals with different frequencies and amplitudes when they are working, and these devices may not work at the same time, so the occurrence time of electromagnetic signals is not consistent. These various electromagnetic signals constitute the complex electromagnetic environment of photovoltaic power stations together.
Base on this, we simulate a variety of electromagnetic environment signals with different frequencies and apply these signals to construct the electromagnetic environment under the condition of random time and amplitude of the signals. According to the number of signals used, we construct four kinds of electromagnetic environment signals with simple, slight, moderate and severe complexity.
The generated electromagnetic environment signal is shown in Figure 1. The time-domain waveform and spectrum of simple, slightly complex, moderately complex, and severely complex electromagnetic environment signals are arranged from top to bottom.
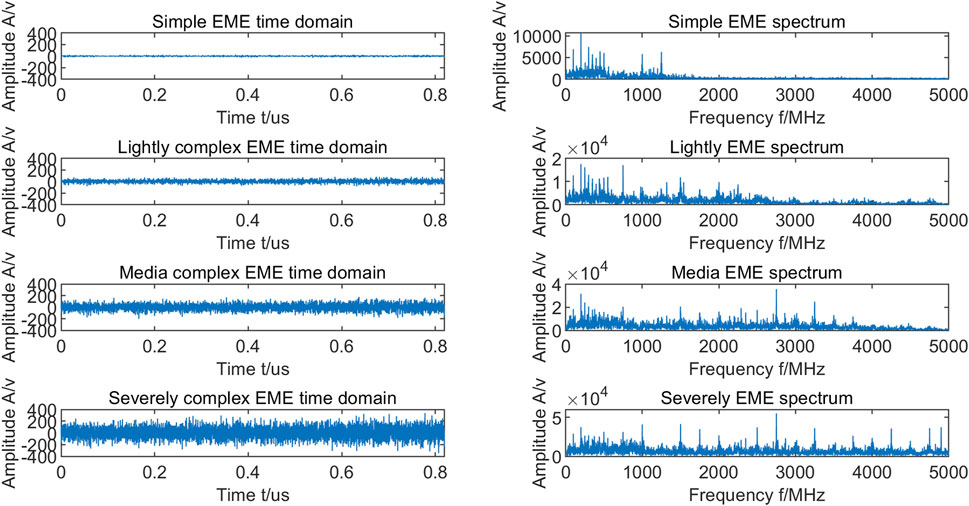
FIGURE 1. Simulation for EME signal.
Feature Extraction
Mathematical Morphological Spectrum
Similar to the filter window in digital signal processing, the scale and shape of SE have an important influence on the calculation results. In this experiment, the line, square and diamond structure elements are used to verify the influence of different shape structure elements on the mathematical shape spectrum.
The mathematical morphological spectrum curves of different electromagnetic environment signals are calculated. The results are shown in Figures 2–4.
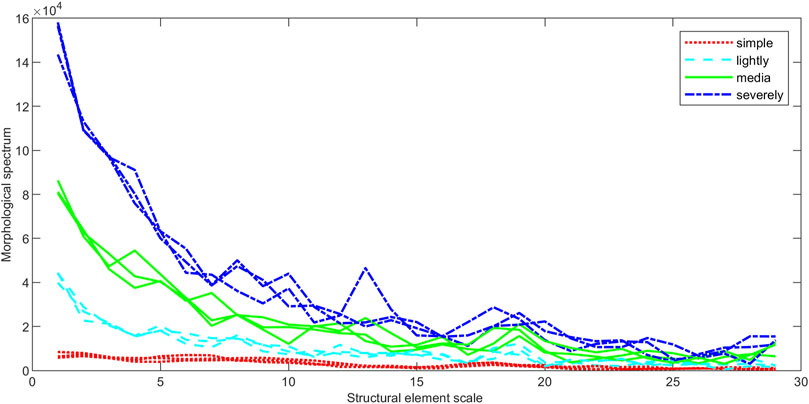
FIGURE 2. MS analysis result of line SE.
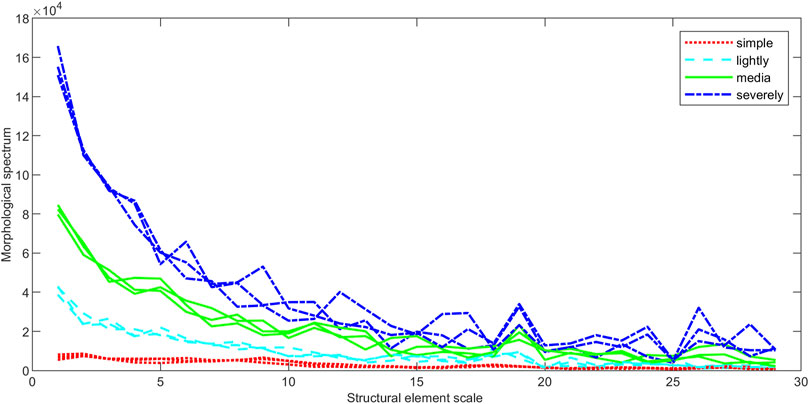
FIGURE 3. MS analysis result of square SE.
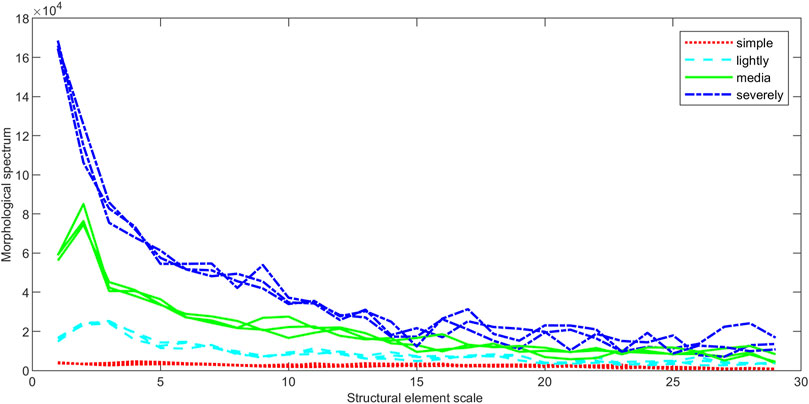
FIGURE 4. MS analysis result of diamond SE.
As the results show, the MS curve fluctuates up and down, and when the scale of the structural elements tends to 20, the curves are interlaced with each other. The morphological spectrum values calculated by the MS method cannot well distinguish the four kinds of EME signals when they are used as features.
Mathematical Morphological Gradient Spectrum
The mathematical morphological gradient spectrum curves of different electromagnetic environment signals are calculated. The structural elements are selected as line, square and diamond. The results are shown in Figures 5–7.

FIGURE 5. MGS analysis result of line SE.
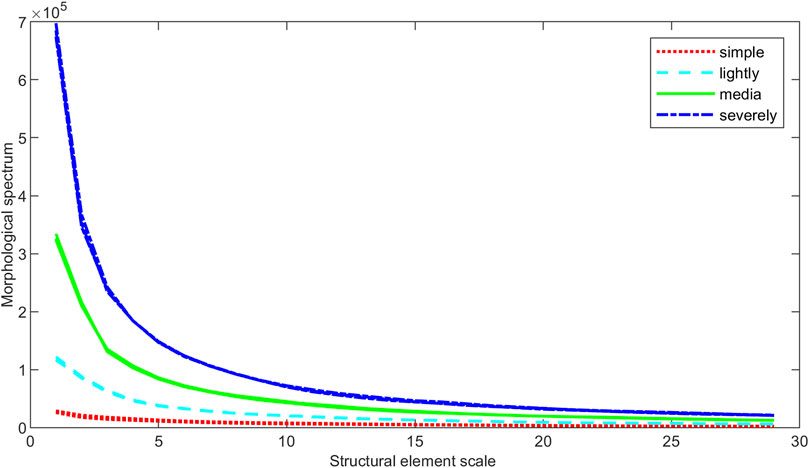
FIGURE 6. MGS analysis result of square SE.
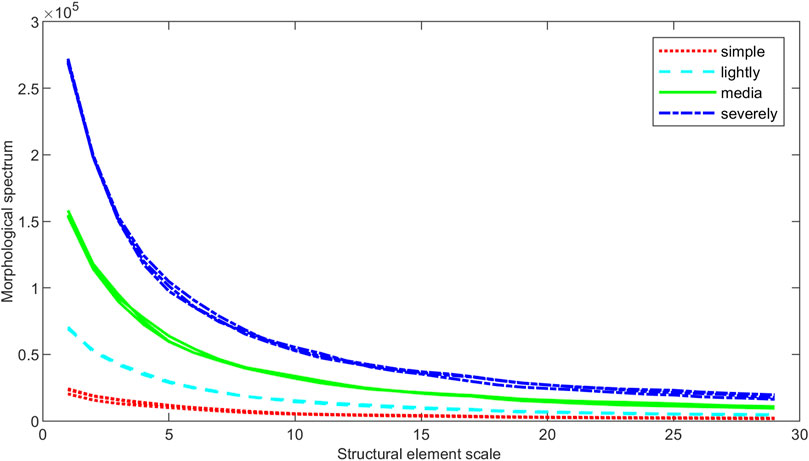
FIGURE 7. MGS analysis result of diamond SE.
As the results show, the trend of the four MGS curves is the same, they all decrease monotonously, and the differentiation is certain when the scale is small, but with the increase of the scale, the differentiation of the four curves decreases.
Logarithmic Mathematical Morphological Gradient Spectrum Feature Extraction
The mathematical morphological gradient spectrum curves of different electromagnetic environment signals are calculated. The structural elements are selected as line, square and diamond. The results are shown in Figures 8–10.
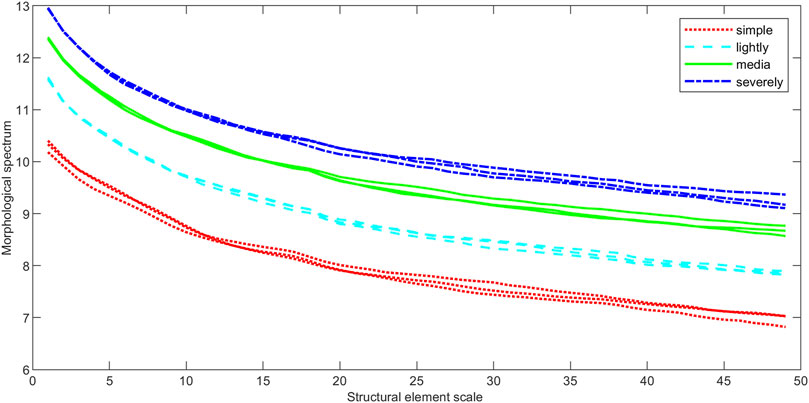
FIGURE 8. LMGS analysis result of line SE.
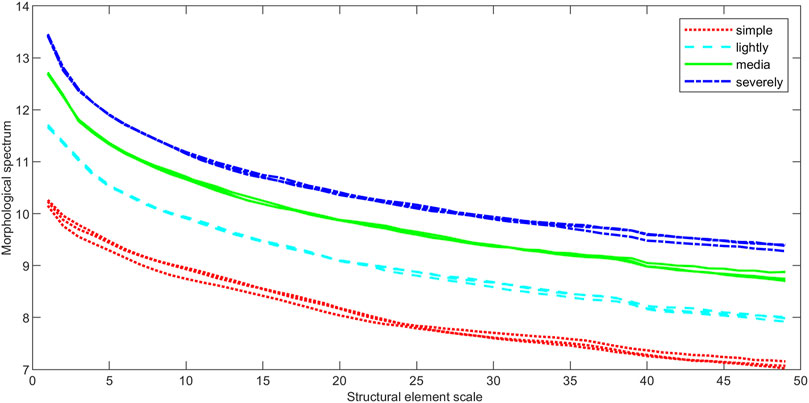
FIGURE 9. LMGS analysis result of square SE.

FIGURE 10. LMGS analysis result of diamond SE.
The LMGS curves of four kinds of complexity EME signals are distinct and have the same trend, and their spectral values all decrease monotonously with the increase of the scale, they are well differentiated.
SVM Classification
The data samples used are all from the feature matrix extracted by mathematical morphological spectrum, mathematical morphological gradient spectrum, and logarithmic mathematical morphological gradient spectrum. After training the SVM through the training data, the test data is classified to obtain classification accuracy. The process is repeated 50 times, and the average classification accuracy of different types of support vector machines is shown in Table 1.
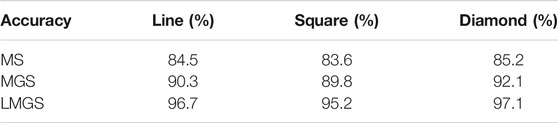
TABLE 1. Classification accuracy.
Through support vector machine classification, the classification effect obtained by LMGS is the best, and the classification effect obtained by MS and MGS is worse than LMGS. For line, square, and diamond structure elements, the results have shown that the diamond SE acquires the best performance on distinguishing the four EME complexity degrees.
Conclusion
This work has proposed an effective feature extraction method by using the logarithmic morphological gradient spectrum for evaluating the EME complexity degree of the photovoltaic power station. The EME signals with four complexity degrees are simulated to verify the effectiveness of the presented method. We use MS, MGS, and LMGS to evaluate electromagnetic environment signals. The experimental results have shown that LMGS can effectively distinguish the complexity of EME and show better performance than MS and MGS.
We also explored the effects of the structure elements, mean line, square, and diamond on t distinguishing the EME complexity degrees. Results have shown that the diamond SE acquires the best performance in distinguishing the four EME complexity degrees. Our research has shown that the feature extraction method of logarithmic morphological gradient spectrum is an ideal technique to evaluate the complexity of electromagnetic radiation of photovoltaic power stations.
Data Availability Statement
The original contributions presented in the study are included in the article/supplementary material, further inquiries can be directed to the corresponding author.
Author Contributions
HX contributed to conceptualization, data curation, methodology, and writing—original draft. BL contributed to formal analysis, visualization, and resources. WM, XX, and YW wrote sections of the manuscript. All authors contributed to manuscript revision, read, and approved the submitted version.
Funding
This research was funded by the Open Foundation of the State Key Laboratory of Complex Electromagnetic Environment Effects on Electronics and Information System (CEMEE 2020Z0101B) and the Start-up research projects of Shantou University (NTF19016).
Conflict of Interest
The authors declare that the research was conducted in the absence of any commercial or financial relationships that could be construed as a potential conflict of interest.
Publisher’s Note
All claims expressed in this article are solely those of the authors and do not necessarily represent those of their affiliated organizations, or those of the publisher, the editors and the reviewers. Any product that may be evaluated in this article, or claim that may be made by its manufacturer, is not guaranteed or endorsed by the publisher.
References
Chen, Y., Zhang, D., Qian, P., Wang, X., and Xiao, D. (2010). Review on Battlefield Electromagnetic Environment Quantitative Analysis. Electron. Inf. Warfare Tech. 25, 44–51.
Christoforidis, G. C., Papadopoulos, T. A., Parisses, C., and Mantzaras, G. E. (2013). Photovoltaic Power Plants as a Source of Electromagnetic Interference to Metallic Agricultural Pipelines. Proced. Tech. 8, 192–199. doi:10.1016/j.protcy.2013.11.027
Dong, Y., and Li, Q. (2008). Complexity Evaluation of Artificial Electromagnetism Environment Based on AHP. Command Control & Simulation 30, 106–110.
Fu, S. (2020). A Multi-Level Evaluation Method of Complex Electromagnetic Environment Based on Four-Domain Feature. Telecommunication Eng. 60, 1048–1054.
Gao, B. (2019). Feature Extraction of Performance Degradation of Mechanical Parts Based on Mathematical Morphological Spectral Entropy. Mech. Electr. Inf. 27, 115–116. doi:10.19514/j.cnki.cn32-1628/tm.2019.27.063
Gao, B., Liu, J., and Li, G. (2015). Fault Feature Extraction for Gearbox Bearing Using Improved Pattern Spectrum. J. Vibration Eng. 28, 831–838. doi:10.16385/j.cnki.issn.1004-4523.2015.05.019
Li, B., Jun, D., Cong, L., and Yuan, L. (2013). Evaluating the Complexity Degree of Electromagnetic Environment Utilizing Morphological Covering Based Fractal Dimension. IEEE 11th International Conference on Electronic Measurement & Instruments, 617–620. doi:10.1109/ICEMI.2013.6743181
Li, R., Wang, K., and Wang, B. (2015). The Method of Grey Markov Remaining Service Life Prediction Specific to Generalized Mathematical Morphological Particle. J. Vibration Eng. 28, 316–323. doi:10.16385/j.cnki.issn.1004-4523.2015.02.019
Li, Y., He, G., and Yin, Q. (2017). Electromagnetic Environment Complex Evaluation Based on S-Transform and PNN. J. Hunan University(Natural Sciences) 44, 123–129. doi:10.16339/j.cnki.hdxbzkb.2017.10.017
Li, Y., He, Y., and Yin, B. (2019). Evaluation Method for Complex Electromagnetic Environment. Jaciii 23, 891–897. doi:10.20965/jaciii.2019.p0891
Liu, H., Guo, J., and Liu, J. (2019). An Evaluation Method of Electromagnetic Environment Complexity Based on Two-Dimensional Entropy of Image. Electron. Inf. Warfare Tech. 34, 70–74+88.
Liu, P., Li, R., and Xu, H. (2016). A Performance Degradation Feature Extraction Method and its Application Based on Mathematical Morphological Gradient Spectrum Entropy. J. Vibration Shock 35, 86–90. doi:10.13465/j.cnki.jvs.2016.16.015
Lv, S., Lin, T., Liang, X., and Liu, X. (2014). Diagnostic Research on Vibration the Faults of Pumps Based on Mathematical Morphology. China Rural Water and Hydropower 2, 110–113.
Salinas, E. (2018). Some Aspects of Electromagnetic Interference, Electromagnetic Compatibility and Geomagnetic Induced Currents. J. Phys. Conf. Ser. 1143, 012030. doi:10.1088/1742-6596/1143/1/012030
Song, G., Zhang, W., Chen, H., Lin, T., and Zhou, B. (2018). Open-circuit Fault Diagnosis of Inverter Transistor Based on Mathematical Pattern Spectrum. J. Power Supply 16, 159–166. doi:10.13234/j.issn.2095-2805.2018.5.159
Tetley, W. (1961). Analytical Prediction of Electromagnetic Environments. IEEE Trans. Commun. 9, 175–185. doi:10.1109/TCOM.1961.1097669
Wang, F., Zhao, Z. B., and Zhang, H. (2013). Test Analysis on the Electromagnetic Environment of Photovoltaic Power Transmission System. Amr 805-806, 40–44. doi:10.4028/www.scientific.net/AMR.805-806.40
Wang, G., and He, J. (2008). Complexity Evaluation Method of Battlefield Electromagnetic Environment Based on Multivariate Connection Number Model. Electron. Inf. Warfare Tech. 23, 50–53.
Yin, B. Q., Wang, S. D., He, Y. G., Zuo, L., Li, B., and Cheng, Z. (2019). Electromagnetic Environment Complex Evaluation Algorithm Based on Fast S-Transform and Time-Frequency Space Model. J. Electro. Inf. Tech. 41, 195–201. doi:10.11999/JEIT180256
Zhang, K., Cheng, S., and Yang, Y. (2013). Rotating Machinery Fault Diagnosis Based on Local Mean Decomposition and Pattern Spectrum. J. Vibration Shock 32, 135–140. doi:10.13465/j.cnki.jvs.2013.09.016
Zhao, H., Liu, H., Xu, J., and Deng, W. (2020). Performance Prediction Using High-Order Differential Mathematical Morphology Gradient Spectrum Entropy and Extreme Learning Machine. IEEE Trans. Instrum. Meas. 69, 4165–4172. doi:10.1109/TIM.2019.2948414
Zhao, H., Yao, R., Xu, L., Yuan, Y., Li, G., and Deng, W. (2018). Study on a Novel Fault Damage Degree Identification Method Using High-Order Differential Mathematical Morphology Gradient Spectrum Entropy. Entropy 20, 682. doi:10.3390/e20090682
Keywords: electromagnetic environment, photovoltaic power station, mathematical morphological spectrum, evaluation, feature extraction
Citation: Xi H-c, Li B, Mai W-h, Xu X and Wang Y (2021) Photovoltaic Power Station Electromagnetic Environment Complexity Evaluation Utilizing Logarithmic Morphological Gradient Spectrum. Front. Energy Res. 9:713501. doi: 10.3389/fenrg.2021.713501
Received: 23 May 2021; Accepted: 23 June 2021;
Published: 26 July 2021.
Edited by:
Yaxing Ren, University of Warwick, United KingdomReviewed by:
Qintao Gan, Army Engineering University of PLA, ChinaZ. Jn, National University of Defense Technology, China
Copyright © 2021 Xi, Li, Mai, Xu and Wang. This is an open-access article distributed under the terms of the Creative Commons Attribution License (CC BY). The use, distribution or reproduction in other forums is permitted, provided the original author(s) and the copyright owner(s) are credited and that the original publication in this journal is cited, in accordance with accepted academic practice. No use, distribution or reproduction is permitted which does not comply with these terms.
*Correspondence: Bing Li, cm9tbWFuZHlAMTYzLmNvbQ==