- 1Center for Social Security Studies, Wuhan University, Wuhan, China
- 2School of Political Science and Public Administration, Wuhan University, Wuhan, China
- 3Economics and Management School, Wuhan University, Wuhan, China
- 4School of Political Science and Public Administration, Wuhan University, Wuhan, China
Energy intensity measured by energy consumption per unit of GDP has always been the main assessment indicator for the design of energy-saving policies, but its accuracy is highly dependent on the reliability of GDP data. This paper finds that the indicator accuracy is improving after the central government has included energy intensity into the performance appraisal system for local officials. This means that the energy-saving target-based performance evaluation has restrained the data misrepresentation behavior of local officials. Further mechanism analysis shows that the pressure of energy saving restricts the development of the industrial sector, which weakens the ability of local governments to manipulate GDP data, thus improving the accuracy of energy intensity statistics. These findings provide some insightful references for China’s future green development and policy design.
Introduction
Energy intensity, calculated by energy consumption per unit of GDP, is an important measure of energy efficiency. This indicator takes both the economic growth and policy objectives of energy saving into account, which is widely used for public policy and academic research (Zhang et al., 2011; Shi, 2014). China, the world’s largest energy consumer, has taken a series of measures to achieve the goal of reducing energy intensity, thus promoting green development. Among them, the 11th (2006–2010) and the 12th (2011–2015) Five-Year Plan (FYP) put forward a binding target of energy intensity reduction (Song and Zheng, 2012; Li H. et al., 2016). Moreover, the national target was allocated to the provincial level, and the energy-saving target was for the first time to be incorporated into the performance evaluation system for the local officials (Zhang et al., 2019). The political system in China is centralized, and thus, the local government is responsible for national policies (Xiong, 2018; Lo, 2020). The top–down target-based responsibility system ensures that the local officials are tied to satisfying the required mandates for career concerns as the energy intensity reduction has positive effects on the promotion probability (Zheng et al., 2014; Chen et al., 2018).
The previous studies comprehensively analyzed the influencing factors of China’s energy intensity from the aspects of technological progress, industrial structure adjustment, and policy regulation (Zhang et al., 2020). However, most studies ignored that the calculation accuracy of energy intensity basically depends on data reliability. For a long time, there has been a dispute about authenticity and accuracy of local government GDP data. For example, at the end of 2015, the Xinhua News Agency reported that data manipulation of GDP was rampant in Northeast China. Moreover, in 2017 and 2018, some local governments, such as Liaoning, Inner Mongolia, and Tianjin, admitted that there was fraud in the past GDP data, which reduced the historical economic growth significantly. Some scholars also believe that the official GDP data seriously overestimate the economic growth rate (Rawski, 2001; Young, 2003). In view of this, the data accuracy of energy intensity is doubtful. Zhang et al. (2019) demonstrated that the energy intensity of most provinces in China was overestimated during 2006–2010 after correcting the GDP growth rate.
As mentioned above, to achieve the policy goals of energy saving, the central government included energy intensity into the performance evaluation for local officials during the 11th and the 12th FYP, requiring the local government to meet corresponding targets of energy intensity reduction. So, on the one hand, it is obvious that the overestimation of GDP data cannot only provide excellent economic growth performance but also make it easier to achieve the goals of energy intensity reduction (Lo, 2014; Lo, 2020). This provides a higher incentive for local governments to falsely report economic growth data, which may further weaken the data accuracy. However, on the other hand, energy consumption is highly correlated with GDP growth in the short term, and it is relatively difficult to manipulate energy consumption data (Wallace, 2016). If GDP statistics are blindly improved without corresponding increase in energy consumption, it will raise a question and then increase the risk of false data being found (Rawski, 2001). From this point of view, the central government includes the energy intensity indicators into the performance evaluation for local officials, which may inhibit the GDP misrepresentation and improve the accuracy of energy-saving data. Therefore, the impact of target-based performance evaluation on the energy data accuracy is an effort worth studying. Moreover, in the era of big data, the utilization of information technologies may provide opportunities to strengthen the supervision of behaviors of the central government, thus helping to promote statistical data accuracy.
Based on the study of Henderson et al. (2012), this paper firstly corrects the GDP growth rate by using nighttime lighting data and then calculates the change rate of energy intensity more accurately on this basis. The accuracy of energy intensity is represented by the difference between the revised change rate in energy intensity and the official change rate. Finally, it is analyzed whether the target-based assessment enlarges or narrates the above gap, that is, it weakens or improves the accuracy of energy-saving data. Our research suggests that official data do generally overstate the decline in energy intensity across regions, thanks to widespread GDP misreporting. Further study on the effect of energy conservation policies shows that the inclusion of energy intensity in the performance appraisal system for local officials improves the data accuracy. Specifically, the main mechanism is the decline of the industrial share in economic output.
Our paper contributes to the literature in the following two aspects. First, although previous studies have pointed out that energy-efficiency policy is an important factor affecting China’s energy intensity, they have not taken into account that policy design may also affect the energy data quality. Our findings provide direct evidence of how energy-efficiency target-based performance evaluation policies affect the energy data accuracy. Second, the study sheds light on a growing body of literature on government data manipulation. Previous studies have found that government target assessment can affect the quality of statistical data (Chen et al., 2012; Ghanem and Zhang, 2014; Wallace, 2016), but our results reveal that the statistical data quality has improved.
This paper is organized as follows. Literature Review reviews the related research. Estimation Strategy introduces the research methods, variable construction, and data source. Specifically, we recalculate the change rate in energy intensity to infer the official statistical data accuracy by using the nighttime lighting data. Main Results mainly empirically discusses the impact of target-based performance evaluation on the accuracy of energy-saving data. Finally, Conclusion and Policy Implications concludes this article.
Literature Review
The existing studies comprehensively analyze the influencing factors of China’s energy intensity change from various aspects. For example, Zhang et al. (2020) found that better access to credit can improve energy efficiency measured by energy intensity. Xue and Wang (2021) demonstrated that mitigation of financial pressure makes a significant contribution to the energy intensity reduction. Lin and Zhu (2021) confirmed the new-type urbanization or human-centered urbanization has a positive effect on energy intensity. Overall, energy intensity is an important indicator for evaluating the performance of local officials. Especially since the 11th FYP, this indicator has been included in the performance evaluation for local officials. However, most of the studies measure energy intensity using the official data without considering data reliability.
Since data misreporting is nothing new, several studies have shown that many governments deliberately manipulate official statistics for specific purposes (Li P. et al., 2016). For example, in order to meet the economic conditions of joining the EU, Italy and Greece have deliberately understated their budget deficits (Barber and hope, 2010). Michalski and Stoltz (2013) found that the balance of payments data sometimes does not conform to the statistical distribution law and thus inferred that the government might make strategic data misrepresentation. The opposite data manipulation also exists, and not only for the bad economic situation. Kerner et al. (2014) revealed that some countries would deliberately lower their per capita national income in order to obtain concessional loans from the World Bank. Research on China’s official data manipulation is mainly related to the top–down official assessment system (Edin, 1998). Kung and Chen (2011) found that, during 1958–1960, local officials falsely reported grain output to cater to the goals of their superiors, resulting in excessive grain purchase and serious difficulties in the national economy. Chen et al. (2012) and Ghanem and Zhang (2014) analyzed the air pollution data at the city level and revealed that there is a discontinuous breakpoint when the air pollution concentration is at the critical point of the “blue sky” standard, which indicates that the local government may satisfy the air quality assessment standard through data fraud. Wallace (2016) measured the promotion-oriented data fraud by the difference between the official GDP growth rate and the electricity consumption growth rate and found that the gap is larger than that in other periods during the change of government officials.
Given that the Chinese central government has set a series of mandatory targets for energy conservation and environmental protection, many studies also have focused on the issues on the target-based responsibility scheme. For example, Lo (2014) proved that the energy conservation target responsibility system has been constrained by problems including weak targets and lack of reliable local energy statistics. Li H. et al. (2016) highlighted that the national energy intensity target cannot be fully disaggregated without omissions. Chen et al. (2018) estimated how local officials respond to an emission reduction target–based performance evaluation system and found that the performance evaluation system leads to the decrease in SO2 emission with the decline of cost of GDP growth rate. Lo (2020) examined the key aspects and limitation of the energy conservation target responsibility system in China.
In general, although the existing literature has done a more detailed study on energy intensity, few literature works discuss whether the target-based performance evaluation of local government improves or worsens the quality of energy-saving statistics. In this paper, the distortion of energy intensity statistical index caused by the false report of the GDP data is eliminated by using nighttime lighting data. Based on this, the impact of the assessment of energy conservation policies on the accuracy of energy data during the 11th and the 12th FYP is discussed, thus making up for the deficiencies of the existing research.
Estimation Strategy
Estimation Framework
The main objective of our empirical analysis is to test the effect of energy intensity reduction regulation on data accuracy. The time and spatial variation of the reduction target of the 11th and the 12th FYP since 2006 provides an opportunity to implement the difference in difference (DID) method. Specifically, before 2006, namely, the first year of the 11th FYP, the regulation stringency of energy intensity reduction ratio was almost uniform across the provinces. However, some provinces face a stringent energy intensity reduction mandate assigned by the central government. Thus, the DID estimation compares the provincial data accuracy of energy intensity before and after 2006 with more stringent targets relative to lax targets. The DID estimation specification is set as follows (Beck et al., 2010; Li P. et al., 2016; Chen et al., 2018; Shi and Xu, 2018):
where
The positive value of
Variable Construction
As mentioned, the difference in the revised energy intensity change rate and official data is the explained variable in our paper. However, this indicator cannot be obtained directly. The energy intensity indicator is usually measured by energy consumption per unit of GDP. Especially, energy consumption data involve the specific performance in terms of power grid companies and other units, which does not interfere with the GDP pursuit of local officials, and thus, there is limited room and motivation for manipulation. Therefore, it is usually recognized that energy consumption data are more real and exact as it is relatively difficult to manipulate energy consumption data (Wallace, 2016). However, the past evidence shows the GDP data in China have likely been manipulated (Xu et al., 2015). To calculate this indictor, our basic idea is to revise the GDP growth rate with nighttime lighting intensity and then measure data accuracy of energy intensity by using the revised GDP growth rate. The specific setting and calculation are described in detail as follows.
Estimating GDP Growth Rate Based on Nighttime Lighting Intensity
To revise the GDP growth rate based on nighttime lighting intensity, we first need to accurately measure the correlation between nighttime lighting intensity and economic growth. Thus, we have the following regression specification:
where
Based on Henderson et al. (2012), we estimate the growth rate of real GDP with the following ideas. We assume that the statistical relationship among the real GDP growth rate, official GDP growth rate, and light intensity growth rate satisfies the following conditions:
where
The correlation coefficient between
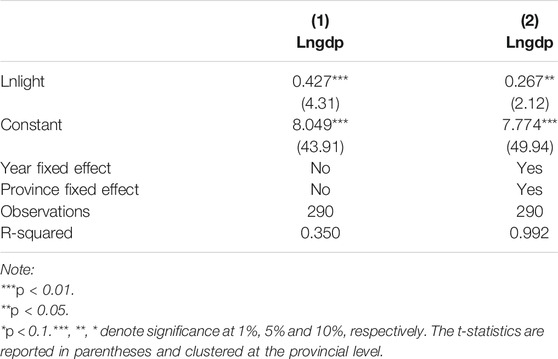
Based on the method mentioned above, we empirically test the relationship between GDP and nighttime lighting intensity. Table 1 shows the regression results from Eq. 2. The results show that there is a significant positive relationship between nighttime lighting intensity and GDP, which is very close to the result of Henderson et al. (2012). They found that the correlation coefficient was about 0.28.
Furthermore, to correct the GDP growth rate, we need to assign an appropriate value to Eq. 8, that is, to determine the respective weight of the official GDP growth rate and the nighttime lighting intensity growth rate. Based on the findings in Table 1, we choose the results in column (2) with
Measuring Data Accuracy of Energy Intensity
The energy intensity indicator is usually measured by energy consumption diving GDP. Thus, the change rate of energy intensity is equal to the difference between the change rate of energy consumption and the GDP growth rate. Given the unchanged energy consumption growth rate, different measures on the GDP growth rate will lead to different change rates of energy intensity. This paper applies the difference in the revised ratio of energy intensity change and official data to measure the data accuracy (gap). The higher value always means lower data accuracy of energy intensity due to false statistical data issued by the local officials.
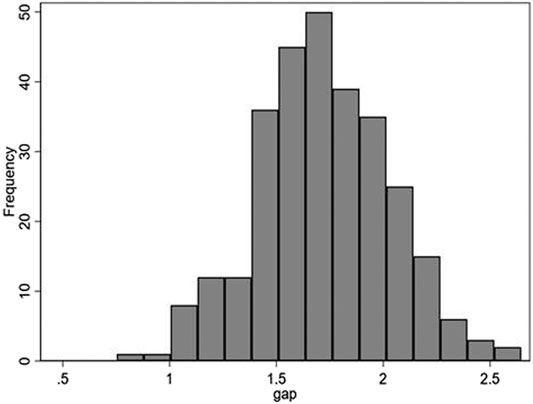
Based on the revised GDP growth rate, we also calculate the change rate of energy intensity with a constant rate of energy consumption. Then, the difference between the revised and the official energy intensity change rates can be obtained, namely, the degree of data distortion (gap). As mentioned, this indicator is applied to measure the data accuracy of energy intensity. Figure 1 shows the distribution frequency of these data. We find that the value of
Data Source
Our sample contains 29 provinces, cities, and autonomous regions over 2003 to 2012 in China. Though the sample period is limited to 2012 as the nighttime light data are not available since then, the empirical findings are still valuable and relevant (Li P. et al., 2016; Chen et al., 2018; Jia et al., 2021) because the indicator assessment applied by the central government in the 11th and the 12th FYP is rather similar. Due to data limitation, Xinjiang, Tibet, Taiwan, Hong Kong, and Macao are not included in this paper. The original data of global nighttime lighting intensity come from the US Defense Meteorological Satellite Project (DMSP-OLS), which includes global nighttime lighting images from 1992 to 2012 obtained by several satellites. The saturation value of the pixel gray value (DN value) is 63, with the problem that the DN value obtained by different sensors in the same year is different. Especially, the existing raw data of satellite nighttime lighting face the problems of discontinuity and saturation (Donaldson and Storeygard, 2016). Therefore, we use the lighting image correction method including inter-calibration and intra-annual composition based on the invariant target area to correct the original lighting image data and get the provincial lighting intensity value (light) from 2003 to 2012 (Liu et al., 2012), which can more reasonably reflect the regional economic development differences. This method is widely used in the literature to correct the long time series nighttime lighting image data (Henderson et al., 2012; Wu et al., 2013; Jia et al., 2021).
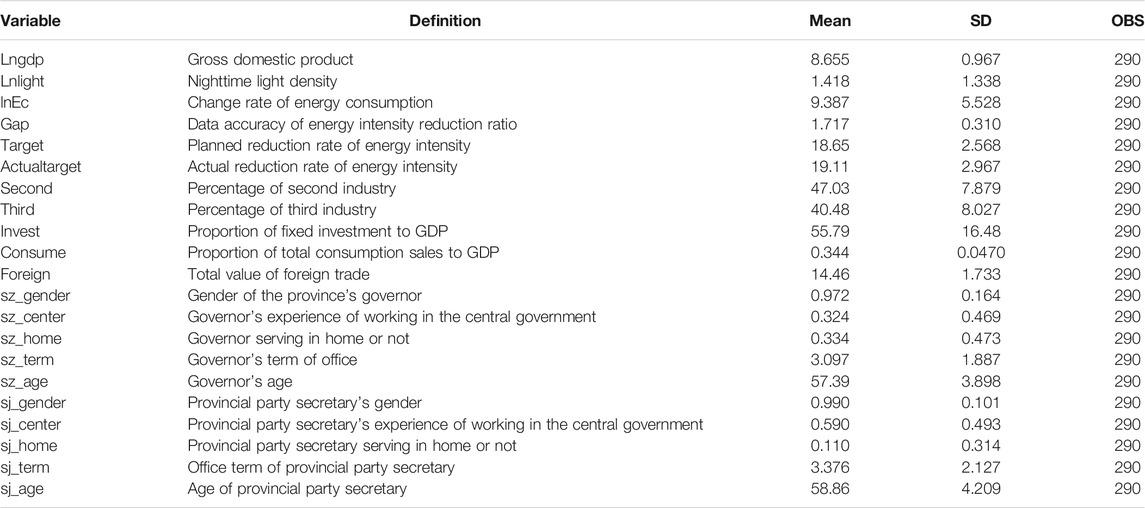
Provincial energy data mainly include the change rate of energy consumption index (lnEc), the planned rate of energy intensity reduction (target), and the actual reduction rate of energy intensity (actualtarget). The data are mainly from China Statistical Yearbook, China Energy Statistical Yearbook. Other provincial economic indicators are all derived from China Statistical Yearbook. In addition, we have manually collected the personal information of provincial officials (secretary of the provincial party committee and governor) from government websites and Baidu Encyclopedia. The descriptive statistics are shown in Table 2.
Main Results
This section mainly analyzes the impact of energy-saving policy target assessment on the accuracy of energy statistics. In addition to baseline estimates, we also conduct a series of robust tests, including a parallel trend test, a placebo test, and replacement of the explained variable. Furthermore, we also study the regional heterogeneity and verify the influence mechanism.
Baseline Estimation
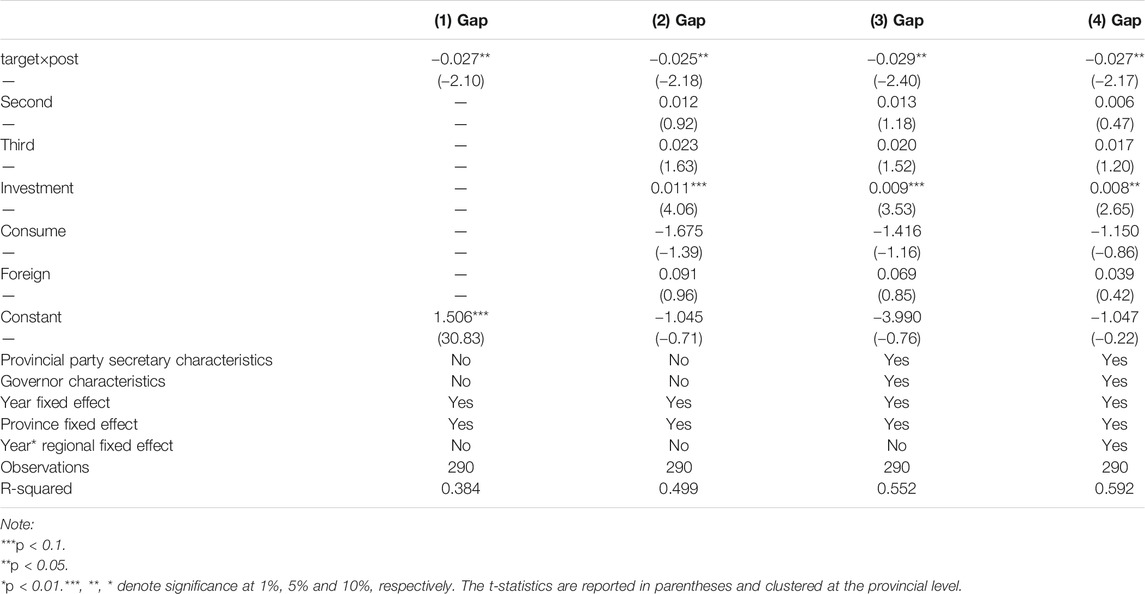
Table 3 reports the main results of the effect of target assessment on the data accuracy of energy intensity from Eq. 1. Only province and year fixed effects are included in the first column, and the estimated results show that the assessment policy significantly improves the data accuracy. This means that the energy conservation assessment started in 2006 has a significant constraint or regulation effect on the behavior of local governments, making them less prone to fraud in energy intensity data statistics.
Provincial economic characteristics are introduced as control variables in column (2). We find that the provinces with a higher proportion of fixed asset investment to GDP have lower data accuracy of energy intensity. In column (3), the personal characteristics of provincial officials are controlled, and the results are still robust. In addition, in order to control the influence of time-varying unobservable factors at the regional level on the dependent variable, the interaction term of year and regional fixed effects in eastern, central, and western regions is further added in column (4), and the results are highly consistent with the findings in columns (1)–(3).
As shown in Table 3, the estimation coefficient between the target assessment intensity and the energy intensity data accuracy is always statistically significantly negative. This shows that the energy-saving target-based performance evaluation since 2006 has led to a significant improvement in data accuracy. In an economic sense, if energy intensity target assessment intensity changes by a standard deviation, the degree of data distortion will decrease by about 13.7% (
Robustness Checks
To further verify our results are robust, we report a series of robustness checks, including a parallel trend test, a placebo test, and replacement of the explained variable.
Parallel Trend Test
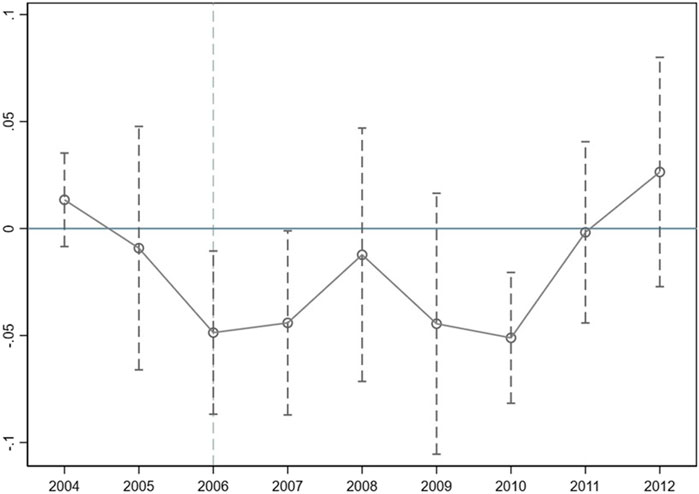
A necessary condition for supporting our identification is that provinces with different target assessment have similar time trends on the outcomes before and after treatment. This means that the differences of assessment requirements faced by different provinces before 2006 will not affect the accuracy of the previous data. Thus, we use the event study approach (Chen et al., 2018). The estimation specification is as follows:
where
Placebo Test
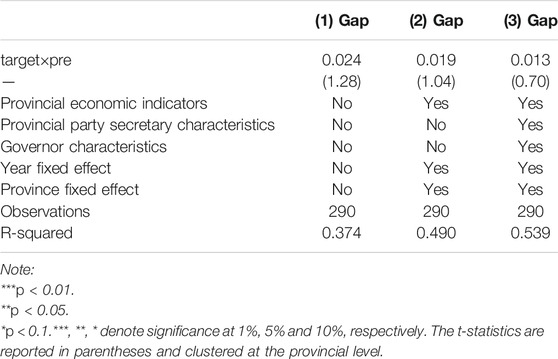
To further verify the reliability, we set the policy time for the implementation of the 11th FYP in 2005. Assuming that the energy intensity assessment is only implemented in 2005, we conduct regression analysis again and assign
Replacement of the Explained Variable
To avoid one-sided understanding of the assessment indicators, we replace the core explanatory variable in Table 5. The planned reduction rate of energy intensity is replaced by the actual reduction rate. According to the regression results, we find that the coefficient is slightly smaller, but still statistically significantly negative. In an economic sense, the actual reduction rate of energy intensity is reduced by one standard deviation, and the data accuracy is improved by about 10%. Therefore, after changing the explanatory variables, the results still show that the higher requirements of energy-saving assessment will result in higher statistical accuracy of energy data.
Regional Heterogeneity
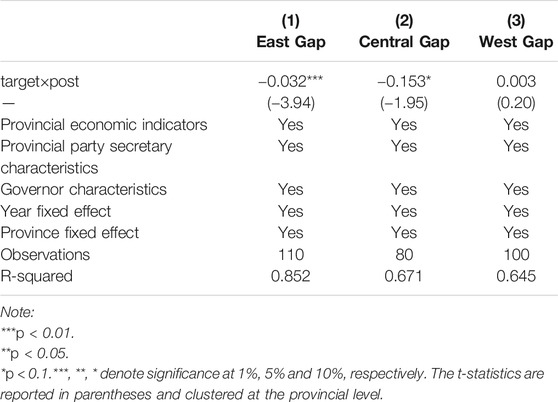
Considering that economic development and policy orientation differ greatly in different regions, we divide all provinces into eastern, central, and western regions to investigate the heterogeneous impacts1. Columns (1)–(3) in Table 6, respectively, report the comparative results by controlling provincial economic variables, official characteristics, province fixed effect, and year fixed effect. Generally speaking, the eastern and central provinces are stronger than the western provinces in both economic strength and political game ability, which may lead to the heterogeneity in the response of assessment policy. The analysis results show that the accuracy of energy intensity data is significantly improved in both eastern and central regions. The relationship between energy target assessment and data distortion is positive, but not significant in the western region. This means that local governments with greater economic power and political influence will weigh the potential risks and benefit more carefully when faced with appraisal pressure and reduce the tendency to falsify data.
Mechanisms
We hope to better understand the specific mechanism how this policy effect can be achieved. Since the re-estimation of the change rate of energy intensity is mainly based on different estimates of the economic growth rate, we actually need to find the influence channels on the misreporting of economic growth rate. Chen et al. (2019) found that the local government mainly distorts statistical data by adjusting the industrial output on the output side and reduces statistical accuracy by adjusting the investment data on the expenditure side. Therefore, energy-saving assessment may also affect the economic growth rate through industrial output and fixed asset investment, finally influencing the accuracy of energy intensity data. Later, we will analyze the impact mechanism of energy intensity assessment on data accuracy from the perspective of industrial output and fixed asset investment.
Industrial Output
Energy-saving assessment encourages local governments to adjust industrial output, thus affecting the accuracy of energy intensity data. To test this mechanism, this paper takes the proportion of industrial output to GDP as the explained variable. The corresponding regression results are reported in columns (1) and (2) of Table 7. The results show that the target assessment of energy intensity reduces the proportion of industrial output, which reduces the potential possibility of false reporting of output data and improves the accuracy of energy data.
Fixed Asset Investment
Energy-saving assessment may encourage local governments to adjust fixed asset investment, thus affecting the data accuracy of energy intensity. Similarly, this paper takes the proportion of fixed asset investment to GDP as the explained variable. As shown in columns (3) and (4) of Table 7, there is a negative relationship between energy intensity assessment and fixed asset investment, but it is not statistically significant.
Overall, we find that the energy-saving target assessment policy is mainly to reduce the proportion of local industrial output to improve the accuracy of statistical data. It also has a certain impact on investment, but it is not significant.
Conclusion and Policy Implications
Although energy intensity has always been the main measurement for the energy-saving policy design, its accuracy is affected by the false report of the GDP data. At the same time, few literature works discuss whether it will weaken or improve the data accuracy when energy intensity is included in the performance appraisal system for the local government. The understanding of this issue affects how the government designs effective energy conservation and emission reduction policies to achieve the important strategic goal of green development.
This paper analyzes the impact of energy-saving target assessment on data accuracy by using satellite lighting data to re-calculate energy intensity. We find that, after controlling the impact of false report of the economic growth rate, the official data generally overestimate the decline rate of energy intensity. Furthermore, data accuracy has significantly improved after the central government included the energy intensity reduction target in the performance appraisal for local governments. The higher assessment requirements faced by local governments will lead to the improvement of data accuracy. The reason for the above phenomenon is that the pressure of energy saving has inhibited the development of the industrial sector. As the output data of the industrial sector contain a large amount of moisture, energy-saving target assessment weakens the ability of local governments to manipulate GDP data and improves the accuracy of energy intensity indicators.
The above conclusions have some practical policy implications on how to effectively reduce energy consumption and promote green development in China.
First, although the simplified single policy objective is easy to observe, it is vulnerable to be impacted by external interference in practice, resulting in insufficient accuracy. This study finds that the accuracy of energy-saving data is improved when facing the task of economic growth and energy-saving target assessment at the same time. Therefore, in future policy design for energy conservation and emission reduction, we should try to include cross multiple assessment indicators, so as to promote the effective implementation of policy objectives. Moreover, setting a concrete target-based responsibility system for energy saving or environmental policies may have positive effects. In the information age, how to use big data technology and machine learning methods to supervise the behavior of local officials and improve the performance of energy saving is also needed to be further discussed.
Second, it is found that the introduction of energy-saving index into local government performance assessment significantly improves the data accuracy. Though the fulfillment degree of policy objectives is reduced on the surface, it still contains positive factors such as the reduction of data fraud. Therefore, in the performance evaluation of energy saving, some appropriate flexibility is needed and the tolerance can be given if the energy saving does not perform as well as expected. This will provide reasonable incentives for local governments to take the initiative to reduce data distortions and thus to increase their real efforts to achieve energy conservation, emission reduction, and green development goals.
Data Availability Statement
The original contributions presented in the study are included in the article/supplementary material, and further inquiries can be directed to the corresponding author.
Author Contributions
PZ, SL, and RH conceptualized the idea and wrote the original draft. PZ, TY, SL, and RH performed the methodology. TY ran the software and curated the data. SL and RH supervised the work and reviewed and edited the paper. All authors have read and agreed to the published version of the article.
Funding
This work was supported by the National Social Science Fund of China on “Study of Measurement of Statistical Misreporting and Correction Mechanism: Based on Incentive of Local Government” (Grant no. 17BJL070), the Humanity and Social Science Youth Foundation of Ministry of Education of China on “GDP Misreporting and Formation Mechanism under Official Evaluation: Study Based on Satellite Light Data” (Grant no. 16YJC790136), the Projects of the National Natural Science Foundation of China (Grant no. 71773084), and the major projects of the National Social Science Fund of China on “Institutional Dividend of the Transformation of Government Functions” (Grant no. 18ZDA113).
Conflict of Interest
The authors declare that the research was conducted in the absence of any commercial or financial relationships that could be construed as a potential conflict of interest.
Footnotes
1According to the common division methods, the eastern region includes Beijing, Tianjin, Hebei, Liaoning, Shanghai, Jiangsu, Zhejiang, Fujian, Shandong, Guangdong, and Hainan; the central region includes Shanxi, Jilin, Heilongjiang, Anhui, Jiangxi, Henan, Hubei, and Hunan; and the western region includes Guangxi, Inner Mongolia, Shaanxi, Gansu, Qinghai, Ningxia, Sichuan, Chongqing, Yunnan, and Guizhou.
References
Barber, T., and Hope, K. (2010). Brussels Attacks Greece over False Data. London: Financial Times, 13.
Beck, T., Levine, R., and Levkov, A. (2010). Big Bad banks? the Winners and Losers from Bank Deregulation in the United States. J. Finance 65 (5), 1637–1667. doi:10.1111/j.1540-6261.2010.01589.x
Chen, W., Chen, X., Hsieh, C. T., and Song, Z. (2019). A Forensic Examination of China's National Accounts. Massachusetts: National Bureau of Economic Research. doi:10.3386/w25754
Chen, Y., Jin, G. Z., Kumar, N., and Shi, G. (2012). Gaming in Air Pollution Data? Lessons from China. BE J. Econ. Anal. Pol. 13 (3). doi:10.1515/1935-1682.3227
Chen, Y. J., Li, P., and Lu, Y. (2018). Career Concerns and Multitasking Local Bureaucrats: Evidence of a Target-Based Performance Evaluation System in China. J. Develop. Econ. 133, 84–101. doi:10.1016/j.jdeveco.2018.02.001
Donaldson, D., and Storeygard, A. (2016). The View from above: Applications of Satellite Data in Economics. J. Econ. Perspect. 30 (4), 171–198. doi:10.1257/jep.30.4.171
Edin, M. (1998). Why Do Chinese Local Cadres Promote Growth? Institutional Incentives and Constraints of Local Cadres. Forum Develop. Stud. 25 (1), 97–127. doi:10.1080/08039410.1998.9666077
Ghanem, D., and Zhang, J. (2014). ‘Effortless Perfection:' Do Chinese Cities Manipulate Air Pollution Data? J. Environ. Econ. Manage. 68 (2), 203–225. doi:10.1016/j.jeem.2014.05.003
Henderson, J. V., Storeygard, A., and Weil, D. N. (2012). Measuring Economic Growth from Outer Space. Am. Econ. Rev. 102 (2), 994–1028. doi:10.1257/aer.102.2.994
Jia, J., Liang, X., and Ma, G. (2021). Political Hierarchy and Regional Economic Development: Evidence from a Spatial Discontinuity in China. J. Public Econ. 194, 104352. doi:10.1016/j.jpubeco.2020.104352
Kerner, A., Jerven, M., and Beatty, A. (2014). Are Development Statistics Manipulable? Burnaby: Simon Fraser University, Simons Papers in Security and Development.37.
Kung, J. K.-S., and Chen, S. (2011). The Tragedy of the Nomenklatura: Career Incentives and Political Radicalism during China's Great Leap Famine. Am. Polit. Sci. Rev. 105, 27–45. doi:10.1017/s0003055410000626
Li, H., Zhao, X., Yu, Y., Wu, T., and Qi, Y. (2016a). China's Numerical Management System for Reducing National Energy Intensity. Energy Policy 94, 64–76. doi:10.1016/j.enpol.2016.03.037
Li, P., Lu, Y., and Wang, J. (2016b). Does Flattening Government Improve Economic Performance? Evidence from China. J. Develop. Econ. 123, 18–37. doi:10.1016/j.jdeveco.2016.07.002
Lin, B., and Zhu, J. (2021). Impact of China's New-type Urbanization on Energy Intensity: A City-Level Analysis. Amsterdam: Energy Economics. 105292. doi:10.1016/j.eneco.2021.105292
Liu, Z., He, C., Zhang, Q., Huang, Q., and Yang, Y. (2012). Extracting the Dynamics of Urban Expansion in China Using DMSP-OLS Nighttime Light Data from 1992 to 2008. Landscape Urban Plann. 106 (1), 62–72. doi:10.1016/j.landurbplan.2012.02.013
Lo, K. (2014). China's Low-Carbon City Initiatives: the Implementation gap and the Limits of the Target Responsibility System. Habitat Int. 42, 236–244. doi:10.1016/j.habitatint.2014.01.007
Lo, K. (2020). Governing Energy Consumption in China: a Comprehensive Assessment of the Energy Conservation Target Responsibility System. Energy Transit 4 (1), 57–67. doi:10.1007/s41825-020-00023-0
Michalski, T., and Stoltz, G. (2013). Do countries Falsify Economic Data Strategically? Some Evidence that They Might. Rev. Econ. Stat. 95 (2), 591–616. doi:10.1162/rest_a_00274
Rawski, T. G. (2001). What Is Happening to China's GDP Statistics? China Econ. Rev. 12 (4), 347–354. doi:10.1016/s1043-951x(01)00062-1
Shi, X. (2014). Setting Effective Mandatory Energy Efficiency Standards and Labelling Regulations: A Review of Best Practices in the Asia Pacific Region. Appl. Energ. 133, 135–143. doi:10.1016/j.apenergy.2014.07.084
Shi, X., and Xu, Z. (2018). Environmental Regulation and Firm Exports: Evidence from the Eleventh Five-Year Plan in China. J. Environ. Econ. Manage. 89, 187–200. doi:10.1016/j.jeem.2018.03.003
Song, F., and Zheng, X. (2012). What Drives the Change in China's Energy Intensity: Combining Decomposition Analysis and Econometric Analysis at the Provincial Level. Energy policy 51, 445–453. doi:10.1016/j.enpol.2012.08.044
Wallace, J. L. (2016). Juking the Stats? Authoritarian Information Problems in China. Br. J. Polit. Sci. 46 (1), 11–29. doi:10.1017/s0007123414000106
World Bank (2002). Building Statistical Capacity to Monitor Development Progress. Washington, DC: World Bank.
Wu, J., He, S., Peng, J., Li, W., and Zhong, X. (2013). Intercalibration of DMSP-OLS Night-Time Light Data by the Invariant Region Method. Int. J. remote sensing 34 (20), 7356–7368. doi:10.1080/01431161.2013.820365
Xiong, W. (2018). “The Mandarin Model of Growth (No. W25296),” in National Bureau of Economic Research. Massachusetts: Working Paper. doi:10.3386/w25296
Xu, K., Chen, F., and Liu, X. (2015). The Truth of China Economic Growth: Evidence from Global Night-Time Light Data. Econ. Res. J. 9, 17–29.
Xue, X., and Wang, Z. (2021). Impact of Finance Pressure on Energy Intensity: Evidence from China's Manufacturing Sectors. Energy 226, 120220. doi:10.1016/j.energy.2021.120220
Young, A. (2003). Gold into Base Metals: Productivity Growth in the People's Republic of China during the Reform Period. J. Polit. economy 111 (6), 1220–1261. doi:10.1086/378532
Zhang, D., Aunan, K., Martin Seip, H., and Vennemo, H. (2011). The Energy Intensity Target in China's 11th Five-Year Plan Period-Local Implementation and Achievements in Shanxi Province. Energy Policy 39 (7), 4115–4124. doi:10.1016/j.enpol.2011.03.085
Zhang, D., Li, J., and Ji, Q. (2020). Does Better Access to Credit Help Reduce Energy Intensity in China? Evidence from Manufacturing Firms. Energy Policy 145, 111710. doi:10.1016/j.enpol.2020.111710
Zhang, P., Shi, X., Sun, Y., Cui, J., and Shao, S. (2019). Have China's Provinces Achieved Their Targets of Energy Intensity Reduction? Reassessment Based on Nighttime Lighting Data. Energy Policy 128, 276–283. doi:10.1016/j.enpol.2019.01.014
Keywords: target-based performance evaluation, data accuracy, energy intensity, green development, policy design
Citation: Zhang P, Yu T, Lu S and Huang R (2021) How Does Target-Based Performance Evaluation Affect the Accuracy of Energy-Saving Data: Evidence From China. Front. Energy Res. 9:704317. doi: 10.3389/fenrg.2021.704317
Received: 02 May 2021; Accepted: 07 June 2021;
Published: 02 July 2021.
Edited by:
Yongping Sun, Hubei University of Economics, ChinaReviewed by:
Guochang Zhao, Southwestern University of Finance and Economics, ChinaKevin Lo, Hong Kong Baptist University, China
Houyin Long, Fuzhou University, China
Copyright © 2021 Zhang, Yu, Lu and Huang. This is an open-access article distributed under the terms of the Creative Commons Attribution License (CC BY). The use, distribution or reproduction in other forums is permitted, provided the original author(s) and the copyright owner(s) are credited and that the original publication in this journal is cited, in accordance with accepted academic practice. No use, distribution or reproduction is permitted which does not comply with these terms.
*Correspondence: Ruting Huang, cnV0aW5naHVhbmdAZm94bWFpbC5jb20=
 Ping Zhang1,2
 Ruting Huang