 Na Wei1,2*
 Cuiying Xie
 Wantong Sun
94% of researchers rate our articles as excellent or good
Learn more about the work of our research integrity team to safeguard the quality of each article we publish.
Find out more
ORIGINAL RESEARCH article
Front. Energy Res., 27 August 2021
Sec. Carbon Capture, Utilization and Storage
Volume 9 - 2021 | https://doi.org/10.3389/fenrg.2021.699356
This article is part of the Research TopicGas Hydrate and Hydrate Technology for Greenhouse Gas MitigationView all 7 articles
Gas hydrates formed in the conditions of high pressure and low temperature in deep sea and in the process of oil and gas transportation, natural gas hydrate (NGH), will seriously affect the safety of drilling and completion operations and marine equipment and threaten the safety of drilling platform. How to prevent the hydrate formation in the process of oil and gas production and transportation has become an urgent problem for the oil and gas industry. For this reason, in view of the formation of NGH in the process of drilling and producing marine NGH, the phase equilibrium calculation research of NGH formation was carried out, the mathematical model of gas hydrate formation phase equilibrium condition was established, and the experimental research on NGH formation was carried out through adding different thermodynamic inhibitors. The experimental phenomena show that, first, the stirring speed has little effect on the inhibition of hydrate formation. Second, when the pressure is 10 MPa and the volume concentration of inhibitor is 1, 3, 5, and 7%, the supercooling degree of hydrate formation is 1.81, 8.89, 11.09, and 9.39°C, respectively. Third, when the volume concentration of inhibitor is 1, 3, 5, and 7%, the induction time of hydrate formation is 10328, 14231, 19576, and 24900 s, respectively. As the polymer molecules in the inhibitor reduce the activity of water in the system and fill the cavity structure of the hydrate, they reduce the generation conditions of NGH and break the original phase equilibrium conditions when NGH is generated, thus forming NGH at a lower temperature or higher pressure.
Natural gas hydrate, commonly known as “combustible ice” is a crystalline “cage compound” formed by the interaction of methane and other hydrocarbon gases or volatile liquids with water (Griffin and Ramberg, 1982; Kvenvolden et al., 1993; Carroll, 2009). In the process of natural gas drilling and production and oil and gas gathering and transportation in coal-measure formation, if there is hydrate formation in the wellbore or gas transmission pipeline, it is very easy to increase the pressure drop of the pipeline and cause damage to the drilling platform (Gholipour Zanjani et al., 2012). In serious cases, the hydrate wellbore, gathering and transportation pipeline, valves, and equipment will be blocked and affect the production reduction and gathering and transportation of natural gas (Sloan, 1998; Ma et al., 2003). Therefore, a lot of research has been done to prevent the formation of hydrate.
At present, in order to avoid hydrate blockage in oil and gas pipelines, the hot spots are focused on thermodynamic inhibitor injection method and combination method of depressurization and thermodynamic inhibitor injection (Barduhn et al., 1962; Wilson, 1964; Mohebbi and Behbahani, 2014). Thermodynamic inhibitors mainly include alcohols and inorganic electrolytes, such as methanol, isopropanol, and other organic thermodynamic inhibitors and inorganic thermodynamic inhibitors (Liu, 2017). Li et al. (2011) investigated the conditions for the formation of methane hydrate in the presence of 10%wt of various ionic liquids, in 2011. Among all ionic liquids, the thermodynamic inhibitory effect of tetramethylammonium is higher than the rest and is comparable to that of ethyl glycol. (Hodder and Popplestone, 2009) investigated the conditions for the formation of methane hydrate in the presence of pure water and 1-butyl−3-methyl imidazolium tetrafluoroborate, 1-Butyl−3-methyl imidazolium dicyanamide, and tetraethyl–ammonium chloride in 2013. The results showed that at concentrations below 10%wt, these fluids do not have a significant thermodynamic inhibitory effect on hydrate formation, while they have a significant effect at higher concentrations (10 and 15%wt). Mike Hodder’s (Shin et al., 2014) research has found that the most effective way to combat the hydrate is to add salt and other chemical inhibitors that can reduce the water’s activity. Kim Jakyung (Kim et al., 2011) studied the inhibition of monoethylene glycol (MEG) with polyethylene caprolactam (PVCap) to delay the formation of hydrate and prevent the agglomeration of hydrate particles. Kawamura (Makogon and Cieslesicz, 1981) has studied the hydrate decomposition caused by the injection of MA and found that the concentration of hydrate surface inhibitors varies. (Sira N and Robinson, 1977) has studied the hydrate decomposition after the injection of MA and EG, suggesting that the hydrate decomposition rate is a function of the inhibitor temperature, the injection rate of inhibitor, the decomposition pressure, the temperature of the inhibitor solution, and the decomposition area. Kamath et al. (2015) carried out the experiment of decomposition of methane hydrate in porous media by hot brine (NaCl aqueous solution) and obtained the effects of temperature, salt volume concentration, and injection rate of brine on the decomposition rate of methane hydrate. Fan et al. (2016) studied the decomposition of hydrate under the action of EG and found that the volume concentration and injection rate of EG had important influences on the decomposition rate of hydrate. (Robinson and Hutton, 1967) using the basic principles of chemical thermodynamics and numerical analysis, combined with hydrate formation kinetics mechanism and gas hydrate molecular thermodynamic model, the gas hydrate molecular thermodynamics and gas kinetics in gas gathering pipeline are organically combined to establish a gas gathering pipeline gas hydrate blockage prediction model. (Quan, 2000) independently synthesized a new kinetic hydrate inhibitor BVP. The self-made evaluation equipment was used to evaluate its performance by the tetrahydrofuran method. Combined with thermodynamic inhibitors, the optimal combination scheme is 5–10% NaCl+0.5%BVP, and the solution can withstand undercooling up to−12°C ∼ −16 °C. Based on the thermodynamic phase equilibrium theory, Shi Bohui (2014a) applied the Chen–Guo model to predict the hydrate formation conditions. Combined with the operation conditions of Yuji gas transmission pipeline, they determined the pipeline sections that were easy to precipitate free water in the whole line. It was suggested that these pipeline sections should be concentrated in the summer to clear the pipe and discharge pollutants, and the minimum alcohol injection amount to prevent the formation of hydrate was given. (Kannan and Punase, 2009) discussed the design points of drilling fluid suitable for the hydrate formation by means of an ultrasonic testing to explore the disturbance law of hydrate thermodynamic inhibitors on the hydrate formation. It is contradictory to prevent hydrate decomposition in formation and inhibit hydrate formation in wellbore. It is an effective way to develop a drilling fluid formula suitable for the hydrate formation to balance this contradiction. (Phillips and Grainger, 1998) used the van der Waals–Platteeuw model to predict the phase equilibrium of gas hydrate, and studied the effect of thermodynamic inhibitors on the phase equilibrium of gas hydrate. With the increase of mass fraction of thermodynamic inhibitors, the equilibrium pressure of hydrate phase increases gradually. At the same time, temperature has a significant effect on the inhibition effect of thermodynamic inhibitors. Generally speaking, when the temperature is greater than 273 K, the inhibition effect of thermodynamic inhibitors on hydrate is more obvious. Zhao et al. (2016) analyzed the mechanism of hydrate thermodynamic inhibitors affecting gas hydrate formation conditions. The mechanism of hydrate thermodynamic inhibitors reducing the hydrate formation temperature or increasing hydrate formation pressure is to reduce the water activity of the solution, and the inhibition effect of hydrate formation increases linearly with the decrease of water activity.
The general hydrate formation conditions include three aspects first, the natural gas contains enough moisture to form the hole structure (Behar et al., 1994); second, it has certain temperature and pressure conditions, such as a high pressure and low temperature; finally, the gas is in the intense disturbance such as pulsating turbulence, and there is a crystal center. The first two conditions are the main conditions and the last one is the secondary conditions. Based on van der Waals and Platteuw in 1959, according to the lattice characteristics of hydrate (Christiansen and Sloan, 1995), the theoretical formula was derived by using the statistical thermodynamics and Langmuir gas isothermal adsorption theory in this work.
In the hydrate formation system, the gas–liquid–solid three-phase equilibrium thermodynamic model includes two parts (Kim et al., 2014) hydrate phase and coexisting water-rich phase. Water is usually used as the reference component for the phase equilibrium of hydrate, and the chemical potential of water in the phase (beta phase) of water is introduced as the reference state (Wei et al., 2017), which is as follows:
Here, T is the system temperature. vi is the number of type i holes per unit water molecule in the hydrate phase. θij is the possession fraction of the guest molecule j in the type i hole. Cij is the Langmuir constant of j component in type i hole. fi is the fugacity of component j in equilibrium phase. Nc is the number of components that can form hydrate in the mixture.
The Langmuir constant can be solved by the following correlation (Wei et al., 2017).
Here, T is the system temperature and Bij is the empirical constant.
When gas hydrate and no gas hydrate are in equilibrium, there are the following relations.
Here, μw and fw are the chemical potential and fugacity of water in the water-rich phase.
In addition, the chemical potential difference of water can be expressed as follows:
The hydrate phase equilibrium conditions can be obtained from (4) and (5), which are expressed as follows:
Here,
Through the physical model and numerical analysis of natural gas hydrate phase equilibrium, the NGH phase equilibrium curve was obtained when the inhibitor concentration was 1, 3, 5, 7%, and pure water. The equilibrium pressure of NGH phase in the water system with inhibitor was much higher than that of pure water. The main effect of the concentration of inhibitor on the phase equilibrium of NGH is that the temperature and pressure required during the formation of NGH are changed, so that NGH is formed at a lower temperature or higher pressure. Figure 15 shows the phase equilibrium curve of NGH with pure water without inhibitor and with inhibitor concentration of 1, 3, 5, and 7%.
Methane hydrate is formed under a low temperature and high pressure. Thermodynamic inhibitors are used to destroy the original formation conditions of methane hydrate, and the phenomena, temperature, and pressure changes during the formation process of methane hydrate under different pressure and volume concentration of inhibitors are explored. The purity of methane is as high as 99.97%. The inhibitor used in this experiment was a compound inhibitor, and the specific formula of the inhibitor was not disclosed. The inhibitor solution was provided by LIU Gang of Daqing Oilfield Company (Wei et al., 2017), and its specific formula was not published yet. In the experiment, accurate analytical balance (mass uncertainty ±0.001 g) was used to prepare an aqueous solution according to the gravimetric method.
An experimental device system is developed for the rapid preparation, crushing, and slurry modulation of large samples of natural gas hydrate under different temperature and pressure conditions. As shown in Figure 1, it is mainly composed of kettle body, sand apparatus, cooling system, gas circulation system, liquid circulation system, and measurement and control system, etc. The device can quickly prepare the large sample of Φ 950 mm × 1500 mm by the “three-in-one” hydrate sample preparation method of spray method ∼ bubbling method ∼ stirring method, and the capacity of the experimental kettle is 1062 L.

FIGURE 1. Experimental system.
Taking advantage of the relatively stable temperature and pressure, the experimental system simulates the formation mechanism of marine gas hydrate under different submarine pressures (2∼5 MPa) and low temperature (0–16°C). Figure 2 shows the experimental phenomena of methane hydrate formation. In addition, the system can simulate the rapid preparation method of “three-in-one” hydrate samples at 1500 m water depth, mix quantitative sea water and mud sand, modulate hydrate slurry, and ensure slurry transport under stable hydrate conditions. Through the automatic modules of image capture, data acquisition and security control in the measurement and control system, dynamic images and experimental data such as temperature, pressure, and flow can be collected and stored.
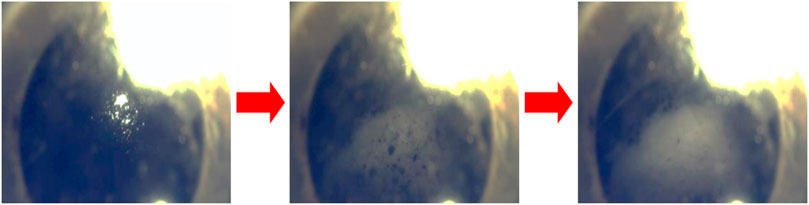
FIGURE 2. Experimental phenomena of methane hydrate formation.
First, complete the installation of methane cylinder group, and prepare the pyrrolidone inhibitor, water, and other experimental materials. Then inject appropriate amount of water into the water tank, which is standby for the subsequent liquid injection into the preparation kettle. Check the opening and closing status of water injection and gas injection valves and whether there is leakage in the pipeline. After checking that there is no problem, start the experiment. The preparation was completed before the experiment.
Open the vacuum pipeline valve, and then run the vacuum pump until the vacuum degree reaches −0.09MPa, stop the vacuum pumping operation, close the vacuum pipeline valve, close the vacuum pump, and the vacuum pumping operation is completed.
Open the valve of the water injection pipeline, and then run the water injection pump to inject water into the preparation kettle. Measure the injected water through the radar liquid level on the preparation kettle. When the water injection volume reaches the set water volume, close the water injection pipeline valve and shut down the water injection pump at the same time, and the liquid injection operation is completed.
Open the valve of methane injection gas path, run the gas booster pump, inject 99.9% pure methane into the preparation kettle, and measure the amount of methane injected through the gas flowmeter. When the pressure in the preparation kettle reaches the experimental set value, stop the gas injection, close the methane injection valve, and shut down the gas booster pump at the same time. Then the methane injection operation is completed.
When the gas injection operation is completed, start the stirring device of the preparation kettle (set the stirring speed according to the experimental requirements). Run the gas circulation pump of the preparation system (the gas circulation pump has a circulating capacity of 8.04 L/min), then start the refrigeration unit, maintain the temperature in the preparation kettle according to the experimental requirements, and set the reaction conditions.
Open the computer, start the data acquisition control software, set the relevant parameters and data storage location, and start data acquisition. The acquisition and recording parameters include real-time temperature in preparation kettle, real-time pressure in preparation kettle, real-time temperature of refrigeration liquid, stirring speed, and real-time image in preparation kettle.
The real-time observation of the hydrate formation and the experimental data of temperature and pressure in the preparation kettle were made by the computer. When the hydrate was formed in the preparation kettle, the hydrate preparation experiment was stopped. Thus, the methane hydrate experiment of inhibitor inhibition was completed.
First, no pyrrolidone inhibitor was added in the preparation kettle. Under the condition of pressure of 5MPa, the methane hydrate formation experiment was carried out with different stirring speeds of 10, 20, and 30 rad/min, and the water solution with different volume concentrations of 1, 3, 5, and 7% inhibitors was added into the preparation kettle to inhibit the formation of methane hydrate. The experimental phenomenon of methane hydrate formation in pure water in the preparation reactor is shown in Figure 3.
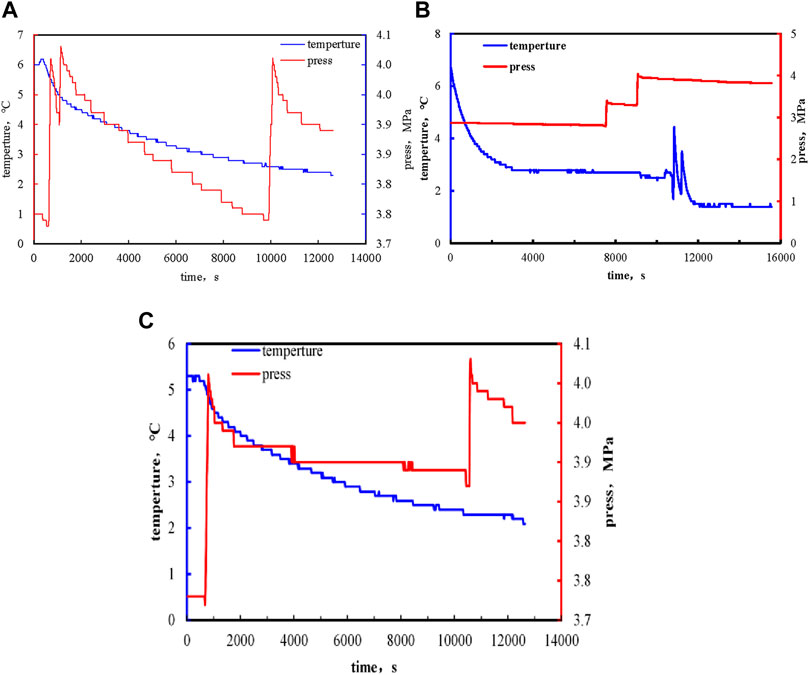
FIGURE 3. Temperature and pressure curve of methane hydrate formation. (A:10rad/min; B:20rad/min; C:30rad/min).
When the inhibitor is not added to the pure water, the increase of temperature or the decrease of pressure in the process of hydrate formation change obviously. As shown in Figure 4 is the temperature and pressure curve of the methane hydrate formation, a (5MPa, 10 rad/min), b (5MPa, 20 rad/min), and c (5MPa, 30 rad/min). Figure 4 shows the temperature and pressure curves of methane hydrate formation process at different rotating speeds.
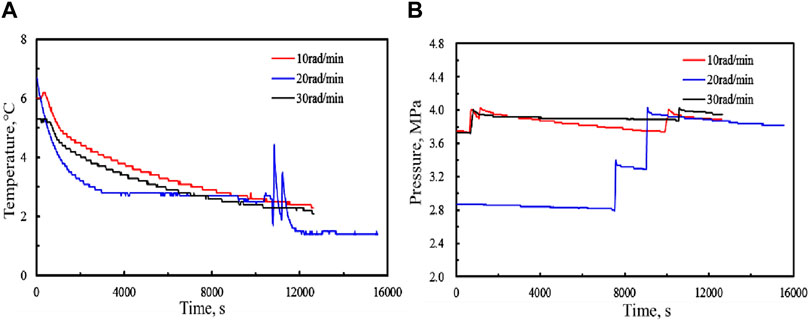
FIGURE 4. Temperature and pressure comparison curves of methane hydrate formation process at different rotating speeds. (A:Temperature; B:Pressure).
In order to explore the influence of pressure on the formation of methane hydrate, the pressure in the preparation kettle was set at 5 and 10 MPa. By adding inhibitors with volume concentration of 1, 3, 5, and 7% to the NGH preparation kettle, the pressure and temperature in the preparation kettle were observed. It was found that the temperature in the hydrate preparation kettle decreased slowly and the pressure increased slowly.
Figure 5 shows the experimental phenomenon of methane hydrate formation during a longer time of stirring with inhibitors with volume concentrations of 1, 3, 5, and 7%.
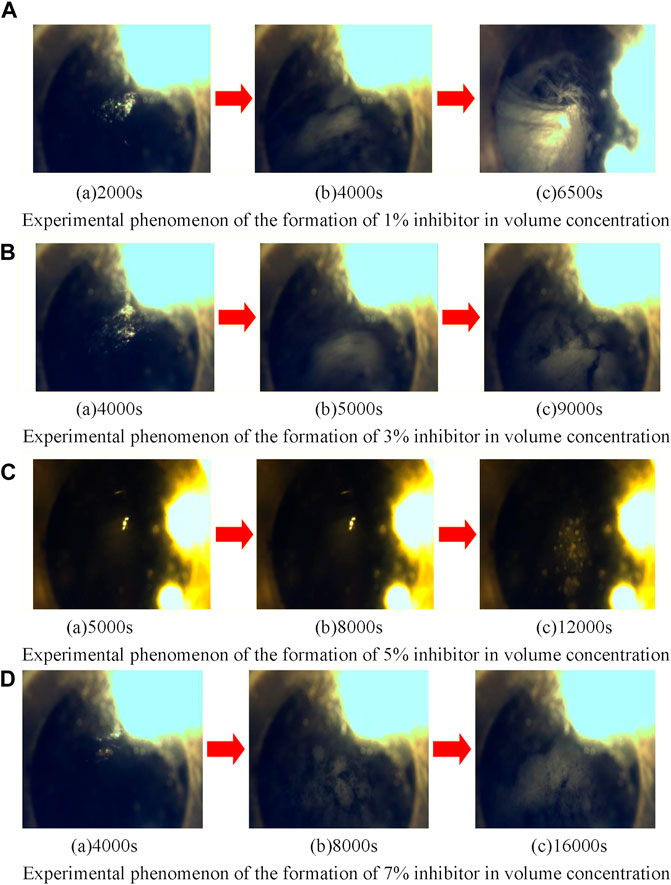
FIGURE 5. Experimental phenomena of methane hydrate formation under different inhibitor volume concentrations. (A) Experimental phenomenon of the formation of 1% inhibitor in volume concentration. (B) Experimental phenomenon of the formation of 3% inhibitor in volume concentration. (C) Experimental phenomenon of the formation of 5% inhibitor in volume concentration. (D) Experimental phenomenon of the formation of 7% inhibitor in volume concentration.
Figure 6 shows the variation of temperature and pressure under 1% inhibitor at a (5 MPa) and b (10 MPa).
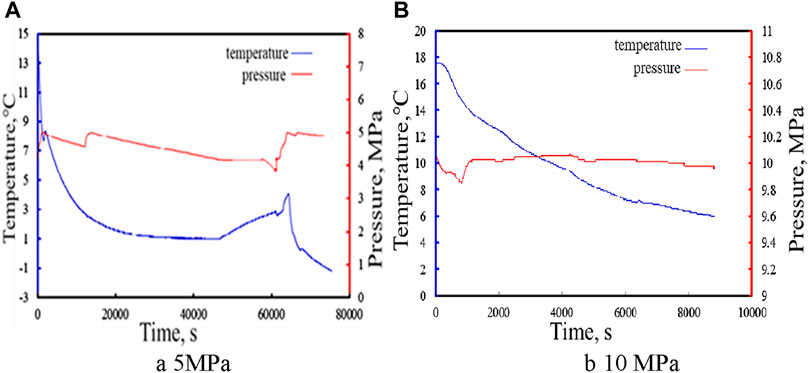
FIGURE 6. Variation of temperature and pressure at 1% inhibitor concentration. (A:5 MPa; B:10 MPa).
Figure 7 shows the variation of temperature and pressure under 3% inhibitor at a (5MPa) and b (10MPa).
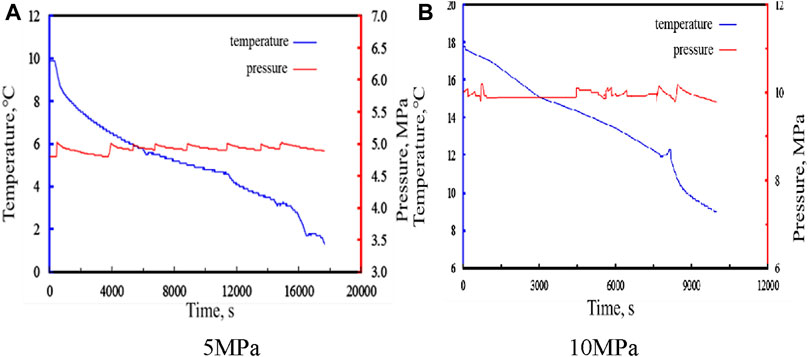
FIGURE 7. Variation of temperature and pressure at 3% inhibitor concentration. (A:5 MPa; B:10 MPa).
Figure 8 shows the variation of temperature and pressure under 5% inhibitor at a (5 MPa) and b (10 MPa).
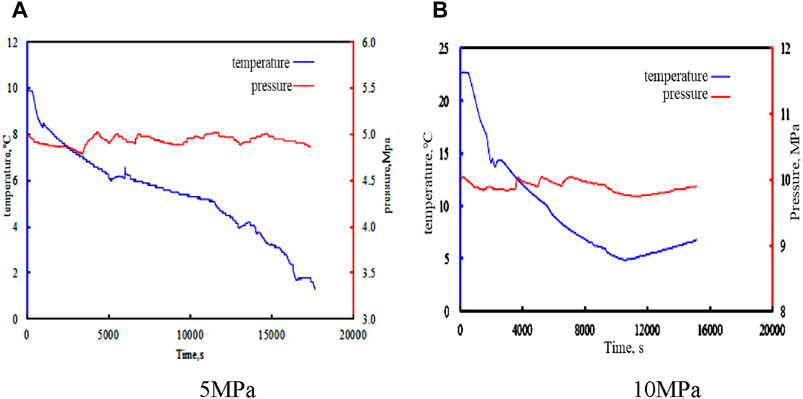
FIGURE 8. Variation of temperature and pressure at 5% inhibitor concentration. (A:5 MPa; B:10 MPa).
Figure 9 shows the variation of temperature and pressure under 7% inhibitor at a (5 MPa) and b (10 MPa).
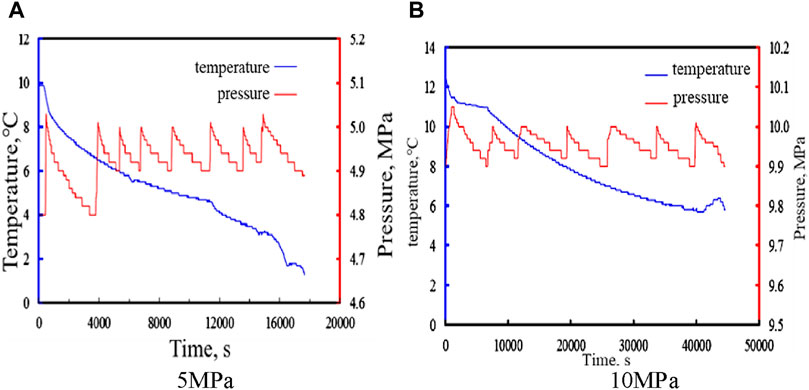
FIGURE 9. Variation of temperature and pressure at 7% inhibitor concentration. (A:5 MPa; B:10 MPa).
Comparing the temperature and pressure in the process of methane hydrate formation under different volume concentrations of inhibitors, it was found that with the increase of time, the temperature in the preparation kettle decreased and the pressure increased. When the pressure was too low, the hydrate in the reactor could not survive.
Figure 10 shows the analysis of supercooling degree under different concentration and pressure conditions. The supercoiling degree of methane hydrate formation is determined by setting different volume concentrations and temperature and pressure changes. When the pressure is 5MPa, hydrate is formed in the solution without an inhibitor when the temperature and pressure change is lower than the equilibrium temperature. However, the time of hydrate formation in the solution with 1, 3, 5, and 7% inhibitor concentration is much longer than that without inhibitor, and the hydrate formation is greatly affected by the change of temperature and pressure. Comparison of the subcooling degree of inhibitor at different concentrations at 10 MPa is shown in Figure 11.
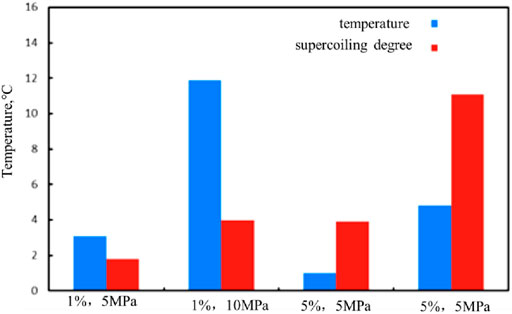
FIGURE 10. Analysis of supercooling degree under different concentration and pressure conditions.
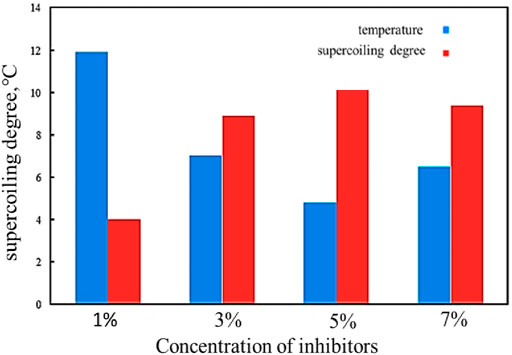
FIGURE 11. Comparison of the subcooling degree of inhibitor at different concentrations at 10 MPa.
Since a large amount of heat will be generated during the methane hydrate formation, the pressure will drop and the gas phase volume will decrease rapidly. In this work, the induction time is defined as the time required for the system to reach the phase equilibrium and the system parameters begin to change rapidly (Zhao et al., 2015). During the formation of natural gas hydrate, the temperature will rise sharply and the pressure will drop sharply. The parameters (such as system temperature and gas volume) can be measured by experiments and used as the basis for judgment, which has better operability and accuracy. Therefore, the inflection point of the temperature time curve can be used as the end point of the induction time. Figure 12 shows the induction time of gas hydrate formation at different stirring speeds. When the initial pressure is 5MPa, the induction time of hydrate formation is close, and the induction time of hydrate formation is 9740s, 9460s, and 9300s, respectively. The stirring speed has little effect on the hydrate formation.
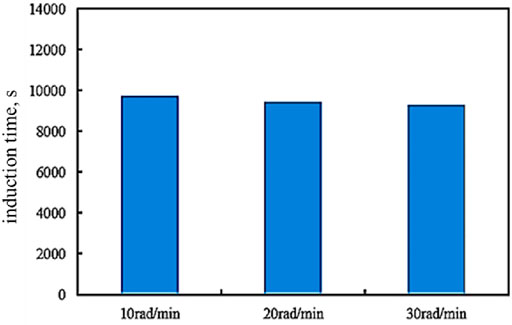
FIGURE 12. Induction time of gas hydrate formation at different stirring speeds.
At the initial pressure of 5MPa, the induction time of hydrate formation was 10328s for 1% inhibitor, 14231s for 5% inhibitor, 19576s for 3% inhibitor, and 20990s for 7% inhibitor at low temperature. The comparative analysis shows that the induction time of hydrate formation is the longest when the concentration of 7% inhibitor is−0.6°C, which indicates that the inhibition effect is the best. The comparison of induction time of hydrate formation of three different concentrations is shown in Figure 13.
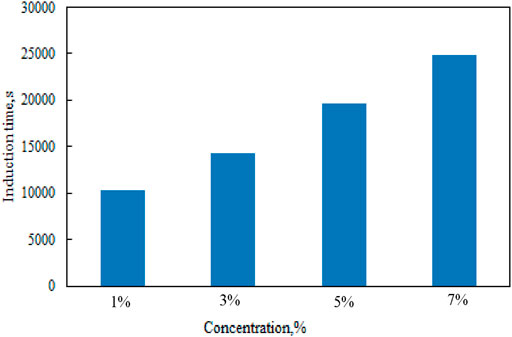
FIGURE 13. Comparison of induction time of different concentrations of inhibitors.
Wilson activity coefficient model, PT equation of state, and PR equation of state (Hammerschmidt, 1934) were used to calculate and analyze the activity of water in the water-compound inhibitor binary system, as shown in Figure 14. When the Wilson model (Zhao et al., 2015) is used to calculate the water activity, in order to make the experimental results more accurate, multiple statistical analyses are used to make the initial conditions for the formation of methane hydrate at the volume concentrations of 1, 3, 5, and 7% of the inhibitor in the experimental preparation reactor different. Therefore, the water activities under the initial conditions in the experimental preparation reactor are different. In order to make the experimental results more accurate, multiple statistical analyses are carried out after a period of 2000 min when the water activity reaches a relatively stable level. It is found that with the increase of the water mole fraction, the water activity first decreased and then increased slowly. That is, when the volume concentration of the inhibitor is high (the mole fraction was about 50%), the increase of the volume concentration of the inhibitor has a more significant effect on the water activity. At a volume concentration of 7% inhibitor in methane hydrate formation process, the volume concentration of 7% of the water activity reduction rate is the fastest about 0.43 × 10⁻⁴ Aw/min, the volume concentration of 1% of the water activity is the lowest about 0.1 × 10⁻⁴ Aw/min.

FIGURE 14. the activity of water in water-compound inhibitor binary system.
However, when PT and PR equations of state are used to calculate the activity of water, the calculation results of hydrate formation pressure will be larger, or the temperature will be lower (Phillips and Grainger, 1998).
Based on the above evaluation and thermodynamic model of hydrate formation, it is considered that there are two kinds of equilibrium in the system during hydrate formation (Guo, 2002): the equilibrium and quasi-chemical equilibrium of gas molecules in the connecting holes. First, since the amide polymer molecules in the composite inhibitor are filled with the cavity structure between methane gas and water molecules, the ability of crystalline cage compounds formed by the interaction between methane gas molecules and water molecules is hindered. Second, in pure water, the more the water molecules in the solution, the more the water molecules forming cage complex structure, the more the conducive to the formation of methane hydrate crystals. For the system containing inhibitors, due to the addition of amide polymers in the solution, the activity phase of water molecules in the solution was inhibited, and the phase equilibrium condition of methane hydrate formation was broken. The activity of water molecules forming cage complexes in the solution was reduced, resulting in methane hydrate formation at lower temperatures or higher pressures, or to a certain extent, the time of methane hydrate formation was slowed down.
Through the physical model and experimental results of the phase equilibrium of natural gas hydrate, the phase equilibrium curves of natural gas hydrate with the inhibitor volume concentrations of 1,3, 5, and 7% used in the experiment and the pure water blank control group were obtained. The hydrate phase equilibrium pressure of the inhibitor water system was much higher than that of the pure water natural gas hydrate. The main effect of the volume concentration of inhibitors on the phase equilibrium of natural gas hydrate is that the temperature and pressure required for the formation of natural gas hydrate have changed, making the natural gas phase equilibrium hydrate formed at lower temperatures or higher pressures. Figure 15 is the phase equilibrium curve of natural gas hydrate formation under the action of pure water without inhibitors and inhibitors with volume concentrations of 1, 3, 5, and 7%.
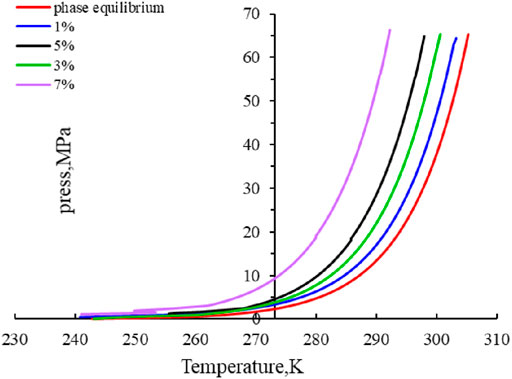
FIGURE 15. Phase equilibrium curve of gas hydrate formation.
1) The multifunctional experimental system for the development of marine NGH was used to study the inhibition of methane hydrate formation in the temperature and pressure range of 240–340K and 0.1–50 MPa. The results showed that the kinetic inhibitors slowed down the formation time of NGH and made the formation equilibrium of methane hydrate move to a lower temperature or higher pressure. Different concentrations of thermodynamic inhibitors have different effects on the phase equilibrium of methane hydrate, but the rotational speed has little effect on the formation conditions of methane hydrate.
2) A thermodynamic inhibitor can inhibit hydrate formation. The mechanism is that the water activity in the solution is reduced, which interferes with the formation of water molecules. The lower the water activity, the lower the temperature required for the hydrate formation. Therefore, with the increase of pressure, hydrate formation temperature increases, and hydrate formation is easier. With the increase of inhibitor concentration under the same pressure, the subcooling degree showed an increasing trend. The subcooling degree increases with the increase of pressure under the same concentration of inhibitor.
3) As inhibitors of pyrrolidone polymer molecules broke the gas hydrate generated in the original phase equilibrium condition, in a certain temperature and pressure range inhibition, it cannot generate the gas hydrate. This breaks the original phase equilibrium during the formation of NGH, which inhibits the formation of NGH within a certain range of temperature and pressure.
The original contributions presented in the study are included in the article/Supplementary Material; further inquiries can be directed to the corresponding authors.
All authors listed have made a substantial, direct, and intellectual contribution to the work and approved it for publication.
The research was supported by the 111 Project (D21025), National Key Research and Development Program (No. 2019YFC0312302 and No. 2019YFC0312303), National Natural Science Foundation Item of China (No. 51874252), Open Fund Project of State Key Laboratory of Oil and Gas Reservoir Geology and Exploitation (No. PLN201816), and Scientific Research Starting Project of Southwest Petroleum University (No. 2018QHZ007).
CX was employed by Huaihe Energy (Group) Corporation, Ltd.
The remaining authors declare that the research was conducted in the absence of any commercial or financial relationships that could be construed as a potential conflict of interest.
All claims expressed in this article are solely those of the authors and do not necessarily represent those of their affiliated organizations, or those of the publisher, the editors and the reviewers. Any product that may be evaluated in this article, or claim that may be made by its manufacturer, is not guaranteed or endorsed by the publisher.
Barduhn, A. J., Towlson, H. E., and Hu, Y. C. (1962). The Properties of Some New Gas Hydrates and Their Use in Demineralizing Sea Water. Aiche J. 8, 176–183. doi:10.1002/aic.690080210
Carroll, J. (2009). Natural Gas Hydrates, A Guide for Engineers. 2nd Ed. Burling ton, MA: Gulf Professional Publishing.
Christiansen, R. L., and Sloan, E. D. (1995). “A Compact Model for Hydrate Formation,” in Presented at the 74th Annual Convention of the Gas Processors Association, San Antonio: Texas, 13–15 March.
Fan, L. A., Javanmardi, J., Eslamimanesh, A., and Mohammadi, A. H. (2016). Experimental Study and Modeling of Methane Hydrate Formation Induction Time in the Presence of Ionic Liquids. J. Mol. Liquids 221, 149–155. doi:10.1016/j.molliq.2016.05.016
Gholipour Zanjani, N., Zarringhalam Moghaddam, A., Nazari, K., and Mohammad-Taheri, M. (2012). Enhancement of Methane Purification by the Use of Porous media in Hydrate Formation Process. J. Pet. Sci. Eng. 96-97, 102–108. doi:10.1016/j.petrol.2012.09.001
Griffin, O. M., and Ramberg, S. E. (1982). Some Recent Studies of Vortex Shedding with Application to Marine Tubulars and Risers. J. Energ. Resour. Technology-Transactions ASME 104 (1), 2–13. doi:10.1115/1.3230377
Guo, T. M. (2002). Multiple Gas-Liquid Equilibrium and rectification[M]. Beijing: Petroleum Industry Press, 36–40.
Hammerschmidt, E. G. (1934). Formation of Gas Hydrates in Natural Gas Transmission Lines. Ind. Eng. Chem. 26, 851–855. doi:10.1021/ie50296a010
Hodder, M., and Popplestone, A. (2009). Wellbore Fluids Possessing Improved Rheological and Anti-Sag Properties[J]. Computer Design and Validation: US.
Kamath, B., Wong, N. M. S., Sabil, K., Nasrifar, M., and Ahmad, M. R. Kh. (2015). A Study on Thermodynamics Effect of [EMIM]- Cl and [OH-C2MIM]-Cl on Methane Hydrate Equilibrium Line. Fluid Phase Equilibria 337, 26–31. doi:10.1016/j.fluid.2012.09.025
Kannan, K., and Punase, A. (2009). “Low Dosage, High Efficiency and Environment Friendly Inhibitors: A New Horizon in Gas Hydrates Mitigationin Production Systems,” in SPE International Symposium on Oilfield Chemistry, Texas, April 20, 2009, 1. SPE120904.
Kim, J., Shin, K., Kim, J., Chang, D., Seo, Y., Chang, K. P., et al. (2011). “Kinetic Hydrate Inhibition Performance of MEG in Under-Inhibition System: Reduction Opportunities of MEG Injection for Offshore Gas Field Developments [J],” in Offshore Technology Conference Asia: Meeting the Challenges for Asia’s Growth, OTC ASIA 2014, Kuala Lumpur, 56, 377.
Kim, J., Shin, K., Seo, Y., Cho, S. J., and Lee, J. D. (2014). Synergistic Hydrate Inhibition of Monoethylene Glycol with Poly(vinylcaprolactam) in Thermodynamically Under inhibited System. J. Phys. Chem. B 118 (30), 9065–9075. doi:10.1021/jp503435t
Kvenvolden, K. A., Ginsburg, G. D., and Soloviev, V. A. (1993). Worldwide Distribution of Subaquatic Gas Hydrates. Geo-Marine Lett. 13 (1), 32–40. doi:10.1007/bf01204390
Li, X.-S., Liu, Y.-J., Zeng, Z.-Y., Chen, Z.-Y., Li, G., and Wu, H.-J. (2011). Equilibrium Hydrate Formation Conditions for the Mixtures of Methane + Ionic Liquids + Water. J. Chem. Eng. Data 56, 119–123. doi:10.1021/je100987q
Liu, G. (2017). Gas Pipeline Hydrate Prediction and Inhibitor Addition Calculation[J]. Nat. Gas Technol. Economy 03 (No.387), 61–63+89. doi:10.3969/j.issn.2095-1132.2017.03.014
Ma, Q.-L., Chen, G.-J., and Guo, T.-M. (2003). Modelling the Gas Hydrate Formation of Inhibitor Containing Systems. Fluid Phase Equilibria 205 (2), 291–302. doi:10.1016/s0378-3812(02)00295-9
Makogon, Y. F. (1981). Hydrates of Natural Gas. Editors W. J. Cieslesicz (Moscow, Nedra, Izadatelstro, Tulsa. Oklahoma: PennWell Books).
Mohebbi, V., and Behbahani, R. M. (2014). Experimental Study on Gas Hydrate Formation from Natural Gas Mixture. J. Nat. Gas Sci. Eng. 18, 47–52. doi:10.1016/j.jngse.2014.01.016
Phillips, N. J., and Grainger, M. (1998). “Development and Application of Kinetic Hydrate Inhibitors in the North Sea,” in Proceedings of SPE Gas Technology Symposium, Calgary, Alberta, March 18, 1998, 397. SPE40030-MS.
Quan, H. (2000). Clathrate Hydrates of Natural Gases. Seconded. New York: Marcel Dekker, Inc. 270 Madison Ave Printed in the United States of America.
Robinson, D. B., and Hutton, J. M. (1967). Hydrate Formation in Systems Containing Methane, Hydrogen Sulphide, and Carbon Dioxide. J. Can. Pet. Technol. 6, 1–4. doi:10.2118/67-01-02
Shi Bohui, M. R. (2014a). Experimental Investigation of Induction Time for Double Gas Hydrate Formation in the Simultaneous Presence of the PVP and L-Tyrosine as Kinetic Inhibitors in a Mini Flow Loop Apparatus. J. Nat. Gas Sci. Eng. 19, 215–220. doi:10.1016/j.jngse.2014.05.010
Shin, K., Kim, J., Seo, Y., and Kang, S-P. (2014). Effect of Kinetic Hydrate Inhibitor and Liquid Hydrocarbon on the Heterogeneous Segregation and Deposition of Gas Hydrate Particles[J]. Korean J. Chem. Eng. 31 (12), 2177–2182. doi:10.1007/s11814-014-0141-0
Sira N, H. J., and Robinson, D. B. (1977). The Prediction of Hydrate Formation in Condensed Systems. Am. Inst. Chem. Eng. J. 23, 477–482. doi:10.1002/aic.690230411
Wei, N., Meng, Y., Zhao, J., Zhou, S., Zhang, L., Li, Q., et al. (2017). Annular Phase Characteristics of Offshore Gas Hydrate Reservoir Drilling [J]. Acta Petrolei Sinica 038 (006), 710–720. doi:10.7623/syxb201706011
Wilson, G. M. (1964). Vapor-Liquid Equilibrium. XI. A New Expression for the Excess Free Energy of Mixing. J. Am. Chem. Soc. 86 (2), 127–130. doi:10.1021/ja01056a002
Zhao, W.-L., Zhong, D.-L., and Yang, C. (2016). Prediction of Phase Equilibrium Conditions for Gas Hydrates Formed in the Presence of Cyclopentane or Cyclohexane. Fluid Phase Equilibria 427, 82–89. doi:10.1016/j.fluid.2016.06.044
Keywords: natural gas hydrate, thermodynamic inhibitor, phase equilibrium, undercooling, induction time
Citation: Wei N, Xie C, Sun W, Li H, Jiang L and Zhang S (2021) An Experimental Study on the Formation of Natural Gas Hydrate With Thermodynamic Inhibitors . Front. Energy Res. 9:699356. doi: 10.3389/fenrg.2021.699356
Received: 23 April 2021; Accepted: 13 July 2021;
Published: 27 August 2021.
Edited by:
Chungang Xu, Guangzhou Institute of Energy Conversion (CAS), ChinaReviewed by:
Dongliang Zhong, Chongqing University, ChinaCopyright © 2021 Wei, Xie, Sun, Li, Jiang and Zhang. This is an open-access article distributed under the terms of the Creative Commons Attribution License (CC BY). The use, distribution or reproduction in other forums is permitted, provided the original author(s) and the copyright owner(s) are credited and that the original publication in this journal is cited, in accordance with accepted academic practice. No use, distribution or reproduction is permitted which does not comply with these terms.
*Correspondence: Na Wei, d2VpbmE4MDgxQDE2My5jb20=; Cuiying Xie, MTMwNTA3MjExQHFxLmNvbQ==; Wantong Sun, c3Vud3RAc3dwdS5lZHUuY24=
Disclaimer: All claims expressed in this article are solely those of the authors and do not necessarily represent those of their affiliated organizations, or those of the publisher, the editors and the reviewers. Any product that may be evaluated in this article or claim that may be made by its manufacturer is not guaranteed or endorsed by the publisher.
Research integrity at Frontiers
Learn more about the work of our research integrity team to safeguard the quality of each article we publish.