 Kun Sun
 Wei Yao
 Cai Yan
- State Key Laboratory of Advanced Electromagnetic Engineering and Technology, School of Electrical and Electronic Engineering, Huazhong University of Science and Technology, Wuhan, China
In the northwest of China, a strategy to transmit the wind-thermal–bundled power from the local grid and doubly fed induction generator (DFIG)–based wind farms through a voltage source converter–based HVDC (VSC-HVDC) can be widely applied. However, since the local grid is usually weak, a new type of electrical oscillation in the medium-frequency region may occur in the sending-end converter (SEC) of VSC-HVDC with PQ-control. The mechanism of this oscillation caused by the interaction between the DFIG, local grid, and SEC is not entirely understood. In this study, the sequence impedance model of the sending-end converter (SEC) of VSC-HVDC with the PQ-control outer loop and PLL is derived with the explicit analytic expression, and then, the oscillation mechanism is explored based on the intuitive analysis of the system impedance frequency characteristics. Compared with the subsynchronous oscillation (SSO) caused by the DFIG or power inverter, the theoretical analysis shows that this medium-frequency oscillation (MFO) mainly originates from the SEC due to its negative damping effect between about 100 and 200 Hz. In addition, the impact of the system controller parameters and operating conditions of the DFIG, local grid, and SEC on the oscillation characteristics is analyzed in detail. Finally, the correctness of the theoretical analysis is validated by time-domain simulation.
1 Introduction
In Northwest China, large-scale wind power is generally bundled with local thermal power and then transmitted to the load centers in the eastern coast, as the wind power is fluctuant and intermittent while the thermal power is controllable (Sun et al., 2017; Gao et al., 2018). Recently, the VSC-HVDC technology is developing rapidly due to its advantage in the wind power integration (Flourentzou et al., 2009; Yang et al., 2018; Chen et al., 2020; Sun et al., 2020; Xiong et al., 2021). Therefore, the strategy to transmit the large-scale wind power through VSC-HVDC in the local grid will be widely applied. However, the proposed transmission mode may face potential stability issues induced by the power electrical converters, especially given that the local grid in Northwest China is usually weak. Several oscillation incidents related to VSC-HVDC have occurred worldwide. In 2013, an SSO around 20 Hz occurred in the Nanao VSC-HVDC project in China and led to the outage of the integrated DFIG-based wind farms (Lyu et al., 2018). In addition, a 250–350 Hz current oscillation was observed in the North Sea VSC-HVDC project in Germany from the converter to the grid (Christoph et al., 2015; Zhou et al., 2019). Similarly, for the proposed system, the interaction between the DFIG-based wind farms, local grid, and VSC-HVDC may cause a new type of electrical oscillation issue, which is worthy of further study.
Currently, the impedance method is suitable for the stability issue caused by the grid-connected units due to its simple mathematical expression and stability criterion (Cespedes and Sun, 2014). There have been a lot of studies concentrating on the stability issue of the DFIG-based wind farms and VSC-HVDC based on the impedance method. For instance, the effect of the control parameters on the stability of the grid-connected converter is investigated in Wang et al. (2017), Wen et al. (2017), Xu et al. (2019), and Wang et al. (2020). However, in the above references, only the inner loop and PLL are considered in the modeling, while the influence of the outer loop is ignored. Thus, the accuracy of the stability analysis is doubtful. Recent references (Khazaei et al., 2018; Liu and Xie, 2019; Zhou et al., 2020) take the outer loop into account as well. However, the impedance model with the outer loop is normally given in matrix format instead of the explicit analytic expression, which is not clear and intuitive when it comes to illustrating the impedance characteristics. In addition, all of the above references only consider the outer loop of a power inverter instead of a converter. In Liu et al. (2021), Liu and Xie (2017), Miao (2012), Vieto and Sun (2018), Koralewicz et al. (2020), Yan et al. (2019), Yang et al. (2020), SSO existing in the DFIG-based wind farms interfaced with the series-compensated line or AC grid is investigated, and the impact of the various factors on SSO is analyzed. However, the influence of the integrated DFIG on the oscillation over the supersynchronous frequency region is not considered. Besides, few references consider the stability of the proposed system which transmits wind power in combination with thermal power through the SEC.
In particular, the interaction between the DFIG and VSC-HVDC is deeply analyzed in author’s previous work (Sun et al., 2019). However, the system stability will be affected in a different way when the wind-thermal–bundled power is transmitted from the local grid and DFIG-based wind farms to the SEC with PQ-control instead of the amplitude–frequency control. Since the local grid is integrated and the control strategy of the SEC is changed, the interaction mechanism will be more complicated in the proposed transmission mode. The similar system of a VSC-HVDC connected to the DFIG-based wind farm or the thermal power plant has been preliminarily analyzed in Chen et al. (2018), Liu et al. (2018), and Zou et al. (2018). However, they mainly focus on SSO or high-frequency oscillation issues, while MFO is not considered. In addition, the control strategy of the SEC in the proposed transmission mode is different from that in the above studies since the output power of the wind-thermal–bundled system should be controlled by the SEC (Yogarathinam et al., 2017) and then transmitted to the power grid. Thus, the outer loop of the SEC cannot be ignored since it reflects the effect of the control strategy. In short, the stability of the proposed transmission mode is not yet systematically comprehended. Therefore, this work aims to explore the interaction between the DFIG, local grid, and SEC with PQ-control in the medium-frequency region.
The main contributions of this study are summarized as:
• The potential MFO risk of the SEC with PQ-control in the medium-frequency region is analyzed when it transmits the wind-thermal–bundled power from the local grid and DFIG-based wind farms.
• To analyze the interaction mechanism in the proposed transmission mode, the sequence impedance model of the SEC with the PQ-control outer loop and PLL is derived with the explicit analytic expression, which is clear and intuitive when it comes to illustrating the impedance characteristics.
• The coupling between the inner loop, outer loop, and PLL of the SEC is analyzed according to the derived impedance models, and their influence on the system stability can be intuitively found based on the analytic impedance expression and the corresponding impedance frequency characteristics. Compared with the power inverter, the mechanism and characteristics of MFO caused by the SEC are different.
• The impact of the local grid strength and the integration of DFIG-based wind farms on the system stability is analyzed as well. Compared with SSO caused by the DFIG, the controller parameters and operating conditions of the DFIG have a different influence on this MFO which mainly originates from the SEC.
The rest of this article is organized as follows. The structure and oscillation phenomenon of the system is investigated in Section 2. Section 3 derives and validates the sequence impedance models of the SEC, the DFIG, and the local grid. In Section 4, the mechanism explanation of the oscillation is revealed based on the derived models, and the impact of various factors on the oscillation is analyzed. Section 5 validates the correctness of the theoretical analysis by time-domain simulation. Finally, conclusions are drawn in Section 6.
2 Structure and Oscillation Phenomenon of the System
The configuration of the investigated system is briefly introduced in this section. Then, time-domain simulation and spectrum analysis are conducted to analyze the potential electrical oscillation in the system.
2.1 System Configuration
The investigated system shown in Figure 1 contains three parts: the local grid with a thermal power unit, the DFIG-based wind farms, and the VSC-HVDC system. Both the thermal power and wind power are stepped up to 110 kV and then transmitted to the main grid via VSC-HVDC. In order to keep the transmission power stable, the constant power control is used in the SEC, while the receiving-end converter (REC) regulates the DC voltage. Since the wind power is fluctuant while the thermal power is controllable, the local thermal power keeps the total output power constant by means of its self-regulation (Xiao et al., 2016; Yogarathinam et al., 2017; Shah et al., 2018). Besides, the thermal power unit also maintains the stable AC voltage and frequency on the point of common coupling (PCC).
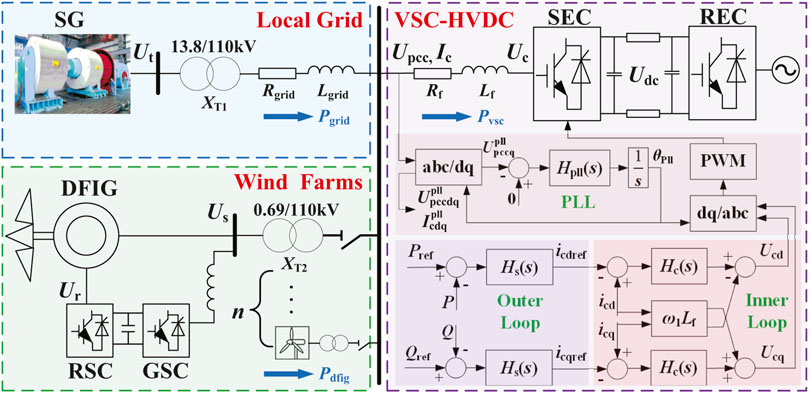
FIGURE 1. VSC-HVDC connected to the local grid and DFIG-based wind farms.
Initially, the wind farms contain 200 DFIG wind turbines (WTs), which run in the maximum power point tracking mode (GE 1.5 MW). The capacity of the VSC-HVDC is 500 MW. Normally, it requires the thermal power unit to stabilize the fluctuation of full wind power with at least 40% rated loads. Therefore, the capacity of the local thermal power unit is set to 500 MW. To simplify the modeling, the equivalent aggregated model of the DFIG is adopted (Kunjumuhammed et al., 2017; Peng et al. 2020), since the impact of DFIG integration on the system is of concern instead of the internal action among the turbines.
2.2 Oscillation Phenomenon
A detailed simulation model of the system shown in Figure 1 is established with a switching device model of the VSC-HVDC in MATLAB/Simulink, associated with the SimPowerSystems Blockset. To investigate the potential oscillation risk existing in the system, two scenarios are analyzed. The system parameters are listed in Tables 1–3.
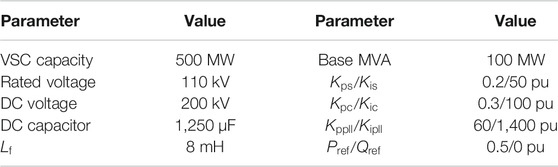
TABLE 1. Parameters of VSC-HVDC.
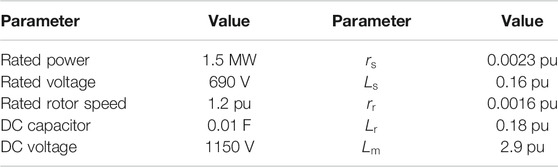
TABLE 2. Parameters of the DFIG.
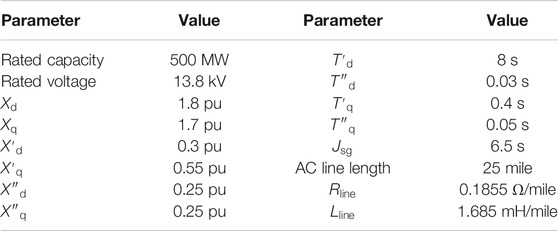
TABLE 3. Parameters of synchronous machine and AC line.
2.2.1 Scenario 1: The Effect of the Outer Loop of the SEC
Initially, the wind farms are not integrated. The short circuit ratio (SCR) of the local grid is set to 6.8, and the output active power of VSC-HVDC is set to 0.5 pu. At t = 6 s, the SCR decreases to 5.1. To analyze the effect of the PQ-control outer loop of the SEC, the simulation models both with and without the outer loop are adopted. Figure 2A shows the active power response on the PCC. Since the local grid strength decreases, it can be found that the oscillation emerges with the outer loop considered, while the system is still stable with the outer loop ignored. Thus, the outer loop of the SEC influences the system stability.
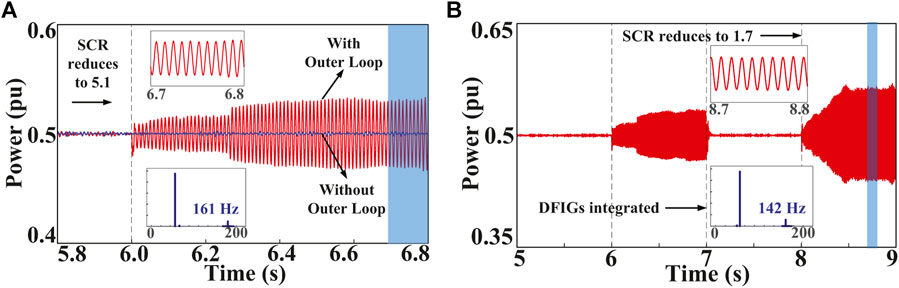
FIGURE 2. Oscillation phenomenon. (A) The effect of the outer loop of the SEC. (B) The effect of the integration of the DFIG.
2.2.2 Scenario 2: The Effect of the Integration of the DFIG
The condition is the same as in scenario 1, and the outer loop of SEC is considered. At t = 7 s, the wind farms are integrated under the wind speed at 10 m/s. At t = 8 s, the SCR further decreases to 1.7. According to Figure 2B, the electrical oscillation can be suppressed due to the integration of the DFIG. However, the electrical oscillation emerges again when the local grid becomes even more weak. Discrete Fourier transform (DFT) is applied for the spectrum analysis of the current on the PCC. The current contains an oscillation component at 161 Hz in the abc frame before the integration and reduces to 142 Hz after the integration.
Therefore, the oscillatory behavior of the system can be influenced by the parameters’ variation of the SEC, the DFIG, and the local grid. The frequency region of the electrical oscillation is about 100–200 Hz, which belongs to MFO.
3 System Modeling and Stability Criterion
In this section, the sequence impedance model of the sending-end converter (SEC) with the power loop and PLL is derived in detail with the explicit analytic expression and validated. Then, the impedance models of the DFIG and the local AC grid are built as well.
3.1 Impedance Model of the SEC With PQ-Control
3.1.1 Model With PLL and Current Loop
The control method of the SEC and REC is discussed in Section 2.1, and the control structure of the SEC is depicted in Figure 1. Since the impact of the REC on the stability is small due to the isolation provided by the DC link, only the impedance model of the SEC needs to be built in detail. The control of the SEC is based on the dq reference frame, in which the d-axis is orientated to the PCC voltage
The voltage equation of the SEC in the dq frame is expressed as
where
The small-signal model of the current controller of the SEC can be described as
where the subscript “ref” denotes the reference, and
Then, the influence of the PLL dynamics is taken into account. PLL is used for phase tracking of
For simplicity, the voltage and current are expressed in matrix form:
where
According to Figures 1–3, the small-signal circuit model of the SEC with the current loop and PLL is obtained and shown in the blue and green blocks of Figure 3.
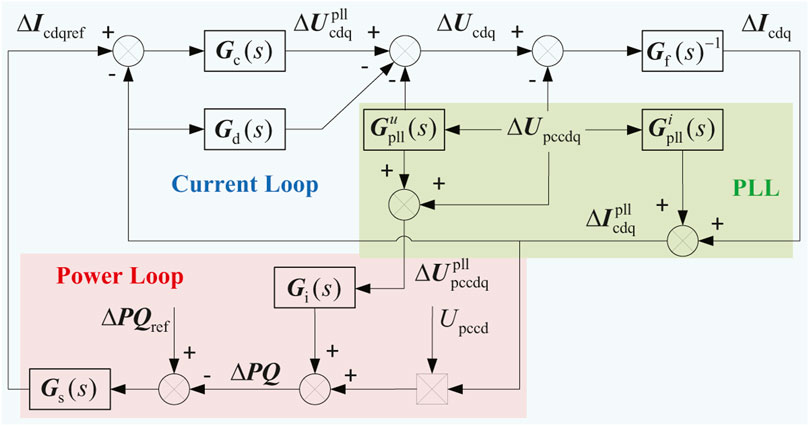
FIGURE 3. Small-signal circuit model of the sending-end station of VSC-HVDC.
According to Figure 3, the small-signal propagation path of the converter current in the current loop can be described as
3.1.2 Model With Power Loop
Then, the influence of the outer loop with PQ-control is taken into account. The small-signal model of the power controller of the SEC can be described as
where
The small-signal analysis is applied to the measured power, which is defined as
In addition, the small-signal propagation path of the power loop is depicted in the red block of Figure 3, where the power is expressed in matrix form:
where
Then, the dq impedance of the SEC seen from the terminal is derived by combining Eq. 6
However, the expression of the dq impedance model of the SEC is hard to understand since it has four components and each one does not contain an explicit physical meaning. Instead, to analyze intuitively and conveniently, the dq impedance model of the SEC can be transformed into the sequence impedance model by combining Eq. 12 and the following equation (Shah and Parsa, 2017)
where
According to Eq. 14, the sequence impedance of the SEC has an explicit analytic expression, which is intuitive and convenient for further analysis. The denominator of Eq. 14 mainly reflects the impact of the PLL dynamics.
3.2 Impedance Model of the DFIG
The control structure of the DFIG is depicted in Figure 1. The RSC regulates the power flowing between the stator and the grid, while the grid-side converter (GSC) regulates the DC voltage. Some simplifications are taken into account. For instance, the influence of the GSC and the excitation branch can be ignored since their magnitudes are sufficiently large in the investigated frequency region. Then, the positive sequence impedance model of the DFIG can be expressed as (Miao, 2012; Vieto and Sun, 2018; Sun et al., 2019; Liu et al., 2021)
where
3.3 Impedance Model of the Local Grid
The impedance of the local grid includes the internal impedance of the synchronous generator (SG) and the line impedance. The line impedance is expressed as
where
3.4 Validation and Stability Criterion
The verification and comparison of the impedance models are performed in Figure 4. The positive sequence impedance of the SEC is measured from 0 to 200 Hz with 40 points using the method of injecting current. A perturbation current (about 2% of rated current) at the measured frequency points is applied, and the related voltage is measured. The harmonic voltage and current in different frequency points are analyzed using the DFT tool. Thereby, the impedance is calculated by dividing the voltage by current at each frequency point. The operating condition for the measurement is given in Tables 1–3. As shown in Figures 4A,B, the impedance models of the SEC with or without PQ-control have been validated. It can be found that the PQ-control will influence the magnitude of
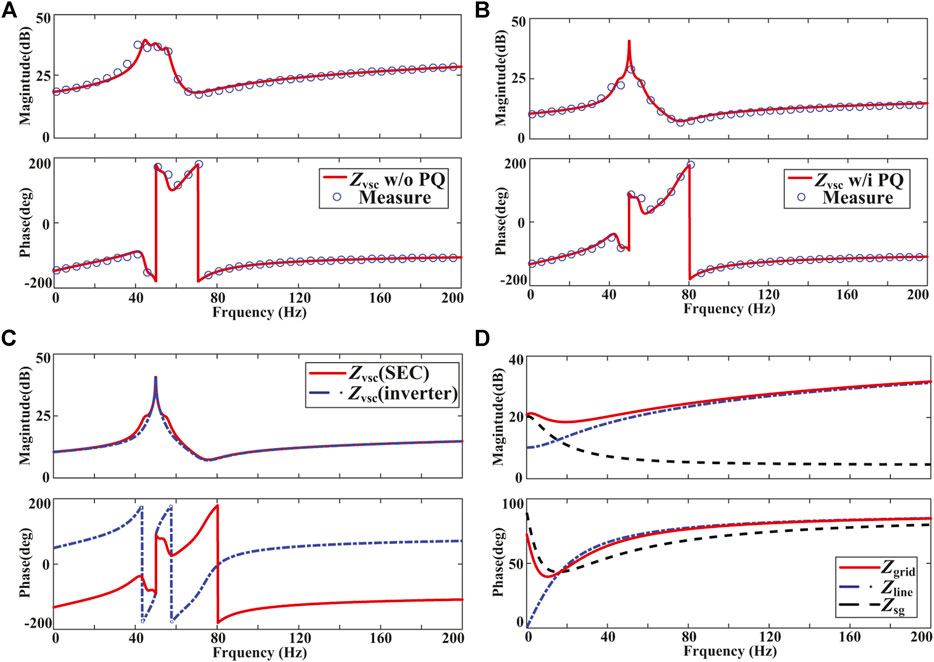
FIGURE 4. Validation and comparison of the impedance models; (A) validation of
Thereby, to investigate the interaction mechanism, the equivalent circuit model of the whole system is established by aggregating the impedance model of each part on the PCC, as shown in Figure 5A. In small-signal impedance analysis, the local grid is normally modeled as the Thevenin equivalent circuit, while the SEC and the wind farm are modeled as the Norton equivalent circuit. According to the impedance network model proposed in Liu et al. (2018), the system impedance can be aggregated by the parallel connection of wind farm impedance and AC grid impedance and then connected in series with SEC impedance. As shown in Figure 5B, the resistance and reactance of the whole system can be represented by the sum of each part.
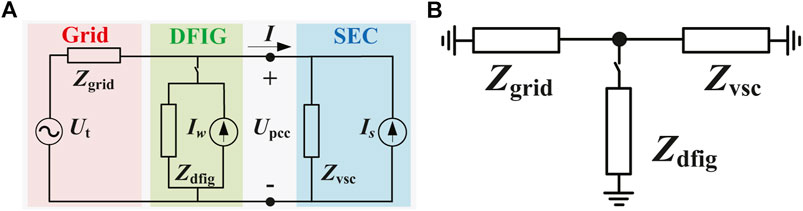
FIGURE 5. (A) Equivalent circuit model of the whole system. (B) Equivalent impedance network model of the whole system.
The stability criterion based on the second-order RLC series resonance circuit has been widely applied in recent works (Miao, 2012; Liu and Xie, 2017) to assess the system stability. By combining with this criterion and the derived impedance models, the oscillation mechanism and characteristics can be analyzed based on the impedance-frequency curves, which are more intuitive and convenient compared with the Nyquist plots
where
4 Mechanism and Characteristics Analysis
According to the equivalent impedance model of the system built in Section 3, the impact of local grid strength and SEC parameters on the system stability are analyzed in this section. Then, the effect of the integration of the DFIG-based wind farms on the oscillation is analyzed as well.
4.1 Local Grid Strength
To analyze the impact of local grid strength on the electrical oscillation, the variation of the SCR from 5.1 to 1.7 is analyzed under the same operating condition as Scenario 1 in Section 2.2 without the SEC outer loop and the integrated DFIG. The impedance-frequency curves of the grid and the SEC are depicted in Figure 6A. It can be found that both the resistance and reactance of the SEC follow a parabolic trend increase with the negative value. Note that in Figure 6A and the following figures, the grid reactance is represented by its opposite number
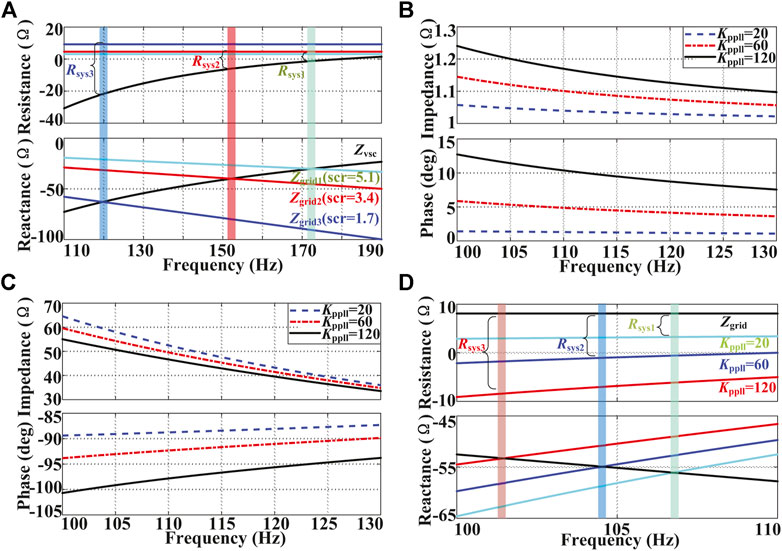
FIGURE 6. Impact of SCR on the impedance-frequency curves. (A)
4.2 Controller Parameters of the SEC
4.2.1 PLL Parameters of the SEC
According to Eq. 14, since the power loop is directly coupled with the current loop instead of PLL in the numerator, the term
The numerator of Eq. 18 represents the impedance of the SEC without considering the influence of PLL. According to Eq. 19, it can be found that the resistance of the SEC will be positive without the influence of PLL since
Then, the denominator of Eq. 18 which represents the influence of PLL is analyzed. Since
According to Eq. 20, both Re
The increase of
4.2.2 Current Loop Parameters of the SEC
According to Eq. 18,
The increase of
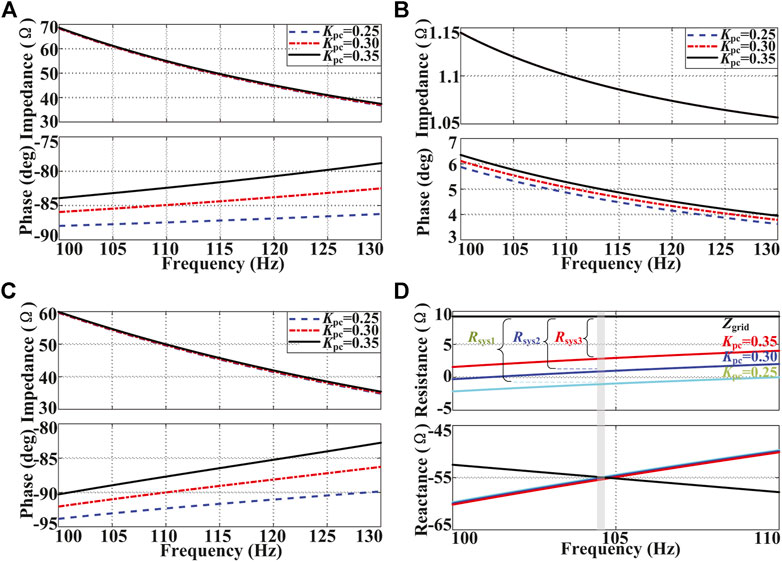
FIGURE 7. Impact of
In addition, the influence of
According to Eq. 22, the increase of
4.2.3 Power Loop Parameters of the SEC
The term
Obviously, the influence of the outer loop and inner loop on the impedance of the SEC is coupled directly. Considering
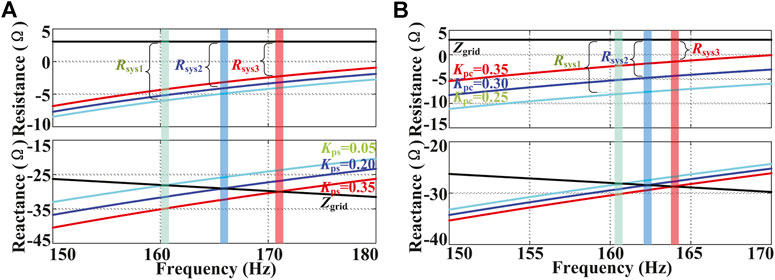
FIGURE 8. Impact of different factors on
In addition, when
4.3 Operating Condition and Controller Parameters of the DFIG
4.3.1 Number of Grid-Connected DFIG-WTs
The integration of the DFIG-based wind farms is not considered in the above subsections when focusing on the influence of the control parameters of the SEC. In this part, the effect of the number of grid-connected DFIG-WTs on the system stability is analyzed. According to Eq. 15, since the PLL dynamics of the DFIG mainly reflects the nearby fundamental frequency (Vieto and Sun, 2018; Sun et al., 2019), it can be neglected during the analysis in the investigated MFO region. Besides,
where n represents the number of DFIG-WTs. According to Eq. 24, the DFIG represents as a resistance-inductance since the rotor slip
According to Figure 5, the integration of the DFIG is equivalent to inserting an impedance on the PCC, which is in parallel with the local grid. The parallel impedance is still resistive and inductive in the investigated MFO region, which can be expressed as
where
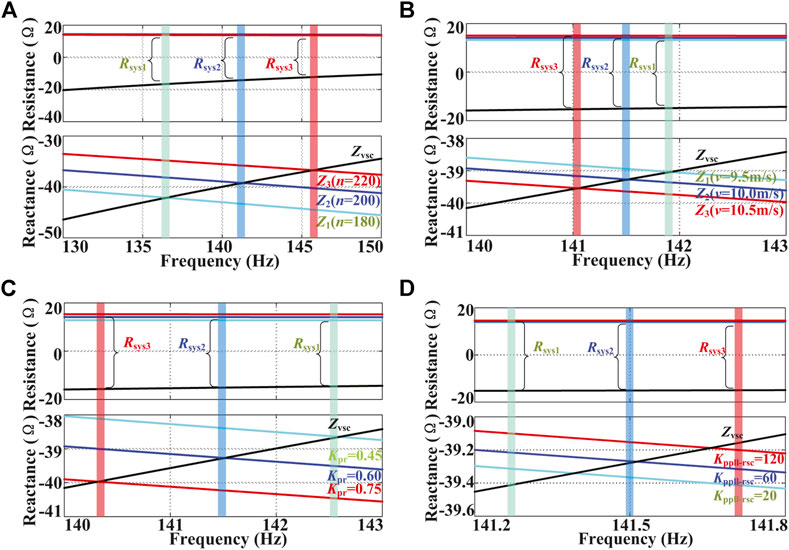
FIGURE 9. Impact of different factors on
4.3.2 Wind Speed
According to Eq. 24, the resistance of the DFIG can be expressed as
4.3.3 Current Loop Parameters of the RSC
With the increase of
4.3.4 PLL Parameters of the DFIG
In this part, the influence of PLL parameters of the DFIG is reconsidered based on the impedance model in Eq. 15. The influence of
5 Simulation Verification
The impact of the controller parameters and the operating condition of the system on the oscillation are investigated in Section 4. The time-domain simulations are conducted to validate the correctness of the theoretical analysis.
5.1 Local Grid Strength
The impact of the local grid strength is analyzed under the following operating condition: the number of grid-connected DFIG-WTs is 200, the wind speed is 10 m/s, SCR of the local grid is 3.4, and other system parameters are the same as in Section 2.2. Figure 10A shows the output active power responses on the PCC for a sudden change of the SCR from 1.2 to 2.5 at t = 6 s. Obviously, the oscillation state changes from convergent to divergent with the decrease of the SCR. Therefore, the system stability has a positive correlation with the local grid strength. The simulation results align with the analysis in Section 4.1.
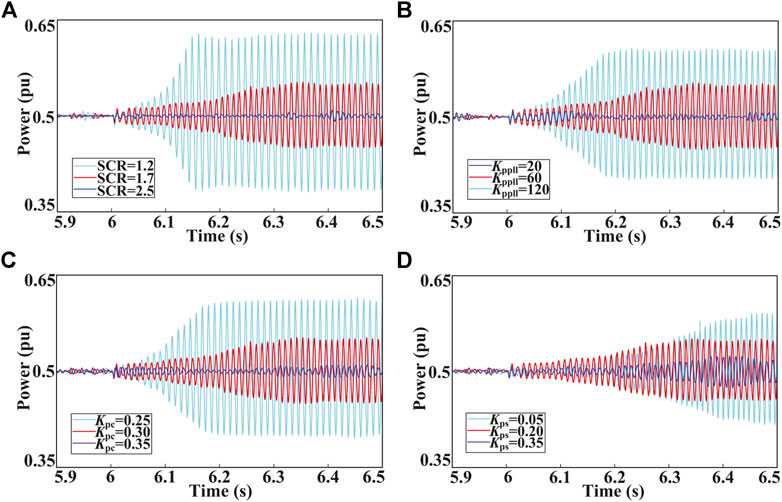
FIGURE 10. Output power varies with (A) SCR, (B)
5.2 Control Parameters of the SEC
The impact of the PLL, current loop, and power loop of the SEC on the oscillation characteristics is analyzed under the same operating condition as in Section 4.1, with a sudden change of the SCR from 3.4 to 1.7 at t = 6 s. As shown in Figure 10B, the output active power responses on the PCC with
5.3 Operating Condition and Controller Parameters of the DFIG
The impact of n, wind speed, RSC current loop, and PLL of the DFIG on the oscillation characteristics is analyzed under the same operating condition as in Section 5.2, with other control parameters of the SEC kept unchanged. Figure 11A shows that the output active power responds to the number of grid-connected DFIG-WTs, which ranges from 180 to 220. Obviously, the oscillation is gradually suppressed while the n increases. As shown in Figure 11B, the simulation results with the wind speed changes from 9.5 to 10.5 m/s are depicted. It can be observed that the system stability has a positive correlation with the wind speed. The output active power responses on the PCC with
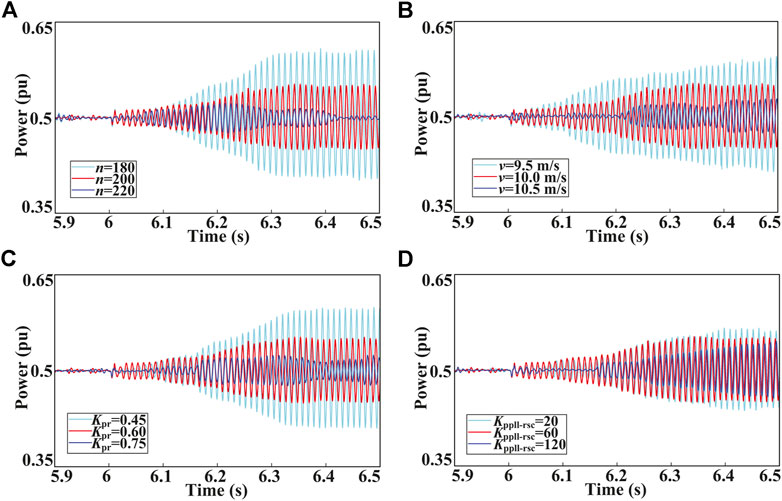
FIGURE 11. Output power varies with (A) number of DFIG-WTs, (B) wind speed, (C)
6 Conclusion
A SEC with PQ-control faces the potential risk of a new type of electrical oscillation in the medium-frequency region when it transmits the wind-thermal–bundled power from the local grid and DFIG-based wind farms. In this study, the sequence impedance model of the SEC with the explicit analytic expression is derived to help understand the mechanism and characteristics of MFO. This oscillation mainly originates from the SEC, while the local AC grid strength and the integration of DFIG-based wind farms also have an influence on it. With regard to the SEC controllers, the system stability is weakened with the increased proportional gain of the PLL controller. In addition, system stability has a positive correlation with the proportional gains of both the current loop and the power loop. However, the influence of the power loop is not as large as that of the current loop. Regarding the influence of the local grid strength, the oscillation risk increases when the local grid is weak. Contrary to the SSO mechanism of the DFIG, the risk of this oscillation decreases when relatively more DFIG-WTs are integrated at a high wind speed. Besides, system stability has a positive correlation with the proportional gains of the RSC current loop, while the influence of PLL of the RSC is slight. In conclusion, these factors can influence the system resistance at the resonant frequency, and the oscillation may appear due to the negative damping under the undesired operating conditions and controller parameters of the DFIG, local grid, and SEC. All the theoretical analyses are verified by time-domain simulation.
Data Availability Statement
The original contributions presented in the study are included in the article/Supplementary Material; further inquiries can be directed to the corresponding author.
Author Contributions
KS and WY contributed to the conception and design of the study. CY and JW organized case studies. KS wrote the first draft of the manuscript. All authors contributed to manuscript revision and read and approved the submitted version.
Funding
This work was supported by the National Key R&D Program of China (2019YFB1505400).
Conflict of Interest
The authors declare that the research was conducted in the absence of any commercial or financial relationships that could be construed as a potential conflict of interest.
Supplementary Material
The Supplementary Material for this article can be found online at: https://www.frontiersin.org/articles/10.3389/fenrg.2021.693903/full#supplementary-material
References
Baltas, G. N., Lai, N. B., Tarraso, A., Marin, L., Blaabjerg, F., and Rodriguez, P. (2021). Ai-based Damping of electromechanical oscillations by using grid-connected converter. Front. Energ. Res. 9, 598436. doi:10.3389/fenrg.2021.598436
Cespedes, M., and Jian Sun, J. (2014). Impedance Modeling and Analysis of Grid-Connected Voltage-Source Converters. IEEE Trans. Power Electron. 29, 1254–1261. doi:10.1109/TPEL.2013.2262473
Chen, C., Du, W., Du, W., Wang, H., and Littler, T. (2018). Sub-synchronous oscillations in power systems caused by grid-connected wind farms - a survey of mechanism studies. Csee Jpes 4, 495–503. doi:10.17775/CSEEJPES.2018.00560
Chen, J., Li, L., Dong, F., Wang, X., Sheng, H., Sun, C., et al. (2020). An improved coordination method of multi-terminal mmc-hvdc system suitable for wind farm clusters integration. Int. J. Electr. Power Energ. Syst. 117, 105652. doi:10.1016/j.ijepes.2019.105652
Christoph, B., Christian, R., Andreas, M., and Jochen, J. (2015). “Borwin1-first experiences with harmonic interactions in converter Dominated grids,” in Proc. 2015 Int. ETG Congress, Bonn, Germany, November 17–18, 2015, 592–602.
Flourentzou, N., Agelidis, V. G., and Demetriades, G. D. (2009). Vsc-based hvdc power transmission systems: an overview. IEEE Trans. Power Electron. 24, 592–602. doi:10.1109/TPEL.2008.2008441
Gao, B., Hu, Y., Song, R., Li, R., Zhang, X., Yang, L., et al. (2018). Impact of DFIG‐based wind farm integration on sub‐synchronous torsional interaction between HVDC and thermal generators. IET Generation, Transm. Distribution 12, 3913–3923. doi:10.1049/iet-gtd.2018.0328
Huang, L., Xin, H., Yuan, H., Wang, G., and Ju, P. (2021). Damping effect of virtual synchronous machines provided by a Dynamical virtual impedance. IEEE Trans. Energ. Convers. 36, 570–573. doi:10.1109/TEC.2020.3040605
Khazaei, J., Beza, M., and Bongiorno, M. (2018). Impedance analysis of modular multi-level converters connected to weak ac grids. IEEE Trans. Power Syst. 33, 4015–4025. doi:10.1109/TPWRS.2017.2779403
Koralewicz, P., Shah, S., Gevorgian, V., Wallen, R., Jha, K., Mashtare, D., et al. (2020). Impedance analysis and phil Demonstration of reactive power oscillations in a wind power plant using a 4-mw wind turbine. Front. Energ. Res. 8, 156. doi:10.3389/fenrg.2020.00156
Kunjumuhammed, L. P., Pal, B. C., Oates, C., and Dyke, K. J. (2017). The adequacy of the present practice in Dynamic aggregated modeling of wind farm systems. IEEE Trans. Sustain. Energ. 8, 23–32. doi:10.1109/TSTE.2016.2563162
Liu, B., Li, Z., Wang, H., Dong, X., Su, W., Li, G., et al. (2021). Impedance modeling of Dfig wind farms with various rotor speeds and frequency coupling. IEEE Trans. Circuits Syst. 68, 406–410. doi:10.1109/TCSII.2020.2997927
Liu, H., and Xie, X. (2019). Comparative studies on the impedance models of vsc-based renewable generators for ssi stability analysis. IEEE Trans. Energ. Convers. 34, 1442–1453. doi:10.1109/TEC.2019.2913778
Liu, H., Xie, X., and Liu, W. (2018). An Oscillatory Stability Criterion Based on the Unified $dq$ -Frame Impedance Network Model for Power Systems With High-Penetration Renewables. IEEE Trans. Power Syst. 33, 3472–3485. doi:10.1109/TPWRS.2018.2794067
Liu, H., Xie, X., Zhang, C., Li, Y., Liu, H., and Hu, Y. (2017). Quantitative ssr analysis of series-compensated Dfig-based wind farms using aggregated rlc circuit model. IEEE Trans. Power Syst. 32, 474–483. doi:10.1109/TPWRS.2016.2558840
Lyu, J., Cai, X., Amin, M., and Molinas, M. (2018). Sub‐synchronous oscillation mechanism and its suppression in MMC‐based HVDC connected wind farms. IET Generation, Transm. Distribution 12, 1021–1029. doi:10.1049/iet-gtd.2017.1066
Miao, Z. (2012). Impedance-model-based ssr analysis for type 3 wind generator and series-compensated network. IEEE Trans. Energ. Convers. 27, 984–991. doi:10.1109/TEC.2012.2211019
Peng, X., Yao, W., Yan, C., Wen, J., and Cheng, S. (2020). Two-stage variable proportion coefficient based frequency support of grid-connected Dfig-wts. IEEE Trans. Power Syst. 35, 962–974. doi:10.1109/TPWRS.2019.2943520
Shah, R., Sánchez, J. C., Preece, R., and Barnes, M. (2018). Stability and control of mixed AC-DC systems with VSC‐HVDC: a review. IET Generation, Transm. Distribution 12, 2207–2219. doi:10.1049/iet-gtd.2017.1140
Shah, S., and Parsa, L. (2017). Impedance modeling of three-phase voltage source converters in Dq, sequence, and phasor Domains. IEEE Trans. Energ. Convers. 32, 1139–1150. doi:10.1109/TEC.2017.2698202
Sun, B., Yu, Y., and Qin, C. (2017). Should china focus on the Distributed Development of wind and solar photovoltaic power generation? a comparative study. Appl. Energ. 185, 421–439. doi:10.1016/j.apenergy.2016.11.004
Sun, K., Xiao, H., You, S., Li, H., Pan, J., Li, K.-J., et al. (2020). Frequency secure control strategy for power grid with large-scale wind farms through hvdc links. Int. J. Electr. Power Energ. Syst. 117, 105706. doi:10.1016/j.ijepes.2019.105706
Sun, K., Yao, W., Fang, J., Ai, X., Wen, J., and Cheng, S. (2020). Impedance modeling and stability analysis of grid-connected Dfig-based wind farm with a vsc-hvdc. IEEE J. Emerg. Sel. Top. Power Electron. 8, 1375–1390. doi:10.1109/JESTPE.2019.2901747
Vieto, I., and Sun, J. (2018). Sequence impedance modeling and analysis of type-iii wind turbines. IEEE Trans. Energ. Convers. 33, 537–545. doi:10.1109/TEC.2017.2763585
Wang, L., Peng, J., You, Y., and Ma, H. (2019). Iterative approach to impedance model for small‐signal stability analysis. IET Renew. Power Generation 13, 78–85. doi:10.1049/iet-rpg.2018.5265
Wang, Q., Yao, W., Fang, J., Ai, X., Wen, J., Yang, X., et al. (2020). Dynamic modeling and small signal stability analysis of Distributed photovoltaic grid-connected system with large scale of panel level Dc optimizers. Appl. Energ. 259, 114132. doi:10.1016/j.apenergy.2019.114132
Wang, X., Harnefors, L., and Blaabjerg, F. (2018). Unified impedance model of grid-connected voltage-source converters. IEEE Trans. Power Electron. 33, 1775–1787. doi:10.1109/TPEL.2017.2684906
Wen, B., Boroyevich, D., Burgos, R., Mattavelli, P., and Shen, Z. (2017). Inverse nyquist stability criterion for grid-tied inverters. IEEE Trans. Power Electron. 32, 1548–1556. doi:10.1109/TPEL.2016.2545871
Xiao, H., Du, W., Song, Y., Wang, Q., Ding, J., Chen, D., et al. (2016). Wind-thermal-bundled power transmission by ac/dc system and coordinated control - a review. 12th IET International Conference on AC and DC Power Transmission (ACDC 2016), Beijing, China, January, 2016. doi:10.1049/cp.2016.0470
Xiong, Y., Yao, W., Wen, J., Lin, S., Ai, X., Fang, J., et al. (2020). Two-level combined control scheme of vsc-mtdc integrated offshore wind farms for onshore system frequency support. IEEE Trans. Power Syst. 36, 1. doi:10.1109/TPWRS.2020.2998579
Xu, J., Qian, Q., Zhang, B., and Xie, S. (2019). Harmonics and stability analysis of single-phase grid-connected inverters in Distributed power generation systems considering phase-locked loop impact. IEEE Trans. Sustain. Energ. 10, 1470–1480. doi:10.1109/TSTE.2019.2893679
Yan, C., Yao, W., Wen, J., Fang, J., Ai, X., and Wen, J. (2020). Modelling and comparison analysis of grid‐connected DFIG‐based wind farm in weak grid. IET Renew. Power Generation 14, 2406–2415. doi:10.1049/iet-rpg.2019.1382
Yan, C., Yao, W., Wen, J., Fang, J., Ai, X., and Wen, J. (2020). Optimal Design of probabilistic robust Damping controllers to suppress multiband oscillations of power systems integrated with wind farm. Renew. Energ. 158, 75–90. doi:10.1016/j.renene.2020.05.008
Yang, B., Jiang, L., Yu, T., Shu, H. C., Zhang, C.-K., Yao, W., et al. (2018). Passive control Design for multi-terminal vsc-hvdc systems via energy shaping. Int. J. Electr. Power Energ. Syst. 98, 496–508. doi:10.1016/j.ijepes.2017.12.028
Yogarathinam, A., Kaur, J., and Chaudhuri, N. R. (2017). Impact of inertia and effective short circuit ratio on control of frequency in weak grids interfacing lcc-hvdc and Dfig-based wind farms. IEEE Trans. Power Deliv. 32, 2040–2051. doi:10.1109/TPWRD.2016.2607205
Zhang, C., Cai, X., Molinas, M., and Rygg, A. (2019). Frequency‐domain modelling and stability analysis of a DFIG‐based wind energy conversion system under non‐compensated AC grids: impedance modelling effects and consequences on stability. IET Power Electro. 12, 907–914. doi:10.1049/iet-pel.2018.5527
Zhou, Q., Ding, Y., Mai, K., Bian, X., and Zhou, B. (2019). Mitigation of subsynchronous oscillation in a vsc-hvdc connected offshore wind farm integrated to grid. Int. J. Electr. Power Energ. Syst. 109, 29–37. doi:10.1016/j.ijepes.2019.01.031
Zhou, W., Wang, Y., Torres-Olguin, R. E., and Chen, Z. (2020). Effect of reactive power characteristic of offshore wind power plant on low-frequency stability. IEEE Trans. Energ. Convers. 35, 837–853. doi:10.1109/TEC.2020.2965017
Keywords: sending-end converter, local weak grid, doubly fed induction generator, impedance model, stability analysis, medium-frequency oscillation
Citation: Sun K, Yao W, Yan C and Wen J (2021) Impedance Modeling and Analysis of Medium-Frequency Oscillation Caused by VSC-HVDC Connected to Local Weak Grid and DFIG-Based Wind Farms. Front. Energy Res. 9:693903. doi: 10.3389/fenrg.2021.693903
Received: 12 April 2021; Accepted: 22 April 2021;
Published: 12 May 2021.
Edited by:
Bo Yang, Kunming University of Science and Technology, ChinaReviewed by:
Yang Liu, South China University of Technology, ChinaPing Zhao, China Three Gorges University, China
Copyright © 2021 Sun, Yao, Yan and Wen. This is an open-access article distributed under the terms of the Creative Commons Attribution License (CC BY). The use, distribution or reproduction in other forums is permitted, provided the original author(s) and the copyright owner(s) are credited and that the original publication in this journal is cited, in accordance with accepted academic practice. No use, distribution or reproduction is permitted which does not comply with these terms.
*Correspondence: Wei Yao, dy55YW9AaHVzdC5lZHUuY24=