 Zhuang Zhang
 You-Hua Chen
 Chien-Ming Wang2*
94% of researchers rate our articles as excellent or good
Learn more about the work of our research integrity team to safeguard the quality of each article we publish.
Find out more
ORIGINAL RESEARCH article
Front. Energy Res., 20 July 2021
Sec. Sustainable Energy Systems
Volume 9 - 2021 | https://doi.org/10.3389/fenrg.2021.693767
This article is part of the Research TopicSustainable Energy Systems with Policies in ChinaView all 23 articles
The influence of low-carbon energy on economic development is a vital issue. Using the provincial panel data in China from 2000 to 2017, this work investigated the aggregate effects of low-emission electricity. The results showed that 1) when the ratio of low-emission electricity to total electricity increases by 1%, the GDP per capita will increase by 0.16% and CO2 emissions will decrease by 0.848%. In other words, low-emission electricity can achieve the goal of low-carbon economic development; 2) the self-supply of low-emission electricity, rather than trade and efficiency, is the main reason for China’s boosted economic growth; and 3) low-emission electricity increases the regional economic gap in China. The effects of pollution inhibition and economic promotion on low-emission electricity in developed areas are significantly greater than those in less developed areas. Thus, the low-emission electricity policy in China should benefit the economy and avoid the excessive economic gap among regions. Policymakers should vigorously promote the low-emission electricity revolution and pay attention to the inclination of energy policy to the central and western regions.
The 2015 Paris Climate Conference claimed that, in this century, the global temperature rise should be brought to 2°C lower than that before industrialization and ideally should be below 1.5°C (UNFCCC, 2015; Azam et al., 2020; Duan et al., 2021). For its ambitious aim, China’s CO2 emissions and energy consumption should be reduced by more than 90 and 39%, respectively, and China’s cumulative policy costs may reach 2.8–5.7% of its GDP in 2050 (Duan et al., 2021). Duan et al. (2021) implied that the goal of CO2 emission reduction and economic growth may be hard to coordinate due to the enormous costs.
Is it tough for CO2 emission reduction to be compatible with the goal of economic growth1? Furthermore, what are the possible reasons? In response to Duan et al. (2021), we try to offer some details on the effects of low-emission electricity (LEE) on CO2 emission reduction and economic growth. In this article, by employing the clean electricity consumption data of China, we give evidence supporting an answer to the following questions: 1) Can LEE be beneficial to CO2 emission reduction and economic growth? 2) What are the possible mechanisms of LEE on economic development and CO2 emissions? 3) Does the development of LEE in an economically disadvantaged region lead to the difference in regional economic growth?
What we were facing is a paradox. On the one hand, we know the adverse effects of greenhouse gas emissions caused by burning fossil energy on ecosystem activities. On the other hand, energy is an essential engine of economic development, which affects our essential well-being (Mendonç et al., 2020). The novel coronavirus pandemic has had a great impact on the global economy, and the demand for almost all energy products has dropped sharply. However, these negative effects are expected to recover in the short term, and the global energy demand is expected to rise in 2025 (IEA, 2020). Simultaneously, CO2 emissions have increased from 205.18 million tons in 1990 to 32.314 billion tons in 2016 due to fossil fuel consumption and agriculture (IEA, 20182).
Electricity is an integral part of modern energy and plays an essential role in economic growth (Das et al., 2012; Hamida, 2012; Tang and Tan, 2012; Mahfoudh and Amar, 2014). Of course, the acquisition of electricity mostly depends on the transformation of traditional energy (such as fossil fuel). Similar to other fuel-oil energy, electricity consumption faces the contradiction between economic development and environmental protection. Fortunately, this does not constitute an irreconcilable contradiction. Recent studies demonstrated that the application of renewable energy had decreased CO2 emissions (Toumi and Toumi, 2019; Cosmas et al., 2019; Azam et al., 2020). Hydropower- and nuclear-related technologies have similar effects as well (Noorpoor and Kudahi, 2015). Unfortunately, not all countries or regions have enough economic or technological strength to produce electricity.
The electricity production of the world’s highest income countries accounts for almost 70% of the world’s electricity production (BPstats, 2018). The United States and European electric power consumption increased until 2007. Since then, their consumption has been slightly down (BPstats, 2018). From the perspective of electric technology, developed countries such as the United States, Canada, and Japan rely on coal energy less than 35%, while developing countries such as China and India rely on coal energy more than 60%. There is not enough data for third-world countries such as the sub-Saharan countries. As a representative sub-Saharan country, however, South Africa relies on coal energy as high as 87.73% for total electricity production. He et al. (2019) also reported that CO2 emissions in the sub-Saharan region based on fossil fuel were severe.
The development of electricity is unbalanced not only in the world but also within countries. In China, the capacity for developing LEE varies in different regions. For example, northwest China has a vast territory, short rainy seasons, and sufficient light. It has the natural advantage of developing solar energy, wind energy, and biogas. The limitations for these regions are that there are not enough capital and technical advantages. China’s coastal cities have certain technological advantages and can also develop geothermal energy and nuclear energy. For that of China's central region, the comparative advantages are not outstanding. China’s overall level of LEE is constantly improving. For example, the proportion of clean electricity increased from 11.8% in 2013 to 17.4% in 2017, but compared with 66% proposed by Duan et al. (2021), China still needs to make great efforts for clean electricity development.
To our knowledge, current studies care more about the effects of LEE among different countries (Ozturk, 2010; Polemis and Dagoumas, 2013; Alper and Oguz, 2016) or within a country (Lee and Chang, 2005; Ho and Siu, 2007; Ang, 2008; Karanfil, 2008; Zhang and Cheng, 2009). Nevertheless, few pay attention to the heterogeneous effects of LEE on CO2 emission reduction and economic growth in a country with unbalanced development. So, this work investigates the comprehensive effects of clean electricity based on the provincial panel data in China from 2000 to 2017. We found that 1) LEE development contributes to economic growth and carbon emission reduction, and its driving mechanism is internal LEE supply; 2) there are great differences in the impacts of LEE development among the three different regions of China; and 3) from 2000 to 2017, China’s LFE to economic growth and carbon emission reduction is increasingly significant.
The conclusions of this article is a response to the questions of Duan et al. (2021) on China’s energy cost pressure, and this study further offers a valuable paradigm for analyzing the LEE policy of countries with unbalanced economic development. The remainder of this article is arranged as follows. The second part introduces the literature review; the third part is the research design; the fourth part is the empirical analysis, which introduces the relationships among LEE, economic growth, and CO2 emissions; and the last part is the discussions and conclusions.
Discussion on the relationship between LEE, CO2 emissions, and economic growth is rare, while the research studies that involved energy and CO2 emissions have been relatively old. Although there are many inconsistencies in the current conclusions, they provide rich theoretical support for understanding the relationship between LEE, CO2 emissions, and economic growth. The pairwise correlation variables between the primary studies will be discussed in this section.
Energy can be the power support of production and can partly replace capital or labor input. So, it is considered one of the significant reasons for promoting economic growth (Ozturk, 2010). Previous studies focus on the causality between traditional electricity consumption and economic growth using various methods, but the results are always different. Some literature found that energy can promote economic growth unidirectionally (Lee and Chang, 2005; Ho & Siu, 2007; Karanfil, 2008). Some demonstrated that economic growth can promote energy use unidirectionally (Ang, 2008; Zhang and Cheng, 2009). At the same time, some others implied that the relationships between economic growth and energy use can be bidirectional (Polemis and Dagoumas, 2013; Ohler and Fetters, 2014). Some researchers showed no relationship between economic development and energy use (Payne, 2009; Menyah and Wolde-Rufael, 2010). In summary, the relationship between energy and economic growth is complex, and the situations vary significantly in different countries (Alper and Oguz, 2016; Ozturk, 2010).
Compared with fossil fuels, LEE is useful for its low carbon emission and renewability. Studies show relevant evidence for the effects of LEE on economic growth. Based on the data from South Korea, Yoo and Jung (2005) found the effects of nuclear energy on economic growth in the short and long terms. Heo et al. (2011) and Wolde-Rufael (2012) also found similar conclusions. Recently, the relationships between LEE and GDP have been exploited in numerous methods. For example, Azam et al. (2020) tried to figure out the impact of natural gas, nuclear energy, and renewable energy on CO2 emissions and economics. They found that the tasks of CO2 emission reduction and economic growth could be more compatible in nuclear and renewable energy. Magazzino et al. (2021) used machine learning to predict the future changes in CO2 in China, India, and the United States. They believe that renewable energy is a vital factor for the decline of CO2 in China and the United States. Abbas et al. (2020) found that renewable energy can help sustain environmental conditions without affecting economic growth among the “Belt and Road” countries.
However, dispute about the causal relationship between nuclear energy consumption and economic growth also exists. For example, national differences may affect the effect of nuclear energy on economic growth (Menyah and Wolde-Rufael, 2010; Chang et al., 2014). Their long-term and short-term single causal relationships may not be stable (Apergis and Payne, 2010).
Numerous previous studies focused on the long-term relationships between economic growth and energy consumption. Energy consumption relying on burning fossil fuels causes greenhouse gas emissions, leading to climate change and environmental degradation (Ahmad et al., 2018). For example, China's extensive economic development combined with the rapid growth of energy consumption has also led to many greenhouse gas emissions (Riti et al., 2017).
Fortunately, a large number of studies have found evidence that renewable energy reduces pollution shocks. Chen et al. (2019) found that the global level of carbon dioxide emissions has increased due to the increase in the energy demand in recent decades. The primary approach to reduce CO2 emissions is to develop renewable energy. Their study showed that nonrenewable energy and GDP growth increased CO2 emissions, while renewable energy and foreign trade harmed CO2 emissions. A study on carbon emissions in Nigeria showed a significant negative impact of renewable energy on carbon consumption (Cosmas et al., 2019). Zhang and Zhao (2019) believed that the investment in R&D and renewable energy plays a vital role in reducing CO2 emissions in China's geographically advantageous areas. Noorpoor and Kudahi (2015) found that population size, per capita GDP, power intensity, and electricity consumption positively impact CO2 emissions, while hydropower, nuclear power, and other renewable energy have a negative impact. Xu et al. (2019) showed that China’s per capita GDP and oil consumption are positively correlated with CO2 emissions, while natural gas consumption hurts emissions. A considerable part of the research also exhibited that renewable energy consumption increases energy self-sufficiency, stimulates sustainable economic growth, and reduces CO2 emissions (Noorpoor and Kudahi, 2015; Gill et al., 2018; Lin and Raza., 2019). Some studies suggested that there is not much relationship between nuclear energy and carbon emissions (Jaforullah and King, 2015; Cai et al., 2018).
Relevant studies made outstanding contributions on the relationships of energy use, CO2 emissions, and economic growth. To our best knowledge, these studies paid more attention to the effects of LEE among different countries (Polemis and Dagoumas, 2013; Alper and Oguz, 2016; Ozturk, 2010) or within a country (Lee and Chang, 2005; Ho and Siu, 2007; Ang, 2008; Karanfil, 2008; Zhang and Cheng, 2009), which provided solid theoretical support for the research of this article. However, few of them concern the LEE policy, especially electricity in a disadvantaged region; few focused on the possible mechanism of clean electricity boosting economic growth and heterogeneous effects of clean electricity on different areas in a country. These issues all inspired this article.
This article employs two-way fixed-effect model, SYS-GMM (System GMM method, Arellano and Bover, 1995), and panel quantile regression (Koenker, 2004; Harding and Lamarche, 2009) to survey the impacts of LEE on CO2 emissions and economic growth.
1) Two-way fixed effect model
In Eq. 1,
For panel data, we should choose the random effect model (RE) or the fixed effect model (FE) according to the rule of Eq. 2. According to Hausman’s method, if the difference between
The corresponding hypothesis test and the corresponding statistics are shown in Eq. 3,
2) SYS-GMM
To avoid estimate bias by potential endogeneity, we can add the lag term of
Then, based on Eq. 4, we can get the efficient estimator
3) Panel quantile regression
To capture the provincial effect of LEE, we use the panel quantile regression model extended by Koenker (2004) and Harding and Lamarche (2009),
In Eq. 5,
This article analyzed the effects of LEE on economic growth and CO2 emissions in China. Some variables can be found in CBS (China Bureau of Statistics, http://www.stats.gov.cn/tjsj/ndsj/), which is the official organization responsible for the collection and publication of China's demographic, political, and economic data. CBS’s official organization can offer variables such as fixed asset investment, employment, and per capita GDP. Other variables can be found in China's environmental statistical yearbook and China energy statistical yearbook, which could be easily found via the following link: https://www.epsnet.com.cn/index.html#/Home. From the two yearbooks, other variables, including CO2 emissions, the production and consumption of clean electricity, the amount of energy available for consumption in the region, the amount of electricity loss, and the total production and consumption of electricity, can be easily found out. Eventually, we obtain relatively complete data of 30 provinces in China from 2000 to 2017.
The proportion of LEE in total electricity consumption is used to capture the effects of clean electricity, which can overcome the trend of time and reflect the development and change of clean power more truly. To obtain a more efficient estimator of LEE on economic growth and CO2 emission, we controlled the relevant variables, such as total fixed assets investment, the number of people in work, and total electricity consumption.
To avoid time trends on the regression results, we perform panel unit root tests (see table 2) and panel co-integration tests (see table 3) for all key variables. Both LLC and IPS methods show no panel unit root, which indicates that the main variables are stable and there is no strong time trend (see table 2). The Kao, Pedroni, and Westerlund test show that LEE, CO2 emissions, and economic growth have a long-term relationship (see table 3). Next, we will use the panel data and the corresponding estimation methods to capture LEE’s impact on economic growth and CO2 emissions in detail. The description of variables is given in Table 1, the results of the panel unit-root test are shown in Table2, and the panel cointegration test results are outlined in Table 3.
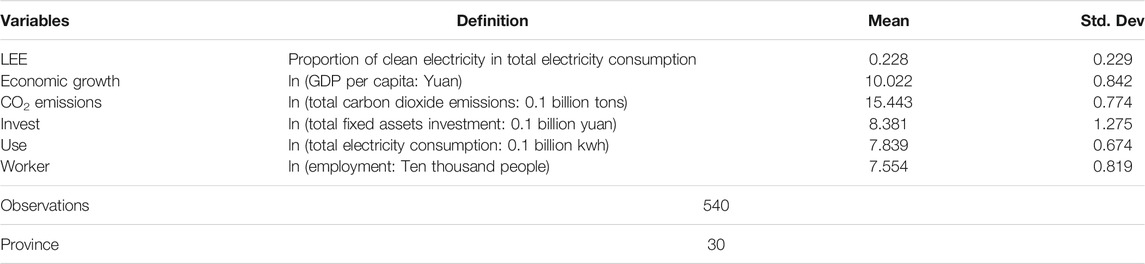
TABLE 1. Description and definition of variables3.
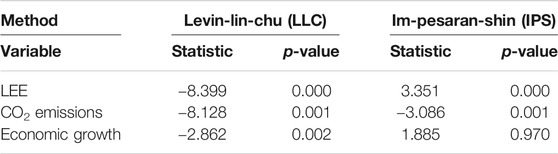
TABLE 2. Panel unit-root test.

TABLE 3. Panel cointegration test.
In Table 4, from model 1 to model 4, we can get the positive effect of LEE on economic growth consistently. Hausman statistics in Table 4 is 54.76, which is much larger than the critical value at the 5% significance level. Moreover, the corresponding p value is equal to 0.000, which shows strong support for FE. So, the results of FE are relatively correct. That is to say, keeping other variables fixed, when LEE increases by 1%, the GDP per capita will increase by 0.16%, and the parameter is significant.
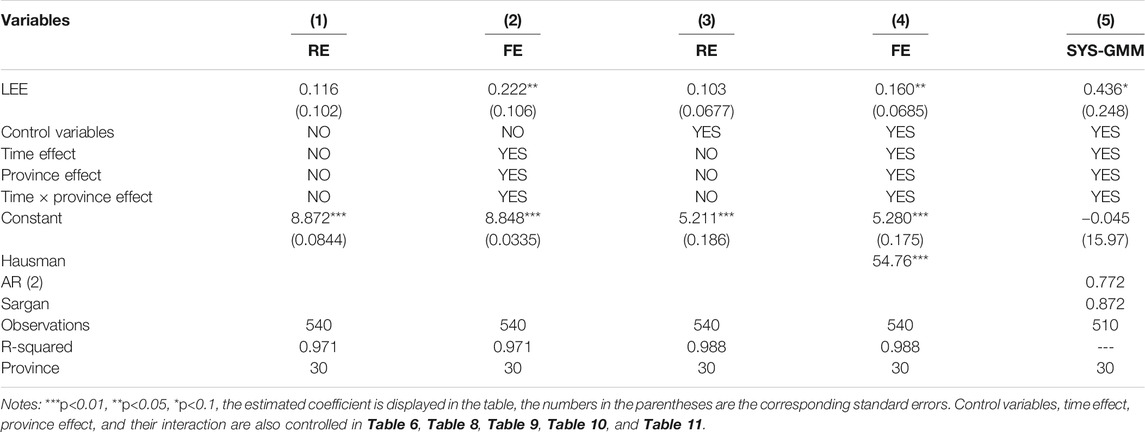
TABLE 4. Effects of LEE on economic growth.
However, a contrary effect of economic growth on LEE may exist. We cannot control the key variables, such as innovation, risk, and political reform, which may be the source of endogeneity. So, we restart to estimate the effects of LEE on economic growth by employing SYS-GMM. The results also support our conjecture.To better understand why LEE promotes economic growth, we choose some relevant variables, which are close to the economic function of LEE, from 2000 to 2015 to investigate the potential impact path. The related variables are listed in detail in Table 5. It should be emphasized that the data we found are hard to make a balanced panel. Nevertheless, the estimated results can also give us basic information on how LEE influences economic growth. After controlling the control variables, time effect, province effect, and their interaction, we get basic estimated results of LEE on relevant variables in Table 6. According to model 1 and model 2, LEE development could reduce transfer in the volume of electricity for some provinces in China. So, for some provinces whose economic source is power transmission, the inter provincial export of power will be obviously blocked. The results show that trade may be the short-term path for the effect of LEE on the economy, and it is hard to be the long-term one. To some extent, LEE can get rid of resource constraints for reducing local dependence on foreign electricity. In China, however, the diversity of geography and climate results in the congenital difference of clean resources. Although it is reasonable to develop local LEE, it is more important to give full play to the inherent advantages of resources, promote clean trade among regions, and achieve long-term stable growth (Table 6).

TABLE 5. Description and definition of relevant variables.
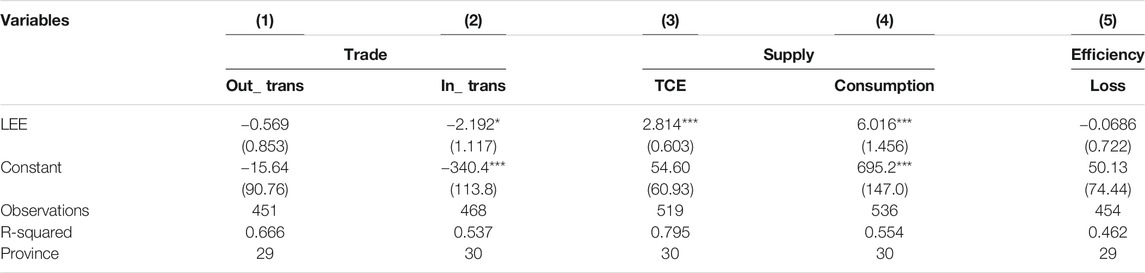
TABLE 6. Effects of LEE on relevant variables.
In terms of total LEE production, the quantity of electricity available for local consumption and the quantity of electric energy loss can also vividly demonstrate our ideas. The development of LEE promotes total LEE production and the quantity of electricity available for local consumption, which can partly support electricity's inner need. However, we should focus on the unobvious effects of LEE on the quantity of electric energy loss, which denotes the possible problems if a province only develops inner LEE without using the comparative advantages of other provinces rich in electric energy.
In Table 7, although different methods were used to estimate the effects of LEE on CO2 emissions, we consistently obtained the same results. The Hausman test implied that we should choose model 4 as the most effective model. That is to say, ceteris paribus, if LEE increases by 1%, CO2 emissions will approximately decrease by 0.848%. For lack of other control variables or ignorance effects of CO2 emissions on LEE, the estimated coefficient of LEE on CO2 emissions will be biased compared with true one (which means endogeneity probably exists in this study). Considering the potential endogeneity, we used SYS-GMM to capture the effect of LEE on CO2 emissions. The corresponding coefficient is −0.782, which is highly consistent with model 1 to model 4. Thus, an adverse effect of LEE on CO2 emissions may exist.
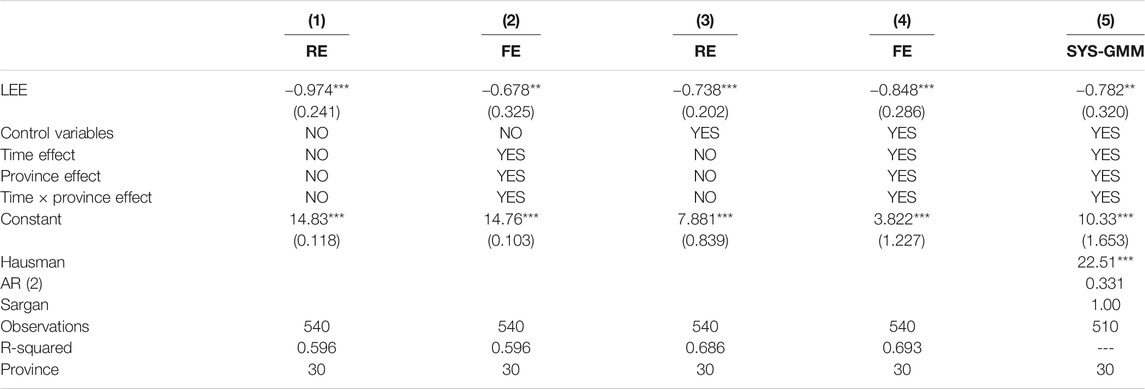
TABLE 7. Effects of LEE on CO2 emissions.
It is not hard to understand the negative effects of electric energy on CO2 emissions. Its features, such as renewability, environmentally friendliness, circularity, and cost-effectiveness, reduce CO2 emissions.
1) Renewability: Wind power, hydropower, and solar power are renewable energies. As long as they are reasonably used, these energy sources can continuously generate electricity and do not impact the environment.
2) Environmental protection: Promoting LEE can greatly reduce CO2 emissions. For example, construction of large- and medium-sized biogas projects in large- and medium-sized livestock farms produces a large amount of rural energy and solves the pollution of livestock manure.
3) Circularity: Developing LEE will open up new resources for China's economic growth. For example, an animal husbandry farm with an annual output of 100,000 pigs can produce 58,400 tons of feces. When properly processed, these feces—which are currently not only wasted but also disposed of in a manner causing pollution—can become a valuable resource. If these feces can be used for power, it could produce 5.5 million kilowatts per hour, and these energy sources can be applied to production again and again, with endless benefits.
4) Cost-effectiveness: The development of LEE can protect the environment and serve as the chain of the circular economy industry. It can solve the issues related to wastewater, waste residue, and waste gas in the production process of upstream products and use these wastes as the main raw materials of downstream products. It can save a lot of raw materials and has high economic value for production.
Based on the above analysis, the features of LEE and their influence on CO2 emissions are outlined in Figure 1.
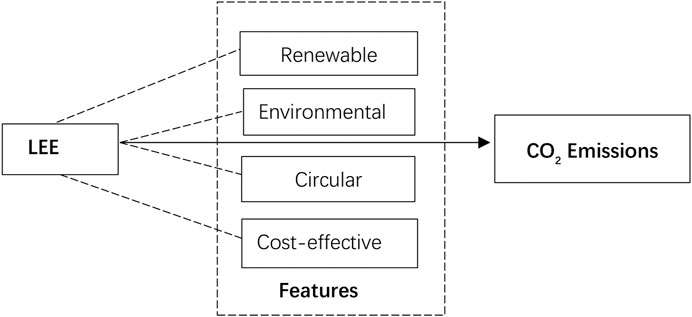
FIGURE 1. Features of LEE and its influences on CO2 emissions.
From Table 4,7, we find the positive effect of LEE on economic growth, and enough supply for the local province may be the potential path for its effects. Furthermore, we also show the contradiction of the province trade of the prosperous internal supply and the declining external supply of electricity, which will harm the balance of the economy. In this part, panel quantile regression and regression by areas are employed to test the ideas again.
The results of Table 8 demonstrate that the positive influence of LEE on economic growth would increase with the increase in economic growth, especially in Q75 and Q90, which implies that LEE will vigorously promote the economic growth of high-development areas compared to the low-development ones. The corresponding reason is far more likely that the regions that are economically disadvantaged do not have the resources to invest in LEE, while the regions that are economically advantaged do have the resources.
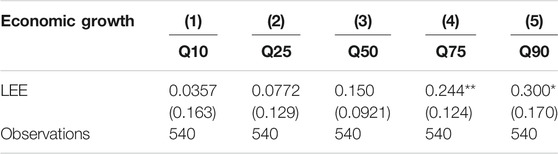
TABLE 8. Panel quantile regression of LEE on economic growth.
As for the results of Table 9, all the models cannot get a significant effect of LEE on CO2 emissions. However, the results show that the province could reduce its CO2 emissions more if its previous CO2 emission is too significant. Moreover, it is not fair in terms of development equity because the high-development areas based on significant CO2 emissions can enjoy more benefits from CO2 emission reduction and economic growth than the low-development ones.
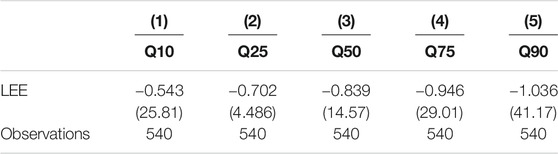
TABLE 9. Panel quantile regression of LEE on CO2 emissions.
The results of regression by areas also support our idea further (see Table 10). Model 1 and model 4 show that LEE can promote the economic growth of western areas but hamper the reduction in CO2 emission. However, model 3 and model 6 indicate that LEE can effectively make economic growth and reduce CO2 emissions together in eastern areas. As for central regions, the impacts of LEE are not significant. The results demonstrate that an LEE policy may benefit the eastern and western regions but makes no difference to central regions. Western areas have rich natural resources for producing low-emission electricity, and eastern areas can take full technological advantage of LEE. Although LEE can promote the economic growth of western and eastern areas, CO2 emissions of constructing LEE facilities could be detained in western areas. Due to the lack of comparative advantages of natural resources and technological innovations, the LEE has no significant impact on the central areas.
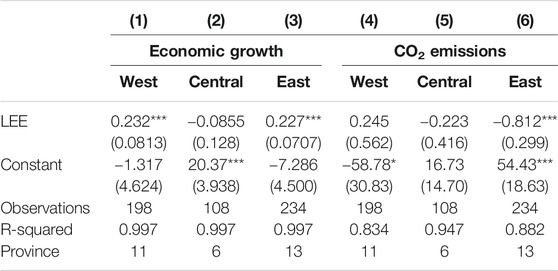
TABLE 10. Regression of LEE on CO2 emissions and economic growth by areas.
Based on Eq. 1, we add the interaction of LEE and time variable4, where
By this way, we can capture the annual effects of LEE on economic growth and CO2 emissions (results estimated are shown in Table 11). β1 and β2 denote the impact of LEE on economic growth and CO2 emissions, while p-value1 and p-value2 are their significance separately (see Table 11).
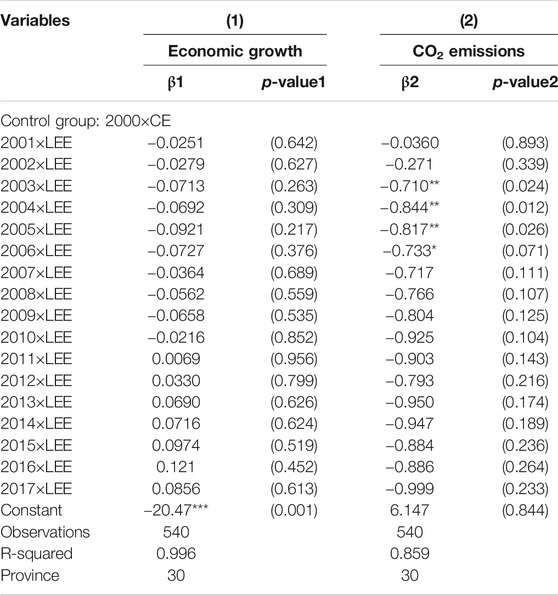
TABLE 11. Annual effects of LEE on CO2 emissions and economic growth.
Figure 2 captures the annual heterogeneity LEE’s influence on economic growth and CO2 emissions in Table 11. As shown in Figure 2A, β1 is smaller than zero before 2011 but larger than zero after 2011. Although LEE′s annual effects on economic growth are not significant, the corresponding coefficient implies the potential relationships between LEE and economic growth. The previous technology development and infrastructure construction of LEE need high costs. Only when these costs reach a particular scale can LEE promote the economy. After 2011, the positive effect of LEE on economic growth arises, and China maybe jumps into the range of growth benefits. As shown in Figure 2B, β2 becomes smaller and smaller with time and p-value2 is also small, which implies the increasing effects of LEE on CO2 emissions.
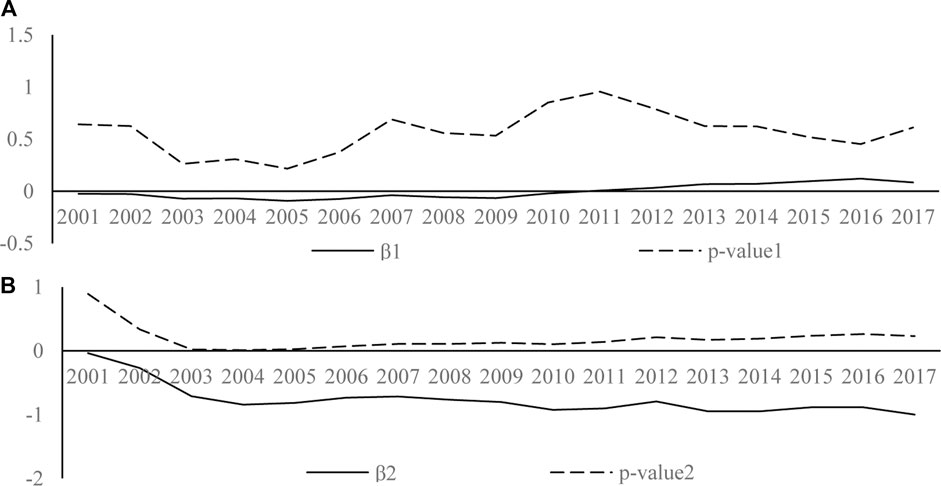
FIGURE 2. Annual effects of LEE on CO2 emissions and economic growth.
Using the provincial panel data from 2000 to 2017 in China, we investigate the effects of LEE on economic growth and CO2 emissions. The results show that LEE development can achieve the reduction in CO2 emissions and economic growth simultaneously. However, we should not ignore the reasons for LEE to regional heterogeneity. For economic growth, LEE can add the supply of LEE and electricity available to local consumption without any help to trade and efficiency. Therefore, the adverse effects of LEE on economic growth may be short-term and regional unbalance.
Then, according to the regional and annual heterogeneity, this work shows further evidence for these ideas. The results of regional heterogeneity exhibited that the effects of LEE on economic growth and CO2 emissions in eastern areas are better than those in western and central areas. Thus, LEE may widen the income gap between different areas. The results of annual heterogeneity imply that the effects of LEE on economic growth arise nowadays. However, the annual effects of LEE may be a little and not significant at the 5% significance level, which denotes the effects of LEE on economic growth, maybe short term.
It is very unwise to have an economy dependent on finite resources for the trend in fossil fuels is more expensive extraction. The phenomenal growth of light tight oil produced from fracking has produced little profit (Craig, 2020). Second, in many regions, solar energy is now cheaper than coal energy (IEA, 2020). If the global epidemic is under control, the world’s energy demand will recover by 2025 (IEA, 2020), but fossil fuel supply may struggle to keep up in the short term. Under-investment in oil exploration, for example, is a predictor of future oil price shocks (Hacquard et al., 2019). So, China should diversify its energy mix before it is obliged to because of decreasing availability of fossil fuels. Our research may provide valuable shreds of evidence for LEE policy. On the one hand, carrying out an LEE policy can reduce CO2 emissions and promote economic growth. However, on the other hand, regional heterogeneity implies that the policymakers should focus on the details of the policy being carried out. The policy implications are outlined as follows.
First, this article demonstrates that LEE can make CO2 emission reduction and economic growth compatible, but energy efficiency needs to be further enhanced. So, we should pay much attention to the LEE policy in the future. On the one hand, the government needs to strengthen financial investment in LEE and improve energy infrastructure construction; on the other hand, the government should pay attention to the improvement of LEE production technology, strive to improve energy production efficiency, and strive to achieve energy decarbonization as soon as possible.
Second, an LEE policy should be carried out in regions with comparative advantage of resources. Technological advantages of developed areas can be combined with the resource advantages of less developed areas. Even if the developed regions can achieve LEE self-sufficiency, they should also support the less developed regions as far as possible and help them transform their resource advantages into technological and economic advantages.
Third, early construction of LEE needs a lot of human, material, and financial resources and may have a certain degree of negative impact on the environment. Therefore, the development of LEE needs to pay attention to two crucial issues. On the one hand, policymakers should consider whether the current economic situation can support sustainable LEE construction. On the other hand, they should pay more attention to environmental protection in the construction process.
Finally, in developing LEE, those areas that have neither comparative technology advantage nor resource comparative advantage may not enjoy the blessing of LEE. For these areas, the government needs to tap their regional advantages, increase financial strength, and avoid an excessive regional development gap.
Data used in this study are available (https://www.epsnet.com.cn/index.html#/Home), all the code and data can be downloaded by private link (https://pan.baidu.com/s/17VSQtHQbXkDpc9NsSR2MTQ, Password of accessing is 6rid). Further inquiries can be directed to the corresponding authors.
ZZ wrote and revised this paper, Y-HC provided suggestions for the revision and framework of this paper, and C-MW gave some ideas of this paper.
This work was supported by the Key Program of the National Social Science Foundation of China (20&ZD117), Guangdong Social Science (GD2018CYJ01), the Foundation for Guangdong Province Universities and Colleges Pearl River Scholar Funded Scheme (GDUPS2019), the Natural Science Foundation of Guangdong (2021A1515011960).
The authors declare that the research was conducted in the absence of any commercial or financial relationships that could be construed as a potential conflict of interest.
Thanks to the editors and reviewers for their suggestions for revisions to this article. Of course, the authors are fully responsible for the content.
1We also recognize that COVID-19 caused uncertainty in economic growth and the contribution of energy to economic growth may be uncertain. Some studies suggested that energy, especially new energy, contributes to economic growth (Magazzino et al., 2021; Azam et al., 2020). However, there are also studies showing that energy had a negative impact on economic growth. For example, Garcia1 et al. (2020) believed that peak oil production will lead to economic contraction. The article gives compelling evidence that between 2000 and 2017 increasing the proportion of LEE in the energy mix contributed to economic growth and reduced CO2 emissions in some regions of China.
2According to the EPA (https://www.epa.gov/ghgemissions/global-greenhouse-gas-emissions-data) 24% of greenhouse gas emissions come from land use, while all transportation accounts for only 14%.
3Clean electricity here mainly includes nuclear energy, wind energy, and solar energy.
4For avoiding dummy variable trap, 2,000 is not considered.
Abbas, Q., Nurunnabi, M., Alfakhri, Y., Khan, W., Hussain, A., and Iqbal, W. (2020). The Role of Fixed Capital Formation, Renewable and Non-renewable Energy in Economic Growth and Carbon Emission: a Case Study of Belt and Road Initiative Project. Environ. Sci. Pollut. Res. 27, 45476–45486. doi:10.1007/s11356-020-10413-y
Ahmad, M., Khan, Z., Ur Rahman, Z., and Khan, S. (2018). Does Financial Development Asymmetrically Affect CO2 Emissions in China? an Application of the Nonlinear Autoregressive Distributed Lag (NARDL) Model. Carbon Manag. 9 (6), 631–644. doi:10.1080/17583004.2018.1529998
Alper, A., and Oguz, O. (2016). The Role of Renewable Energy Consumption in Economic Growth: Evidence from Asymmetric Causality. Renew. Sustain. Energ. Rev. 60, 953–959. doi:10.1016/j.rser.2016.01.123
Ang, J. B. (2008). Economic Development, Pollutant Emissions and Energy Consumption in Malaysia. J. Pol. Model. 30, 271–278. doi:10.1016/j.jpolmod.2007.04.010
Apergis, N., and Payne, J. E. (2010). A Panel Study of Nuclear Energy Consumption and Economic Growth. Energ. Econ. 32 (3), 545–549. doi:10.1016/j.eneco.2009.09.015
Arellano, M., and Bover, O. (1995). Another Look at the Instrumental Variable Estimation of Error-Components Models. J. Econom. 68 (1), 29–51. doi:10.1016/0304-4076(94)01642-d
Azam, A., Rafiq, M., Shafique, M., Zhang, H., and Yuan, J. (2020). Analyzing the Effect of Natural Gas, Nuclear Energy and Renewable Energy on GDP and Carbon Emissions: A Multi-Variate Panel Data Analysis. Energy 219, 119592. doi:10.1016/j.energy.2020.119592
BPstats, (2018). BP Statistical Review of World Energy in London. Edinburgh, United Kingdom: Centre for Energy Economics Research and Policy, Heriot-Watt UniversityAvailable at: https://www.bp.com/en/global/corporate/energy-economics/statistical-review-of-world-energy.html.
Cai, Y., Sam, C. Y., and Chang, T. (2018). Nexus between Clean Energy Consumption, Economic Growth and CO2 Emissions. J. Clean. Prod. 182, 1001–1011. doi:10.1016/j.jclepro.2018.02.035
Chang, T., Gatwabuyege, F., Gupta, R., Inglesi-Lotz, R., Manjezi, N. C., and Simo-Kengne, B. D. (2014). Causal Relationship between Nuclear Energy Consumption and Economic Growth in G6 Countries: Evidence from Panel granger Causality Tests. Prog. Nucl. Energ. 77, 187–193. doi:10.1016/j.pnucene.2014.07.006
Chen, Y., Wang, Z., and Zhong, Z. (2019). CO2 Emissions, Economic Growth, Renewable and Non-renewable Energy Production and Foreign Trade in China. Renew. Energ. 131, 208–216. doi:10.1016/j.renene.2018.07.047
Cosmas, N. C., Chitedze, I., and Mourad, K. A. (2019). An Econometric Analysis of the Macroeconomic Determinants of Carbon Dioxide Emissions in Nigeria. Sci. Total Environ. 675, 313–324. doi:10.1016/j.scitotenv.2019.04.188
Craig, F. (2020). U.S. Operators Working Down DUC Backlog. WorldoilAvailable at: https://www.worldoil.com/magazine/2021/april-2021/features/us-operators-working-down-duc-backlog.
Das, A., Chowdhury, M., and Khan, S. (2012). The Dynamics of Electricity Consumption and Growth Nexus: Empirical Evidence from Three Developing Regions. Margin: J. Appl. Econ. Res. 6 (4), 445–466. doi:10.1177/0973801012462121
Duan, H., Zhou, S., Jiang, K., Bertram, C., Harmsen, M., Kriegler, E., et al. (2021). Assessing China's Efforts to Pursue the 1.5°C Warming Limit. Science 372 (6540), 378–385. doi:10.1126/science.aba8767
Garcia1, L. E., Illig, A., and Schindler, I. (2020). Understanding Oil Cycle Dynamics to Design the Future Economy. Biophysical Econ. Sustainability 5, 15. doi:10.1007/s41247-020-00081-4
Gill, A. R., Viswanathan, K. K., and Hassan, S. (2018). A Test of Environmental Kuznets Curve (EKC) for Carbon Emission and Potential of Renewable Energy to Reduce green House Gases (GHG) in Malaysia. Environ. Dev. Sustain. 20 (3), 1103–1114. doi:10.1007/s10668-017-9929-5
Hacquard, P., Simoën, M., and Hache, E. (2019). Is the Oil Industry Able to Support a World that Consumes 105 Million Barrels of Oil Per Day in 2025? Oil Gas Sci. Technol. - Rev. IFP Energies Nouvelles 74, 88. doi:10.2516/ogst/2019061
Hamida, R. B. (2012). Electricity Consumption and Industrial Gross Domestic Product Nexus in Sfax: An ARDL Bounds Testing Approach. J. Energ. Develop. 38 (1/2), 241–255.
Harding, M., and Lamarche, C. (2009). A Quantile Regression Approach for Estimating Panel Data Models Using Instrumental Variables. Econ. Lett. 104, 133–135. doi:10.1016/j.econlet.2009.04.025
He, J., Lu, L., and Wang, H. (2019). The Win-Win Pathway of Economic Growth and CO2 Emission Reduction: a Case Study for China. Chin. J. Popul. Resour. Environ. 00, 1–12. doi:10.1080/10042857.2019.1574485
Heo, J.-Y., Yoo, S.-H., and Kwak, S.-J. (2011). The Causal Relationship between Nuclear Energy Consumption and Economic Growth in India. Energ. Sourc. B: Econ. Plann. Pol. 6 (2), 111–117. doi:10.1080/15567240802533971
Ho, C.-Y., and Siu, K. W. (2007). A Dynamic Equilibrium of Electricity Consumption and GDP in Hong Kong: an Empirical Investigation. Energy Policy 35 (4), 2507–2513. doi:10.1016/j.enpol.2006.09.018
IEA (2018). Statistics CO2 Emissions from Fuel Combustion-Highlights. Paris, France: International Energy Agency (IEA)Available at: https://webstore.iea.org/download/direct/2373?fileName=CO2_Emissions_from_Fuel_Combustion_2018_Highlights.pdf.
IEA (2020). World Energy Outlook 2020. Paris, France: International Energy Agency (IEA)Available at: https://www.iea.org/reports/world-energy-outlook-2020.
Jaforullah, M., and King, A. (2015). Does the Use of Renewable Energy Sources Mitigate CO2 Emissions? A Reassessment of the US Evidence. Energ. Econ. 49, 711–717. doi:10.1016/j.eneco.2015.04.006
Karanfil, F. (2008). Energy Consumption and Economic Growth Revisited: Does the Size of Unrecorded Economy Matter? Energy Policy 36 (8), 3029–3035. doi:10.1016/j.enpol.2008.04.002
Koenker, R. (2004). Quantile Regression for Longitudinal Data. J. Multivariate Anal. 91 (1), 74–89. doi:10.1016/j.jmva.2004.05.006
Lee, C.-C., and Chang, C.-P. (2005). Structural Breaks, Energy Consumption, and Economic Growth Revisited: Evidence from Taiwan. Energ. Econ. 27, 857–872. doi:10.1016/j.eneco.2005.08.003
Lin, B., and Raza, M. Y. (2019). Analysis of Energy Related CO2 Emissions in Pakistan. J. Clean. Prod. 219, 981–993. doi:10.1016/j.jclepro.2019.02.112
Magazzino, C., Mele, M., and Schneider, N. (2021). A Machine Learning Approach on the Relationship Among Solar and Wind Energy Production, Coal Consumption, GDP, and CO2 Emissions. Renew. Energ. 167, 99–115. doi:10.1016/j.renene.2020.11.050
Mahfoudh, S., and Amar, M.B. (2014). The Importance of Electricity Consumption in Economic Growth: The Example of African Nations. J. Energ. Develop. 40 (1/2), 99–110.
Mendonç, A. K., Barni, G. A., Mor, M.F., and Bornia, A.C. (2020). Hierarchical Modeling of the 50 Largest Economies to Verify the Impact of GDP, Population and Renewable Energy Generation in CO Emissions. Sustainable Prod. Consumption 22, 58–67. doi:10.1016/j.spc.2020.02.001
Menyah, K., and Wolde-Rufael, Y. (2010). CO2 Emissions, Nuclear Energy, Renewable Energy and Economic Growth in the US. Energy Policy 38 (6), 2911–2915. doi:10.1016/j.enpol.2010.01.024
Noorpoor, A. R., and Kudahi, S. N. (2015). CO2 emissions from Iran's Power Sector and Analysis of the Influencing Factors Using the Stochastic Impacts by Regression on Population, Affluence and Technology (STIRPAT) Model. Carbon Manag. 6 (3–4), 101–116. doi:10.1080/17583004.2015.1090317
Ohler, A., and Fetters, I. (2014). The Causal Relationship between Renewable Electricity Generation and GDP Growth: a Study of Energy Sources. Energ. Econ. 43, 125–139. doi:10.1016/j.eneco.2014.02.009
Ozturk, I. (2010). A Literature Survey on Energy-Growth Nexus. Energy Policy 38, 340–349. doi:10.1016/j.enpol.2009.09.024
Payne, J. E. (2009). On the Dynamics of Energy Consumption and Output in the US. Appl. Energ. 86 (4), 575–577. doi:10.1016/j.apenergy.2008.07.003
Polemis, M. L., and Dagoumas, A. S. (2013). The Electricity Consumption and Economic Growth Nexus: Evidence from Greece. Energy Policy 62 (C), 798–808. doi:10.1016/j.enpol.2013.06.086
Riti, J. S., Song, D., Shu, Y., and Kamah, M. (2017). Decoupling CO2 Emission and Economic Growth in China: Is There Consistency in Estimation Results in Analyzing Environmental Kuznets Curve? J. Clean. Prod. 166, 1448–1461. doi:10.1016/j.jclepro.2017.08.117
Tang, C. F., and Tan, E. C. (2012). Electricity Consumption and Economic Growth in Portugal: Evidence from a Multivariate Framework Analysis. Energ. J. 33 (4), 23–48. doi:10.5547/01956574.33.4.2
Toumi, S., and Toumi, H. (2019). Asymmetric Causality Among Renewable Energy Consumption, CO2 Emissions, and Economic Growth in KSA: Evidence from a Non-linear ARDL Model. Environ. Sci. Pollut. Res. 26 (16), 16145–16156. doi:10.1007/s11356-019-04955-z
UNFCCC (2015). Conference of the Parties (COP). Paris Climate Change Conference-November 2015, Paris, November 30–December 11, 2015. Available at: FCCC/CP/2015/L.9/Rev.1.
Wolde-Rufael, Y. (2012). Nuclear Energy Consumption and Economic Growth in Taiwan. Energ. Sourc. Part B: Econ. Plann. Pol. 7 (1), 21–27. doi:10.1080/15567240802564752
Wooldridge, J. M. (2016). Introductory Econometrics: A Modern Approach. 5th Edn. Boston: Cengage Learning Press.
Xu, B., Zhong, R., and Liu, Y. (2019). Comparison of CO2 Emissions Reduction Efficiency of Household Fuel Consumption in China. Sustainability 11, 979. doi:10.3390/su11040979
Yoo, S.-H., and Jung, K.-O. (2005). Nuclear Energy Consumption and Economic Growth in Korea. Prog. Nucl. Energ. 46 (2), 101–109. doi:10.1016/j.pnucene.2005.01.001
Zhang, S., and Zhao, T. (2019). Identifying Major Influencing Factors of CO2 Emissions in China: Regional Disparities Analysis Based on STIRPAT Model from 1996 to 2015. Atmos. Environ. 207, 136–147. doi:10.1016/j.atmosenv.2018.12.040
Keywords: low-emission energy, CO2 emissions, economic growth, regional heterogeneity, balance of development
Citation: Zhang Z, Chen Y-H and Wang C-M (2021) Can CO2 Emission Reduction and Economic Growth Be Compatible? Evidence From China. Front. Energy Res. 9:693767. doi: 10.3389/fenrg.2021.693767
Received: 12 April 2021; Accepted: 03 June 2021;
Published: 20 July 2021.
Edited by:
Ian Edmund William Schindler, Université Toulouse 1 Capitole, FranceReviewed by:
Minxing Jiang, Nanjing University of Information Science and Technology, ChinaCopyright © 2021 Zhang, Chen and Wang. This is an open-access article distributed under the terms of the Creative Commons Attribution License (CC BY). The use, distribution or reproduction in other forums is permitted, provided the original author(s) and the copyright owner(s) are credited and that the original publication in this journal is cited, in accordance with accepted academic practice. No use, distribution or reproduction is permitted which does not comply with these terms.
*Correspondence: You-Hua Chen, Q2hlbnlodWEyMTRAMTYzLmNvbQ==; Chien-Ming Wang, Y213YW5nOEBnbWFpbC5jb20=
Disclaimer: All claims expressed in this article are solely those of the authors and do not necessarily represent those of their affiliated organizations, or those of the publisher, the editors and the reviewers. Any product that may be evaluated in this article or claim that may be made by its manufacturer is not guaranteed or endorsed by the publisher.
Research integrity at Frontiers
Learn more about the work of our research integrity team to safeguard the quality of each article we publish.