 Ran Li
 Wenrui Li
 Haonian Zhang2
- 1Engineering Research Center, Ministry of Education of Automotive Electronics Drive Control and System Integration, Harbin University of Science and Technology, Harbin, China
- 2School of Electrical and Electronic Engineering, Harbin University of Science and Technology, Harbin, China
- 3China Henan Xintaihang Power Source Co., Ltd., Xinxiang, China
Battery management system (BMS) refers to a critical electronic control unit in the power battery system of electric vehicles. It is capable of detecting and estimating battery status online, especially estimating state of charge (SOC) and state of health (SOH) accurately. Safe driving and battery life optimization are of high significance. As indicated from recent literature reports, most relevant studies on battery health estimation are offline estimation, and several problems emerged (e.g., long time-consuming, considerable calculation and unable to estimate online). Given this, the present study proposes an online estimation method of lithium-ion health based on particle swarm support vector machine algorithm. By exploiting the data of National Aeronautics and Space Administration (NASA) battery samples, this study explores the changing law of battery state of charge under different battery health. In addition, particle swarm algorithm is adopted to optimize the kernel function of the support vector machine for the joint estimation of battery SOC and SOH. As indicated from the tests (e.g., Dynamic Stress Test), it exhibits good adaptability and feasibility. This study also provides a certain reference for the application of BMS system in electric vehicle battery online detection and state estimation.
Introduction
Energy shortage and environmental pollution turn out to be global issues, and electric vehicles are being increasingly used. Lithium-ion batteries, as the main power source of electric vehicles, impact the safe operation of electric vehicles (Li et al., 2020). Battery SOC refers to a vital parameter to measure the performance of lithium-ion batteries. SOH acts as an indicator to measure battery life. Online estimation research of lithium-ion battery SOC and SOH is conducted, the real-time parameters of battery working status are determined, and the energy efficiency of electric vehicles is improved, which is critical to extend the cycle life of the battery.
The factors of battery SOH are more complicated. There are three common SOH prediction methods, i.e., model building method Duan et al. (2020), Lai et al. (2020), Xiao et al. (2020), Gholizadeh and Yazdizadeh (2019), Hu et al. (2020), experimental measurement method Tang et al. (2018), Weng et al. (2016) and data-driven method (Khaleghi et al., 2019; Li et al., 2019; You et al., 2016; Klass et al., 2014). The method of model establishment primarily exploits the corresponding adaptive algorithm to continuously update the battery model parameters, as an attempt to adapt the model to different working conditions. Wang et al. (2019) proposed the equivalent circuit model (ECM) based on the Constant Voltage (CV) charging current curve to extract the corresponding feature quantity. To obtain the SOH of the battery, Yang et al. (2018) proposed a Gaussian process regression model based on the charging curve for the prediction of the SOH of the battery. However, the mentioned algorithms are highly dependent of the model. Whether the parameters can be updated in time significantly impacts the SOH estimation results of the battery. The experimental measurement methods primarily cover electrochemical impedance spectroscopy (EIS), capacity increment analysis, etc. Eddahech et al. (2012) proposed a method of SOH estimation based on capacity incremental analysis (ICA). By extracting the corresponding peak points, the method of Gaussian regression is adopted to build the SOH model of the battery, whereas the defect is that there are fewer peak points. Besides, a complete charging process should be achieved. With the rise of big data platforms, data-driven methods under machine learning methods have aroused widespread attention from scholars. Data-driven methods are not required to understand the internal structure and working principles of the battery, and rely solely on the extraction of the corresponding aging characteristics of the battery that are inputted into the corresponding SOH estimator to obtain the health of the battery. As reported by existing studies, the common battery aging characteristics largely include capacity, internal resistance Ji et al. (2020), Chen et al. (2018), Hung et al. (2014), battery cycle times Wognsen et al. (2015), and the use of stacking pressure Cannarella and Arnold (2014), SEI impedance Zhang and Wang (2009), etc. Meng et al. (2018) developed a new method for accurately estimating battery SOH using support vector machine (SVM) technology, which selects the sharp point of the voltage response curve to be the characteristic quantity of battery SOH. The sum slope can be well exploited in practical tests, whereas this method should select the appropriate estimated characteristic quantity in advance. Different battery models are adversely affected by different choices of characteristic quantity, so it is more estimated to be complex. Second, as the battery continues to age, the capacity of the battery gradually decays, which to a certain extent impacts the estimation of the SOC and SOH of the battery. SOC and SOH cannot be estimated separately, and a certain potential coupling relationship is identified between the two. The SOC parameter of the battery should be employed as a vital input parameter to conduct the accurate research on battery SOH estimation.
Over the past period, scholars adopted the current SOH of the battery as a constant when studying battery SOC estimation, i.e., using SOH to estimate SOC backward to increase the accuracy of SOC estimation (Talha et al., 2019; Bonfitto, 2020; Gismero et al., 2020). In contrast, some scholars first obtained SOC Estimate the results, and subsequent used the SOC as a constant to estimate the SOH. Since the variation of battery health status is a slow process, how to reasonably develop the relationship between SOC and SOH has become the focus of attention of scholars over the past few years. Huang et al. (2017) proposed a method to establish a fitting relationship between battery SOH and battery SOC by analyzing battery cycle life test data. Accordingly, the battery SOH can be measured without complicated model update algorithms. However, the relevant correction coefficient of the algorithm is determined by the current batch of batteries. Different batches of batteries require different correction coefficients. Thus, the algorithm has certain limitations. Hu et al. (2020) proposed an estimation framework based on multiple time scales to estimate the SOH of the battery. The SOH of the battery is estimated based on the calculation relationship between the battery SOH and SOC, whereas the algorithm should establish a corresponding equivalent circuit model. It is more dependent of model parameters. Lee et al. (2020) developed a method to estimate SOH based on the charging time that is capable of reaching CV after charging. This method, however, requires a complete battery charging. It is difficult to achieve complete charging in actual operation, so the application of this method has certain limitations. Therefore, the current problems are summarized as follows: the establishment of the fitting relationship between SOC and SOH has the difficulty in obtaining the corresponding correction coefficient; the SOH estimation model established by the equivalent circuit model is subject to high model parameter dependence; the method of using the state of charge data for SOH estimation cannot realize SOH online estimation. The above-mentioned problems have certain restrictive conditions, which limit the adaptability of the corresponding algorithm. From this perspective, an algorithm with less restrictive conditions and a wider application range should still be found to realize SOC to estimate SOH.
To address the mentioned problems, the present study proposes a method of online estimation of SOC-SOH based on PSO-SVM. By analyzing the public battery health status provided by NASA, a certain connection is identified between the health status of the battery and the state of charge of the battery. To be specific, as the battery continues to age, the slope of the battery SOC and time tends to increase, and the slope of the battery’s discharge voltage and time tends to be larger. For this reason, this study takes the battery’s SOC change rate and discharge voltage change rate as the characteristic quantities of SOH, and optimizes the support vector machine by using the particle swarm algorithm to effectively estimate the battery health status. Lastly, through algorithm verification, which demonstrates that the algorithm exhibits good adaptability and feasibility and can be applied in actual production and life.
Methods
Support Vector Machine Principle
Support vector machines are based on statistical theory and used to solve classification and regression problems. Compared with traditional regression methods, support vector machines are more suitable for solving small-sample, nonlinear, and high-dimensional pattern recognition problems. Both the SOC and SOH of the battery have a certain degree of non-linearity. This paper mainly uses the support vector machine of the RBF kernel function to estimate the SOC and SOH of the battery. The SVM model structure for such an estimation is shown in Figure 1.
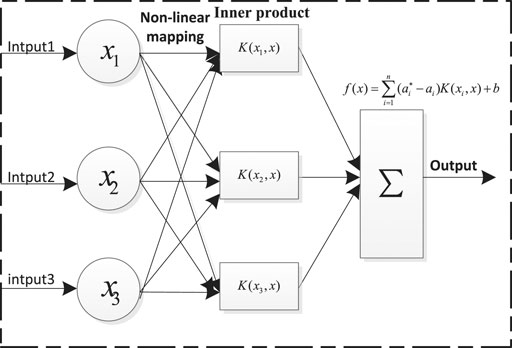
FIGURE 1. Support vector machine model for battery SOC/SOH estimation.
For solving nonlinear problems, the data in low-dimensional space is mapped to high-dimensional space, so as to realize the transformation of nonlinear problems into linear problems. For lithium-ion batteries, the input can be voltage, current, temperature, etc., and the output quantity is SOC/SOH. The corresponding fitting relationship is shown in Eq. (1)
The goal of SVM is to find the best coefficients of w and b in the following constrained conditions. After introducing slack variables, a series of derivations, the standard form of SVM can be obtained, as shown in Eq. 2, and the constraints are shown in Eq. 3.
Restrictions:
By introducing the Lagrangian operator to simplify the difficulty of solving the problem, Eq. 4 can be obtained:
Since the radial basis kernel function has the advantages of simple processing, good analysis, good radial symmetry, and good smoothness, the radial basis function
Among them, in Eq. 5
SVM relies heavily on the parameters
PSO optimization algorithm principle
The PSO algorithm is also called the bird swarm foraging algorithm. It starts from a random solution and finds the optimal solution through iteration. The algorithm is easy to implement, fast in convergence, and has few parameter settings. It is an efficient search algorithm. Assuming that there is only one piece of food in the search food area, all the birds do not know where the food is. The closer the bird is to the food, the higher the fitness value. Searching the area around the bird closest to the food is the best way to find food. Therefore, it is a simple and effective method to achieve the fastest search through group collaboration.
The PSO algorithm compares the optimal solution of each optimization problem to a bird searching for food, which is called a “particle.” Each particle updates itself through two extreme values. One is the optimal solution found by the particle itself, called the Individual extremum
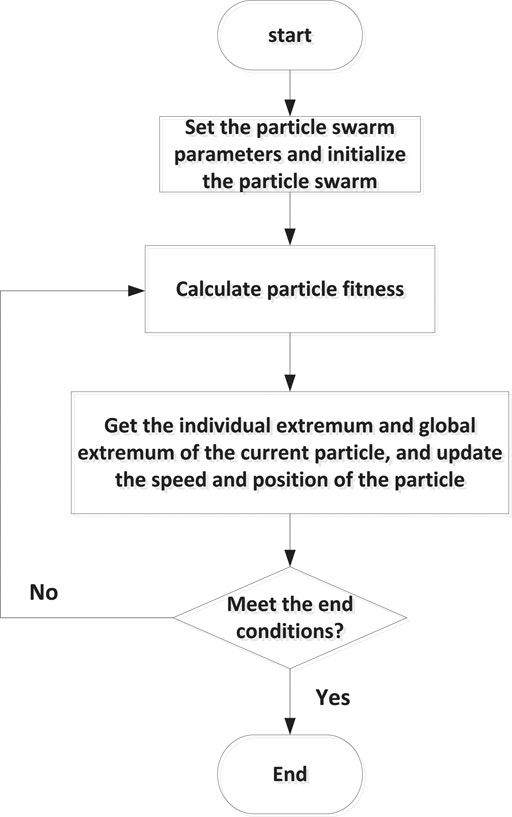
FIGURE 2. Particle swarm optimization algorithm.
Suppose that in a D-dimensional target search space, N particles form a group. Then the position of the particle is Eq. 6, the speed is Eq. 7, the currently searched optimal position is Eq. 8, and the optimal position searched by the entire group is Eq. 9
Particles mainly update their own speed and position through two optimal extreme values, and the update expression is shown in Eqs. 10, 11
Particle velocity update expression:
Particle position update expression:
Where
Principle of PSO-SVM
Particle swarm optimization is used to optimize the penalty parameter
Step 1: Data normalization processing
Step 2: Initialize the particle swarm, set the swarm size, particle position and velocity
Step 3: Train support vector machine model and use the MSE mean squared error function as the fitness function to calculate the fitness value of the particles
Step 4: Get the individual optimal value of the particle and Obtain the global optimal value of the group.
Step 5: Update particle speed and particle position
Step 6: Determine whether the end condition is met, and if so, output the corresponding result.
The Advantage of PSO-SVM
The SVM uses the grid search method to find the best penalty parameters and kernel parameters. The grid search sets the possible solutions in advance before the optimization. After the optimization starts, it is calculated in turn similar to the grid. The corresponding values are calculated and compared continuously to obtain the optimal solution. SVM under particle swarm optimization uses a random search method to find the best penalty parameters and kernel parameters. It initializes the population randomly and iterates continuously to find the optimal solution. Although the grid search can find the current global optimal solution in the sense of cross-validation, when the search range is expanded, the search time will be very long. In contrast, the PSO algorithm doesn’t need to traverse the all points in the grid but can quickly find the global optimal solution through regular iteration. Therefore, the PSO algorithm is used to optimize the support vector machine. The algorithm can converge to the global optimal solution with a greater probability. Compared with the traditional grid search method, the algorithm has a higher calculation speed and better global search ability.
Experimental Data Acquisition
This paper mainly uses two types of batteries to carry out the corresponding research. The positive electrode material of one battery is LiFeO4, and that of the other battery is LiNi0.8Co0.15Al0.05O2. The data set of the former was obtained in the laboratory and named battery #1. The experimental platform is shown in Figure 3. The latter data set is a public battery data set provided by the Center for Excellence in Diagnostics of NASA Ames Research Center in Washington, DC, United States. The batteries numbered B0005, B0018, and B0007 are used for research and named battery #2, battery #3, and battery #4, respectively. The working conditions of the two batteries are different. The former is used for DST, while the latter is used for charging, discharging, and the measurement of the internal resistance. Table 1 shows the relevant information about these batteries. This paper mainly studies their discharge status. The usage of the two battery types is described as follows: battery #1 is only used to verify the adaptability and feasibility of the PSO-SVM algorithm in estimating battery SOC; batteries #2, #3 and #4 are mainly to verify the adaptability and feasibility of the PSO-SVM algorithm in estimating battery SOH.
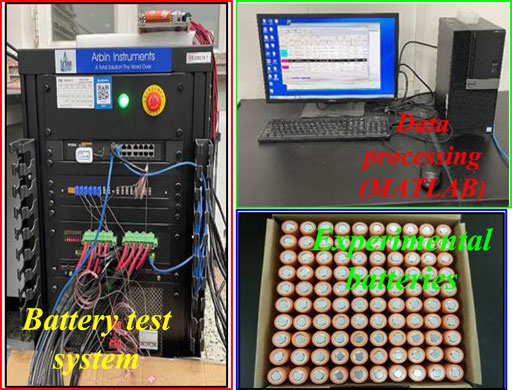
FIGURE 3. Experimental platform.
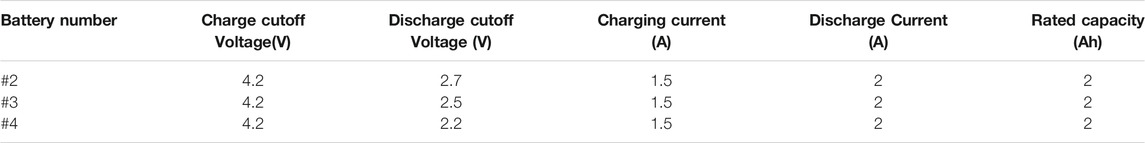
TABLE 1. Experimental conditions of batteries #2 and #3.
Model Building
Parameter Settings
The PSO-SVM-based online estimation method of lithium-ion battery health status proposed in this paper. The parameters of the method are set as follows: the particle swarm size is set to 20, the learning factor
SOH Prediction Framework
The SOH of the battery reflects the reliability of the current battery. Accurately predicting the battery SOH can enable the battery management system to well manage each battery cell in the battery pack, replace seriously aging batteries in time, and ensure the safe operation of electric vehicles. There are many ways to define battery SOH. The most common one is capacity as a characteristic quantity. The following expression is the definition of battery SOH, and Eq. 12 is the definition of capacity characteristic quantity.
Where
The SOH of the battery is estimated to be a complicated and slow process. Battery SOC reflects the discharge of the battery, and it is closely related to battery SOH. SVM estimates the SOC and SOH of the battery mainly through nonlinear mapping, as shown in Figure 1. The input can be the voltage, current, and temperature of the battery, and the output is the SOC or SOH. The specific implementation process of PSO to optimize SVM is as follows. First, the collected data such as voltage, current, and temperature are normalized to eliminate the problems caused by dimensions. Second, the particle swarm algorithm is initialized according to Parameter settings by setting various parameters of the particle swarm. After the parameter setting is completed, the normalized data is input into the SVM estimator. Then, the mean square error (MSE) is used as the fitness function value to calculate the individual extreme value and the group extreme value, and continuously update the velocity and position of particles. When the maximum number of iteration is reached or the error meets the needs, the algorithm ends. If the output requirements are not met, it is necessary to recalculate and repeat the above steps until the requirements are met. The optimal penalty parameters and kernel parameters are output. The PSO-SVM algorithm’s flow chart is shown in the light blue area in Figure 4. Therefore, after the estimation of battery SOC, it is saved in the memory. Then, historical voltage, current, temperature, SOC and other data are collected through the BMS system, and saved in the memory. Thus, in the normal use of the electric vehicle, a training model is built online and the collected online data is input into this model to realize the online prediction of battery SOH. The block diagram regarding the online prediction of battery SOH is shown in Figure 4.
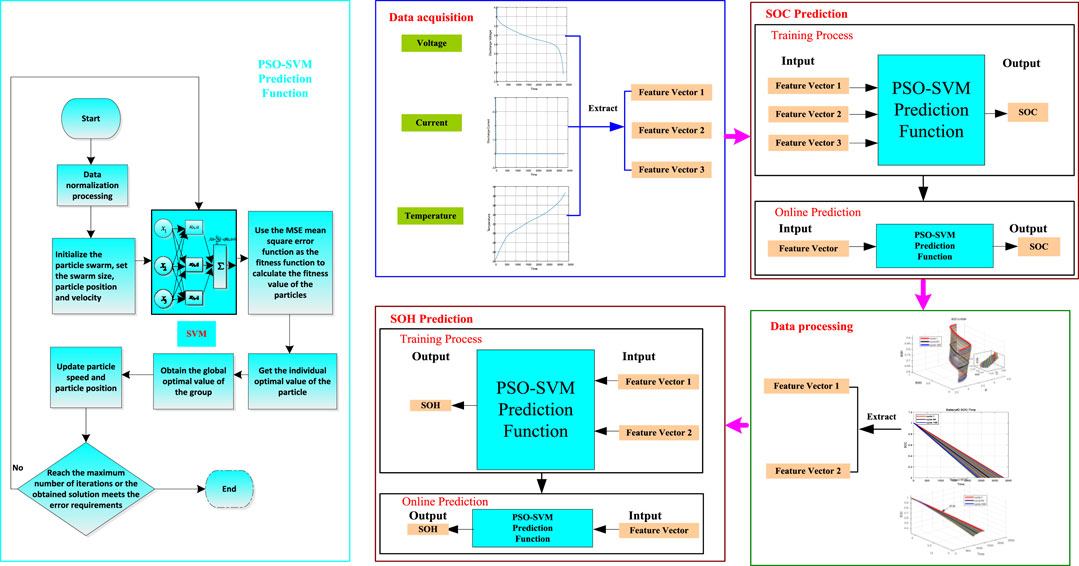
FIGURE 4. Battery SOH online prediction process based on PSO-SVM.
SOH Feature Extraction
The estimation accuracy of the data-driven model mainly depends on two aspects: 1) whether the training data covers all battery environments, and 2) whether the type of training data has a greater correlation with the accuracy of the SOC. Therefore, the extraction of reasonable SOH feature quantities can improve the accuracy of data-driven prediction of SOH.
As we all know, the parameters of the battery will change with the increasing number of cycles. Figure 5 is the discharge voltage curve of battery #2. With the increase of cycle numbers, the derivative of the battery voltage with respect to time becomes larger. It can be found from the figure that the slope of the battery’s discharge voltage curve gradually changes from flat to steep, indicating that this voltage can be used as one of the characteristic quantities to measure battery aging.
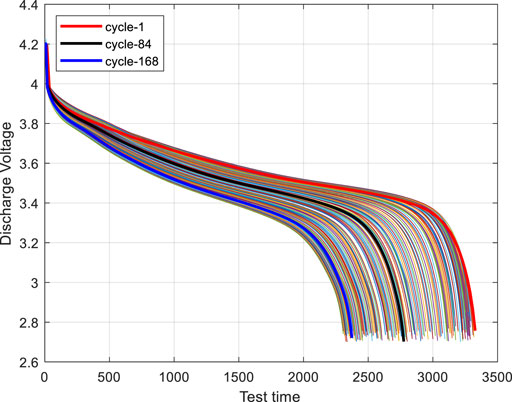
FIGURE 5. The discharge voltage curve of battery #2.
Figure 6 is the discharge current diagram of battery #2, which shows that the battery is discharged at a constant current of 1C. Moreover, as the degree of battery aging increases, the discharge time of the battery decreases. The battery is discharged for the first time, as shown by the red line, for about 3,400 s; in the 84th discharge, it takes about 2,800 s; in the 168th discharge, it takes about 2,400 s. It can be seen that as the battery ages, the battery discharging time will gradually decrease, that is, the discharge time of the battery can be regarded as an important characteristic quantity to measure battery aging.
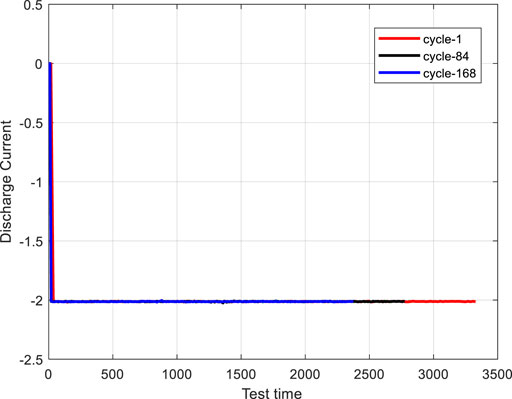
FIGURE 6. Discharge current diagram of battery #2.
Figure 7 is the discharge temperature diagram of battery #2. It can be seen from Figure 7 that as the number of cycles increases, the temperature of the battery gradually increases, indicating that the internal impedance of the battery is gradually increasing. Therefore, it can also be used as a battery characteristic. The quantity of aging is limited by the fact that it is not convenient to measure the internal resistance of the battery under the actual working conditions of the battery. Therefore, we can judge the aging degree of the battery by analysing the internal temperature of the battery.
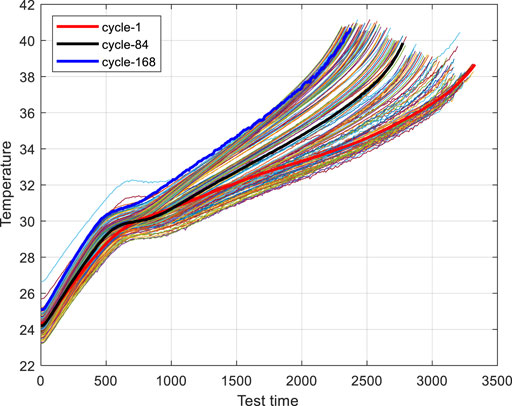
FIGURE 7. Discharge temperature diagram of battery #2.
Figure 8 shows the relationship between SOH-SOC-U of battery #2. The Z-axis represents the health of the battery, the X-axis represents the battery’s discharge voltage, and the Y-axis represents battery SOC. It can be found from Figure 8 that as the battery ages, the decay rate of battery SOC increases from 1 to 0. Figure 9 is a graph of the relationship between battery #2’s SOC and time, which can clearly show the relationship between battery SOC and battery health. The SOC of the battery can also be regarded as an important characteristic quantity to measure battery aging.
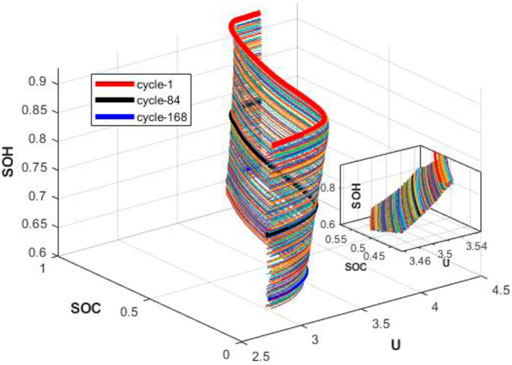
FIGURE 8. SOH-SOC-U relationship diagram of battery #2.
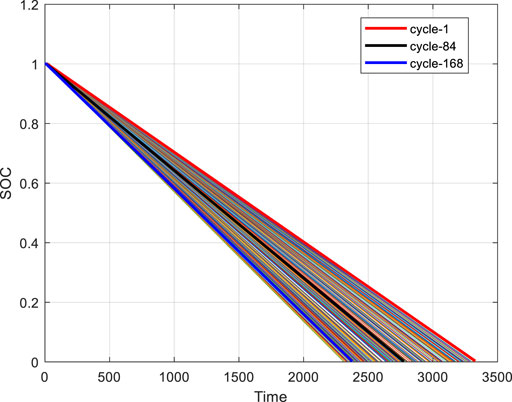
FIGURE 9. SOC-Time relationship diagram of battery #2.
It can be seen from the above findings that the characteristic quantities of battery aging can be the discharge voltage, SOC, and discharge time of the battery. Therefore, the health of the battery can be determined by the analysis of these three quantities. However, due to the large amount of battery SOC data, directly inputting the battery SOC, discharge voltage, and discharge time into the SOH estimator tends to increase calculation complexity. Therefore, this paper does not directly add SOC to the SOH estimator, but adopts the method of indirectly adding SOC to estimate the health of the battery. This algorithm can effectively reduce training data, speed up calculations, and improve prediction efficiency. The relationship between battery SOC, voltage, and discharge time is shown in Figure 10. The SOC value presented by the Z-axis corresponds to a two-dimensional coordinate (Time, U), and the same SOC value corresponds to a two-dimensional coordinate (Time, U). The value is also different. With this feature, battery SOH can be predicted by the support vector machine based on the particle swarm algorithm, and the prediction expression is in Eq. 13.
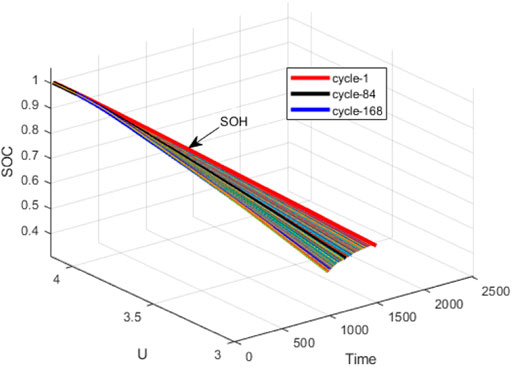
FIGURE 10. SOC-U-Time relationship diagram of battery #2.
SOC-SOH Online Joint Estimation
SOC Prediction
Online Estimation of Li-Ion Battery SOC
The first two discharge data of battery #2 are used for SOC prediction. The first discharge data is used for training and the second discharge data is used for testing. The prediction effect is shown in Figure 11. The mean relative error of SOC of battery #2 is shown in Figure 12. From Figure 12, it can be found that the accuracy of the PSO-SVM algorithm is higher than that of the SVM algorithm, and the PSO-SVM algorithm is more stable.
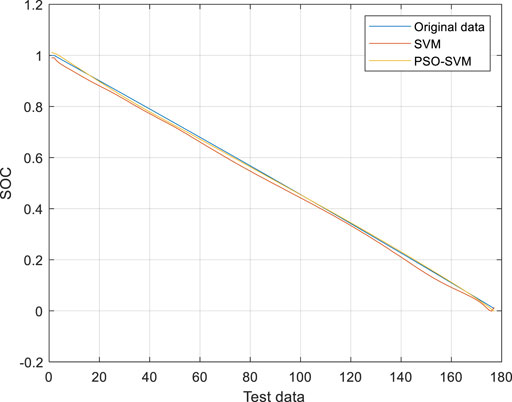
FIGURE 11. SOC prediction of battery #2.
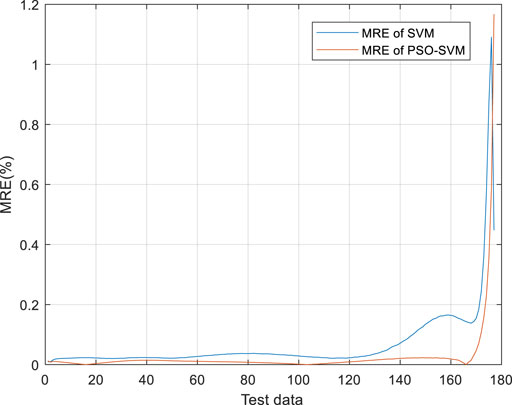
FIGURE 12. The mean relative error of SOC of battery #2.
Here, three criteria, including the mean relative error (MRE), the mean absolute error (MAE) and the mean squared error (MSE) are introduced to evaluate the prediction performance as shown in Table 2.

TABLE 2. Comparison of two method for battery #2.
As shown in Table 2, It can be evidently discovered that the PSO-SVM method obtain much better prediction performance than the SVM method. For example, the prediction MRE (%) on battery #2 based on the SVM was 6.6742, while the prediction MRE based on the PSO-SVM was only 2.5543. This means that the prediction precision with the PSO-SVM improved greatly compared to the SVM.
DST Working Condition Verification
The DST working condition is used to verify the accuracy of the algorithm. The voltage and current under DST working conditions are shown in Figures 13, 14. The DST working condition is a dynamic stress test working condition, which can well reflect the current and voltage changes of the electric vehicle in the actual operating state, and help with judging whether the estimation method can be applied in practice. The DST working condition verification is shown in Figure 15, and the mean relative error of SOC operating conditions under DST operating conditions is shown in Figure 16. The SOC estimation error under DST conditions is shown in Table 3.
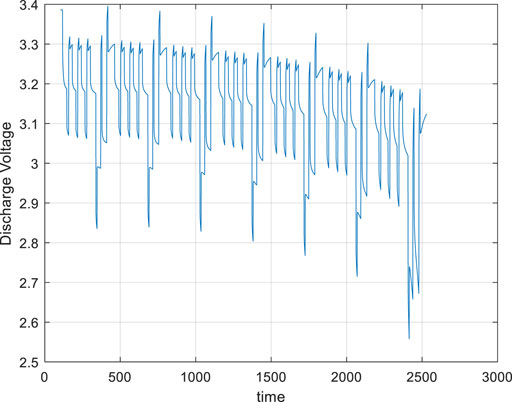
FIGURE 13. Voltage under DST operating conditions.
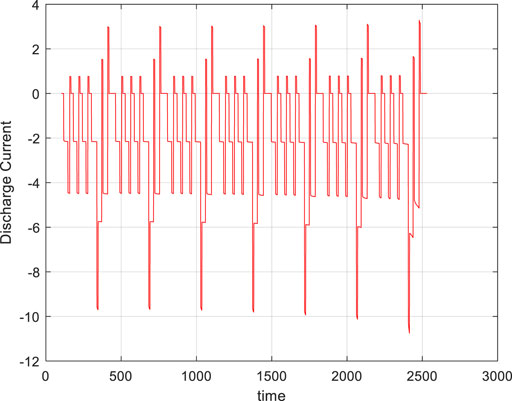
FIGURE 14. Current under DST conditions.
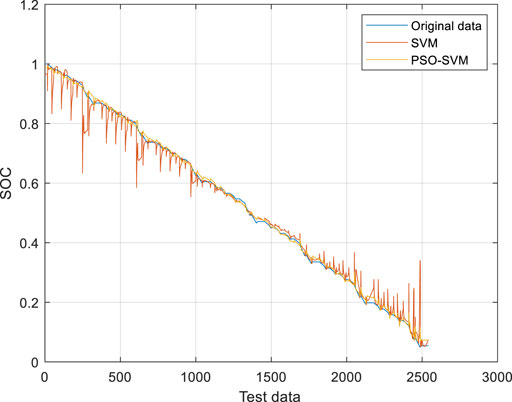
FIGURE 15. DST working condition verification.
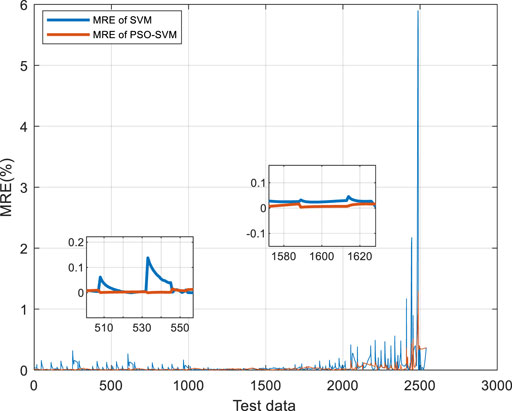
FIGURE 16. The MRE of SOC estimation under DST operating conditions.

TABLE 3. Comparison of two method for battery #1.
It can be seen from Figure 16 that the SOC estimated by the PSO-SVM algorithm is more accurate and the overall estimation stability is better without large local errors compared to the SVM algorithm. This indicates that the estimation method can be applied to the actual estimation. The SOC estimation error is shown in Table 3.
SOH Prediction
Analysis of Prediction Performance
Battery #2 is used as training data to predict the SOC of battery #3. Figure 17 shows the SOH diagrams of batteries #2 and #3. It can be seen from Figure 17 that the overall downward trends of batteries #2 and #3 are the same, and the aging speed of battery #3 is higher than that of battery #2. When the capacity drops to 70% of the rated capacity, the battery is regarded as a failure. (Qin et al., 2015).
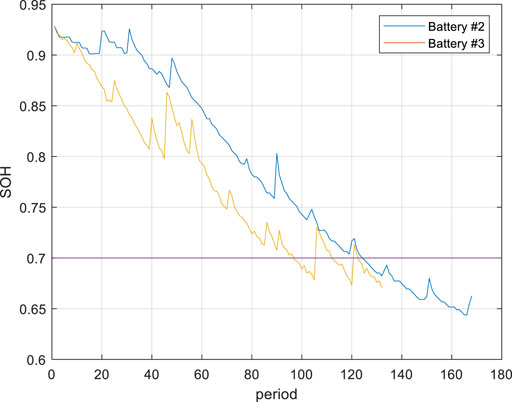
FIGURE 17. Battery SOH diagram.
Battery SOC is estimated in turn and substituted into the established SOC-SOH joint estimation model. Nine SOC interval segments are selected to reflect the estimation effect of the model. The SOH estimation effect is shown in Figure 18. From the figure, it can be found that the PSO-SVM algorithm has a more stable overall estimation effect than the SVM algorithm. The root mean square error (RMSE) is employed to evaluate the model’s performance as shown in Figure 19.
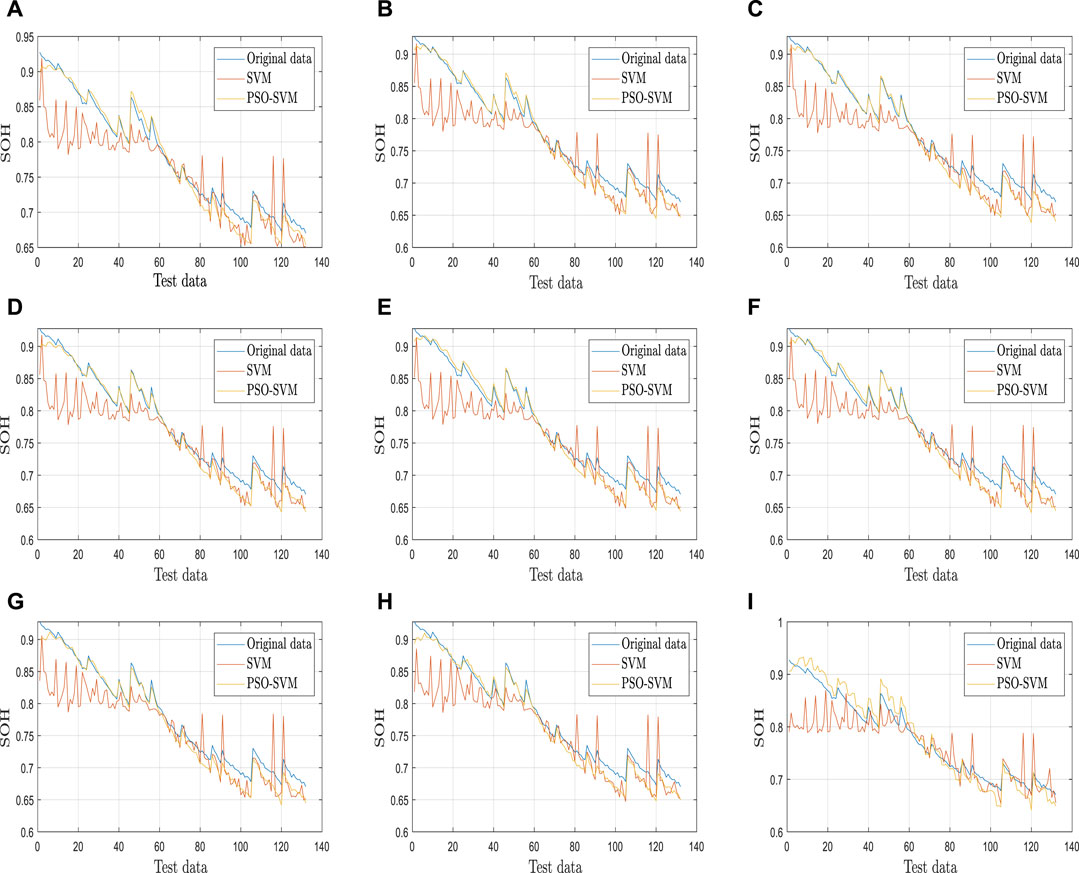
FIGURE 18. Estimation of SOH in different states of charge (A) SOC change (100–10%),(B) SOC change (100–20%), (C) SOC change (100–30%), (D) SOC change (100–40%), (E) SOC change (100–50%), (F) SOC change (100–60%), (G) SOC change (100–70%), (H) SOC change (100–80%), (I) SOC change (100–90%).
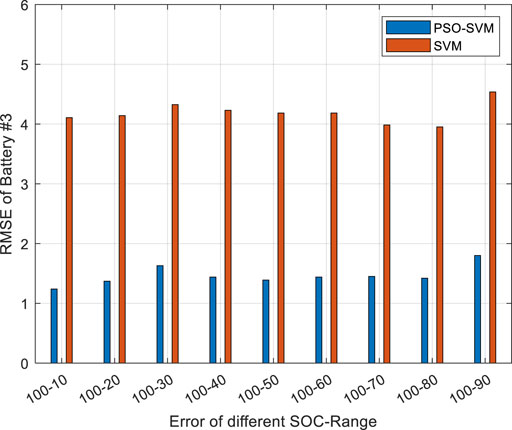
FIGURE 19. RMSE of battery #3.
SOH estimation error is shown in Figure 19. The following conclusions can be obtained:
1) The overall error of SVM is twice that of PSO-SVM. The RMSE of SVM does not exceed 4.5% and the RMSE of PSO-SVM does not exceed 2%, which meets the requirements for the prediction accuracy of battery SOH.
2) With the increase of ΔSOC, the estimation error of SOH shows an overall downward trend; but in the interval of SOC (100–70%)-SOC (100–30%), the estimation error of SOH rebounds instead. This is because of the flat discharge interval, the dense SOH curve, and the slightly worse algorithm discrimination than that of the two sides. Thus, the error in this interval is slightly higher than that of the two ends.
Adaptability Analysis
Considering the background of estimating battery SOH in the practical application of electric vehicles, we need to further verify the adaptability of this method. Based on the above analysis, the applicability of the proposed SOH estimation method in electric vehicle batteries is further analysed. Battery #2 is still used as training data and battery #4 is tested. The error result is shown in Figure 20.
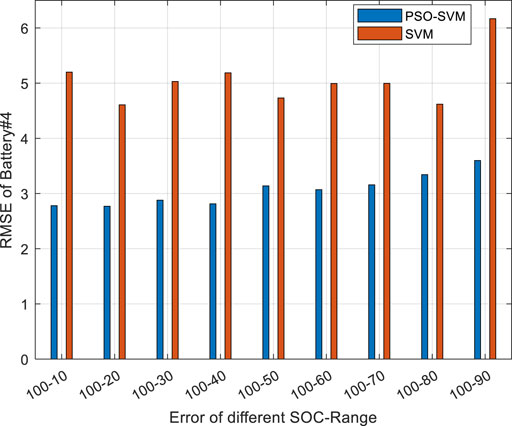
FIGURE 20. RMSE of battery#4.
It can be found from Figure 20 that the predicted results conform to the corresponding conclusions in Analysis of prediction performance. The method proposed in this paper is also applicable to battery #4, which has better estimation accuracy. The results show that the method proposed in this paper has certain adaptability.
Comparison With Other Models
Using battery #2 as the training data set, we test batteries #3 and #4 respectively. Comparing the algorithms proposed in the literature Khumprom and Yodo (2019), Table 4 shows the SOH prediction errors of PSO-SVM and five known published methods.

TABLE 4. Comparison of different SOH prediction models.
As shown in Table 4, the RMSE based on the PSO-SVM model was the smallest compared to the other four models, by comparison, it can be concluded that the PSO-SVM could effectively improve the prediction performance of battery SOH.
Conclusion
To solve the problems of battery SOC and SOH estimation (e.g., long time-consuming, considerable calculation, and unable to estimate online), the present study proposes a method of SOC-SOH joint estimation based on PSO-SVM, and implements the online detection and estimation for the battery management system.
First, the data of NASA battery samples are introduced to complete the modeling of the battery SOC estimation model, and the accuracy and stability of the SOC model are verified by using DST conditions, and the estimation error does not exceed 3%. Second, the SOC estimation complies with this model. The algorithm further explores the battery SOH estimation. The study suggests that with the increase of battery aging, the battery SOC decline rate and the voltage decline rate will increase under the identical working conditions. Therefore, to find the coupling relationship between the two, this study proposes the optimized PSO-SVM algorithm to realize the joint estimation of battery SOC/SOH. Lastly, the effectiveness and adaptability of the algorithm are verified and analyzed, and the errors of the algorithm proposed in this paper are compared with other algorithms. As revealed from the result, the error of the SOH estimation result is not more than 2.5%.
Finally, the advantages of the method proposed in this paper are summarized as follows:
1) The method has fewer restrictions and does not need to obtain the fitting coefficients of the corresponding SOC-SOH function relationship, nor to identify the corresponding equivalent circuit model parameters, etc., thus improving the applicability of the algorithm.
2) This method can realize the online estimation of battery health. Most traditional estimation methods can only realize offline estimation. Also, this method can closely link the battery’s SOC and SOH. When estimating the battery’s health status, it fully considers the SOC information to further improve the effectiveness of estimation.
3) Compared with the traditional support vector machine algorithm, this method can converge to the global optimal solution with a greater probability, and has a higher calculation speed and better global search capability.
4) This method can overcome the “curse of dimensionality” problem. By introducing k-fold cross-validation, it prevents the over-fitting problem and further improves the generalization ability of the model.
It is noteworthy that for the consistency differences between the battery cells in the electric vehicle battery system, the applicability of the algorithm in different battery cells and other issues should be studied in depth.
Data Availability Statement
Publicly available datasets were analyzed in this study. This data can be found here: https://ti.arc.nasa.gov/tech/dash/groups/pcoe/prognostic-data-repository/.
Author Contributions
Writing-original draft preparation, WL; writing-review and editing, RL and WL; funding acquisition, RL; project administration, RL; investigation, HZ and WT; formal analysis, YZ All authors have read and agreed to the published version of the manuscript.
Funding
This research was funded by the National Key Research Program of China, Grant number 2016YFC0300104, the Advanced Research Project of Equipment of China under Grant 41421040301, and the Elite Project of Harbin University of Science and Technology under Grant LGYC2018JC026.
Conflict of Interest
Author WT was employed by the company China Henan Xintaihang Power Source Co., Ltd.
The remaining authors declare that the research was conducted in the absence of any commercial or financial relationships that could be construed as a potential conflict of interest.
Publisher’s Note
All claims expressed in this article are solely those of the authors and do not necessarily represent those of their affiliated organizations, or those of the publisher, the editors and the reviewers. Any product that may be evaluated in this article, or claim that may be made by its manufacturer, is not guaranteed or endorsed by the publisher.
References
Bonfitto, A. (2020). A Method for the Combined Estimation of Battery State of Charge and State of Health Based on Artificial Neural Networks. Energies 13 (10), 2548. doi:10.3390/en13102548
Cannarella, J., and Arnold, C. B. (2014). State of Health and Charge Measurements in Lithium-Ion Batteries Using Mechanical Stress. J. Power Sourc. 269, 7–14. doi:10.1016/j.jpowsour.2014.07.003
Chen, L., Lü, Z., Lin, W., Li, J., and Pan, H. (2018). A New State-Of-Health Estimation Method for Lithium-Ion Batteries through the Intrinsic Relationship between Ohmic Internal Resistance and Capacity. Measurement 116, 586–595. doi:10.1016/j.measurement.2017.11.016
Duan, W., Song, C., Chen, Y., Xiao, F., Peng, S., Shao, Y., et al. (2020). Online Parameter Identification and State of Charge Estimation of Battery Based on Multitimescale Adaptive Double Kalman Filter Algorithm. Math. Probl. Eng. 2020, 1–20. doi:10.1155/2020/9502605
Eddahech, A., Briat, O., Bertrand, N., Delétage, J.-Y., and Vinassa, J.-M. (2012). Behavior and State-Of-Health Monitoring of Li-Ion Batteries Using Impedance Spectroscopy and Recurrent Neural Networks. Int. J. Electr. Power Energ. Syst. 42 (1), 487–494. doi:10.1016/j.ijepes.2012.04.050
Gholizadeh, M., and Yazdizadeh, A. (2020). Systematic Mixed Adaptive Observer and EKF Approach to Estimate SOC and SOH of Lithium-Ion Battery. Iet Electr. Syst. Transportation 10 (2), 135–143. doi:10.1049/iet-est.2019.0033
Gismero, A., Schaltz, E., and Stroe, D.-I. (2020). Recursive State of Charge and State of Health Estimation Method for Lithium-Ion Batteries Based on Coulomb Counting and Open Circuit Voltage. Energies 13 (7), 1811. doi:10.3390/en13071811
Hu, X., Jiang, H., Feng, F., and Liu, B. (2020). An Enhanced Multi-State Estimation Hierarchy for Advanced Lithium-Ion Battery Management. Appl. Energ. 257, 114019. doi:10.1016/j.apenergy.2019.114019
Huang, S.-C., Tseng, K.-H., Liang, J.-W., Chang, C.-L., and Pecht, M. (2017). An Online SOC and SOH Estimation Model for Lithium-Ion Batteries. Energies 10 (4), 512. doi:10.3390/en10040512
Hung, M.-H., Lin, C.-H., Lee, L.-C., and Wang, C.-M. (2014). State-of-charge and State-Of-Health Estimation for Lithium-Ion Batteries Based on Dynamic Impedance Technique. J. Power Sourc. 268, 861–873. doi:10.1016/j.jpowsour.2014.06.083
Ji, H., Zhang, W., Pan, X. H., Hua, M., Chung, Y. H., Shu, C. M., et al. (2020). State of Health Prediction Model Based on Internal Resistance. Int. J. Energ. Res 44 (8), 6502–6510. doi:10.1002/er.5383
Khaleghi, S., Firouz, Y., Van Mierlo, J., and Van den Bossche, P. (2019). Developing a Real-Time Data-Driven Battery Health Diagnosis Method, Using Time and Frequency Domain Condition Indicators. Appl. Energ. 255, 113813. doi:10.1016/j.apenergy.2019.113813
Khumprom, P., and Yodo, N. (2019). A Data-Driven Predictive Prognostic Model for Lithium-Ion Batteries Based on a Deep Learning Algorithm. Energies 12 (4), 660. doi:10.3390/en12040660
Klass, V., Behm, M., and Lindbergh, G. (2014). A Support Vector Machine-Based State-Of-Health Estimation Method for Lithium-Ion Batteries under Electric Vehicle Operation. J. Power Sourc. 270, 262–272. doi:10.1016/j.jpowsour.2014.07.116
Lai, X., Wang, S., Ma, S., Xie, J., and Zheng, Y. (2020). Parameter Sensitivity Analysis and Simplification of Equivalent Circuit Model for the State of Charge of Lithium-Ion Batteries. Electrochimica Acta 330, 135239. doi:10.1016/j.electacta.2019.135239
Lee, J., Kim, J.-M., Ryu, K., and Won, C.-Y. (2020). An Energy Storage System's Operational Management and Control Method Considering a Battery System. Electronics 9 (2), 356. doi:10.3390/electronics9020356
Li, R., Xu, S., Li, S., Zhou, Y., Zhou, K., Liu, X., et al. (2020). State of Charge Prediction Algorithm of Lithium-Ion Battery Based on Pso-Svr Cross Validation. Ieee Access 8, 10234–10242. doi:10.1109/ACCESS.2020.2964852
Li, Y., Liu, K., Foley, A. M., Zülke, A., Berecibar, M., Nanini-Maury, E., et al. (2019). Data-driven Health Estimation and Lifetime Prediction of Lithium-Ion Batteries: A Review. Renew. Sustain. Energ. Rev. 113, 109254. doi:10.1016/j.rser.2019.109254
Meng, J., Cai, L., Luo, G., Stroe, D.-I., and Teodorescu, R. (2018). Lithium-ion Battery State of Health Estimation with Short-Term Current Pulse Test and Support Vector Machine. Microelectronics Reliability 88-90, 1216–1220. doi:10.1016/j.microrel.2018.07.025
Qin, T., Zeng, S., and Guo, J. (2015). Robust Prognostics for State of Health Estimation of Lithium-Ion Batteries Based on an Improved PSO-SVR Model. Microelectronics Reliability 55 (9-10), 1280–1284. doi:10.1016/j.microrel.2015.06.133
Talha, M., Asghar, F., and Kim, S. H. (2019). A Neural Network-Based Robust Online SOC and SOH Estimation for Sealed Lead-Acid Batteries in Renewable Systems. Arab J. Sci. Eng. 44 (3), 1869–1881. doi:10.1007/s13369-018-3200-8
Tang, X., Zou, C., Yao, K., Chen, G., Liu, B., He, Z., et al. (2018). A Fast Estimation Algorithm for Lithium-Ion Battery State of Health. J. Power Sourc. 396, 453–458. doi:10.1016/j.jpowsour.2018.06.036
Wang, Z., Zeng, S., Guo, J., and Qin, T. (2019). State of Health Estimation of Lithium-Ion Batteries Based on the Constant Voltage Charging Curve. Energy 167, 661–669. doi:10.1016/j.energy.2018.11.008
Weng, C., Feng, X., Sun, J., and Peng, H. (2016). State-of-health Monitoring of Lithium-Ion Battery Modules and Packs via Incremental Capacity Peak Tracking. Appl. Energ. 180, 360–368. doi:10.1016/j.apenergy.2016.07.126
Wognsen, E. R., Haverkort, B. R., Jongerden, M., Hansen, R. R., and Larsen, K. G. (2015). A Score Function for Optimizing the Cycle-Life of Battery-Powered Embedded SystemsA Sco-Re Function for Optimizing the Cycle-Life of Battery-Powered Embedded Systems. International Conference on Formal Modeling and Analysis of Timed Systems, September 2–4, 2015. Cham: Springer, 305–320. doi:10.1007/978-3-319-22975-1_20
Xiao, D., Fang, G., Liu, S., Yuan, S., Ahmed, R., Habibi, S., et al. (2020). Reduced-Coupling Coestimation of SOC and SOH for Lithium-Ion Batteries Based on Convex Optimization. IEEE Trans. Power Electron. 35 (11), 12332–12346. doi:10.1109/TPEL.2020.2984248
Yang, D., Zhang, X., Pan, R., Wang, Y., and Chen, Z. (2018). A Novel Gaussian Process Regression Model for State-Of-Health Estimation of Lithium-Ion Battery Using Charging Curve. J. Power Sourc. 384, 387–395. doi:10.1016/j.jpowsour.2018.03.015
You, G.-w., Park, S., and Oh, D. (2016). Real-time State-Of-Health Estimation for Electric Vehicle Batteries: A Data-Driven Approach. Appl. Energ. 176, 92–103. doi:10.1016/j.apenergy.2016.05.051
Keywords: lithium battery, SOC, SOH, SVM, BMS
Citation: Li R, Li W, Zhang H, Zhou Y and Tian W (2021) On-Line Estimation Method of Lithium-Ion Battery Health Status Based on PSO-SVM. Front. Energy Res. 9:693249. doi: 10.3389/fenrg.2021.693249
Received: 10 April 2021; Accepted: 15 July 2021;
Published: 27 July 2021.
Edited by:
Xiaohong Li, University of Exeter, United KingdomReviewed by:
Mona Faraji Niri, University of Warwick, United KingdomA. K. Arof, University of Malaya, Malaysia
Copyright © 2021 Li, Li, Zhang, Zhou and Tian. This is an open-access article distributed under the terms of the Creative Commons Attribution License (CC BY). The use, distribution or reproduction in other forums is permitted, provided the original author(s) and the copyright owner(s) are credited and that the original publication in this journal is cited, in accordance with accepted academic practice. No use, distribution or reproduction is permitted which does not comply with these terms.
*Correspondence: Wenrui Li, dapangjing@163.com