 Meng Yu
 Libo Qian
 Wenzhong Zhou
94% of researchers rate our articles as excellent or good
Learn more about the work of our research integrity team to safeguard the quality of each article we publish.
Find out more
ORIGINAL RESEARCH article
Front. Energy Res. , 10 June 2021
Sec. Nuclear Energy
Volume 9 - 2021 | https://doi.org/10.3389/fenrg.2021.691813
This article is part of the Research Topic Reactor Fuels, Materials and Systems under Extreme Environments View all 29 articles
This article simulates the multiphysics coolant thermohydraulic conditions and fuel performance of a pressurized water reactor (PWR) during a loss-of-coolant accident (LOCA). In the coolant channel of a PWR, the coolant undergoes a series of different boiling regimes along the axial direction. At the inlet of the coolant channel, heat exchange between the cladding wall and coolant is based on single-phase forced convection. As the coolant flow distance increases, the boiling regime gradually converts to nucleate boiling. When a LOCA occurs, on the one hand, the coolant flux and coolant pressure decrease sharply; on the other hand, the heat flux at the cladding wall decreases relatively slowly. They both contribute to a swift increase in coolant temperature. As a consequence, a boiling crisis may occur as critical heat flux (CHF) decreases. In this article, the void fraction along the length of coolant channel in a reactor and mechanical performance of Zr cladding enwrapping UO2 fuel are investigated by establishing a fully coupled multiphysics model based on the CAMPUS code. Physical models of coolant boiling regimes are implemented into the CAMPUS code by adopting different heat transfer models and void fraction models. Physical properties of the coolant are implemented into the CAMPUS code using curve-fitting results. All physical models and parameters related to solid heat transfer are implemented into the CAMPUS code with a 2D axisymmetric geometry. The modeling results help enhance our understanding of void fraction along the length of the coolant channel and mechanical performance of Zr cladding enwrapping UO2 fuel under different coolant pressure and mass flux conditions during a LOCA.
Developing a computational code fully coupling multi-physical fields in the pressurized water reactor (PWR) is of great interest. It is essential to the simulation of fuel performance under a LOCA, which makes a significant difference to both the safety and economic effect of a reactor. In the past, several codes have been developed to simulate separately normal operation fuel behaviors (e.g., FRAPCON, ENIGMA, COMETHE, and FEMAXI) and accident operation behaviors in a reactor (e.g., FRAPTRAN, TRANSURANUS, SCANAIR, TESPA-ROD, and SFPR). In recent years, some of these codes in both categories tend to develop toward a unified code that could simulate both normal operation and accident conditions (Van Uffelen et al., 2019). However, most of these codes require the implementation of specific models and have an increased complexity level, which requires reduction (Van Uffelen et al., 2008; Van Uffelen et al., 2019; Pastore et al., 2021). Therefore, a simplified thermo-fluid–coupled code involving key fuel performance phenomena and continuous flow and phase change of coolant is highly desired. This is beneficial for the more realistic simulation under a LOCA.
A LOCA results from the break on the pipes of the loop in a reactor. Once a LOCA happens, the core scrams, and a drop of pressure and flux in the circulation loop occurs without appropriate coolant supplements. In the condition of depressurization, the flow of the coolant might suffer from a transition from single-phase forced convection to boiling regime and even encounter critical heat flux (CHF). The appearance of CHF results in the increase of temperature at the outer surface of cladding, which leads to fuel cracking, pellet–cladding interaction, and the release of fission product gases (Belle, 1961; Holden, 1966; Frost, 1982; Bailly et al., 1999; Liu et al., 2016a).
We investigated the void fraction of the coolant and the mechanical properties of fuel cladding before the flow boiling reaches CHF in this article, fully coupling key fuel performance phenomena, and cladding-coolant heat transfer. A set of heat transfer correlations were adopted to describe the heat transfer condition prior to CHF. In the regime of single-phase forced convection, the most widely used correlation is the Dittus–Belter correlation (Dittus and Belter, 1985); it is applicable when the coolant is still in the liquid phase. In the regime of subcooled boiling, many studies were also carried out to predict the heat transfer coefficient for different geometries, flow, and heating conditions; among which, the most widely used are those proposed by Bergles and Rohsenow (Bergles and Rohsenow, 1964), Jens and Lottes (Jens and Lottes, 1951), Thom et al. (Thom et al., 1965), and Shah (Shah, 1977; Shah, 2017). In the saturated boiling region, Schrock–Grossman correlation (Schrock and Grossman, 1962) and Chen’s correlation (Chen, 1966) have been applied in a large range in the engineering calculation. In terms of void fraction, Levy (Chen, 1967), Kroeger and Zuber (Kroeger and Zuber, 1968), Saha and Zuber (Saha and Zuber, 1974), and Lahey and Moody (Lahey and Moody, 1977) proposed different models to estimate the void fraction in subcooled boiling regime based on the Zuber and Findlay (Zuber and Findlay, 1965) drift flux model. Later, Manon (Manon, 2000) modified Lahey and Moody’s model (Lahey and Moody, 1977) by combining the Griffith et al. (1958) model.
In this work, the model was established based on the CityU Advanced Multiphysics Nuclear Fuels Performance with User-defined Simulation (CAMPUS) code. The CAMPUS code is based on the framework of COMSOL Multiphysics, which is, in general, a finite element analysis solver and simulation software. Previous results (Liu et al., 2016a) calculated by the CAMPUS code using the constant heat transfer coefficient has been proven reliable by comparing with the results calculated using BISON, ABAQUS, and FRAPCON. The modeling results of a previous work were adopted and combined with different heat transfer models and void fraction models to predict the void fraction along the length of the coolant channel in a reactor and mechanical performance of Zr cladding enwrapping UO2 fuel under normal operating conditions and conditions with a drop of pressure and coolant mass flux. Our understanding is toward void fraction along the length of coolant channel and mechanical performance of Zr cladding enwrapping UO2 fuel cladding under different coolant pressures and mass fluxes through fully coupled modeling including a LOCA. This is useful for the prediction of CHF and the safety of cladding material.
The model used in this work is established based on a 2D axisymmetric geometry. The whole fuel rod is represented with a single pellet by applying periodic boundary conditions, as is shown in Figure 1 (Liu et al., 2016a; Liu et al., 2016b; Liu and Zhou, 2017; Liu et al., 2018). The previous study focused on the fuel performance of thermal conductivity–enhanced material in light water reactor has been done in Ref. (Liu et al., 2016a; Liu et al., 2016b; Liu and Zhou, 2017; Liu et al., 2018). They used a self-defined multiple physics model based on COMSOL to simulate the fuel performance of UO2-BeO and UO2-SiC. Almost all physical phenomena related to actual fuel rods were taken into consideration, which included heat generation and conduction, mechanical properties, fission gas release, cladding irradiation creep, and oxidation. However, the coolant properties in the previous work are not sophisticated enough. As a result, in this work, we tried to build a thermal-fluid–coupled multiphysics model to estimate the fuel performance by adding to the previous model, more complex fluid properties, and heat conduction on boundaries. The assemblage geometry was assumed to be rectangular, as shown in Figure 2. Therefore, the hydraulic diameter was calculated by the equation:
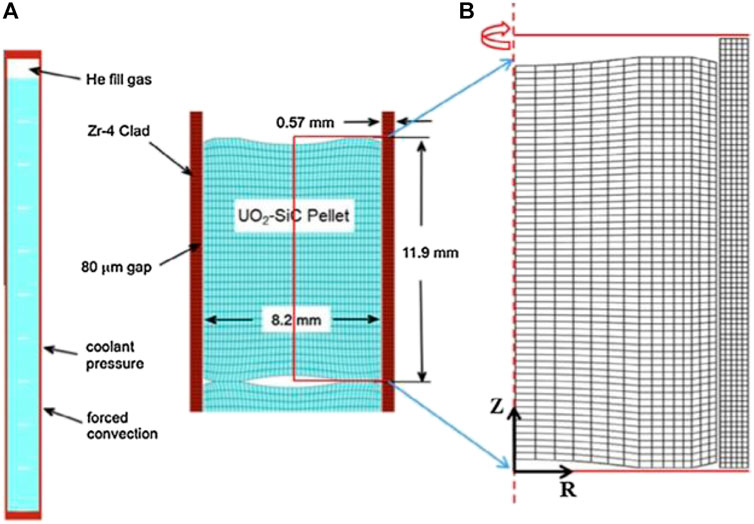
FIGURE 1. (A) Geometry, material, and typical mesh used in COMSOL, and (B) 2D-axisymmetric geometry and mesh for a single pellet used in a previous work.
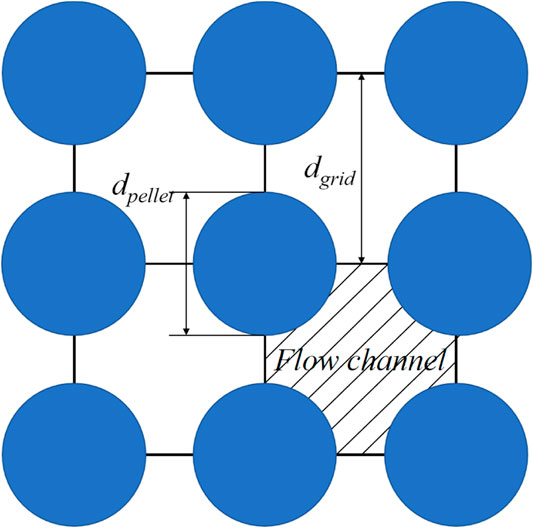
FIGURE 2. Geometry of assemblage.
In our model, a linear average power of 200 W/cm was assumed to be reached within 1,000 s, and lasted over 3 years. Figure 3 shows the evolution of wall temperature under 15.5 MPa. Obviously, the wall temperature increases sharply after 107 s because of the rapid increase of zirconium oxide layer thickness. This leads to a rapid diminution of the coolant heat transfer coefficient. However, the increase of zirconium oxide layer thickness is mild enough between 104 and 107 s. As a result, we could consider that the evolution of wall temperature during this time is stationary so that different sections of the pellet on the fuel rod could be represented by changing the inlet coolant temperature on a single pellet. Some of the calculated results were therefore averaged between 104 and 107 s. Besides, the position of the pellet on the fuel rod was associated with coolant temperature by an energy balance equation followed assuming that
where the inlet temperature was taken as
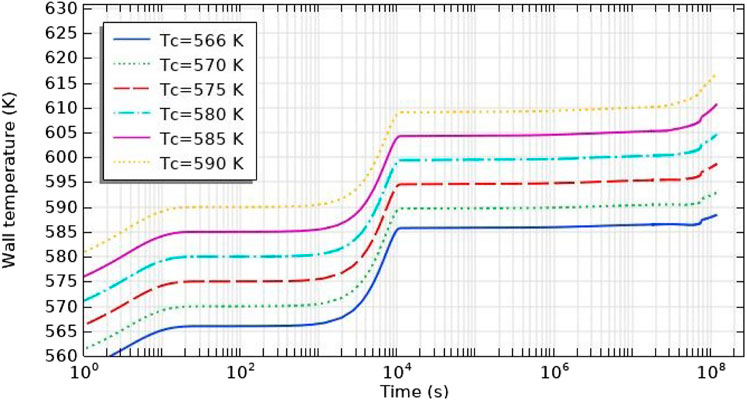
FIGURE 3. Evolution of wall temperature under 15.5 MPa with different coolant temperatures and G = 16500 kg/s.
A coolant in this work is assumed as water. Several physical properties of water were needed for the modeling of heat transfer between fuel cladding and coolant. Properties of both liquid and vapor of water as a function of temperature and pressure were implemented in the model using the curve fitting method.
The density of the liquid phase was assumed to be in the form of
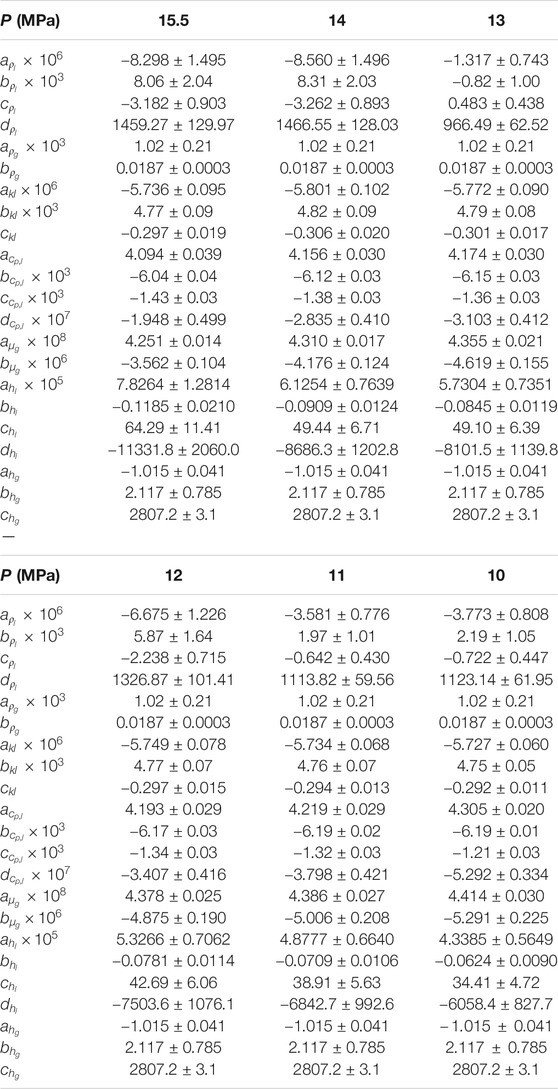
TABLE 1. Values of coefficients for the calculation of coolant properties under 15.5, 14, 13, 12, 11, and 10 MPa.
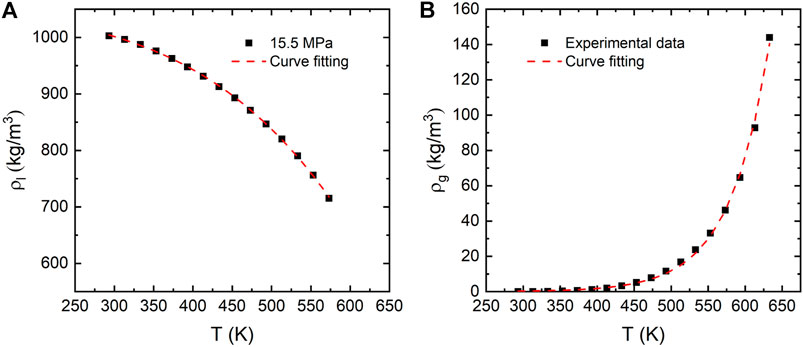
FIGURE 4. Density of liquid under 15.5 MPa (A) and saturated vapor (B).
Thermal conductivity of the liquid phase was assumed to be in the form of
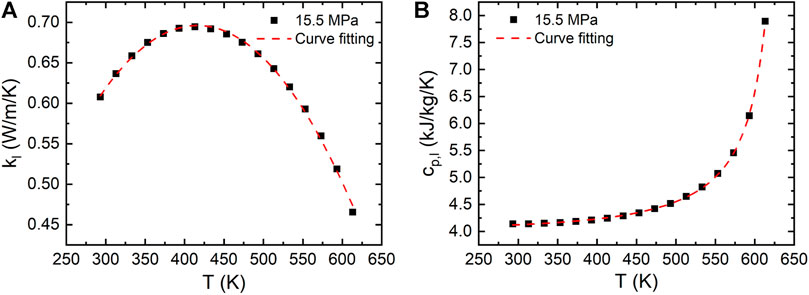
FIGURE 5. Thermal conductivity (A) and specific heat capacity (B) of liquid under 15.5 MPa.
We have carried out curve fitting of specific heat capacity for the liquid phase between 15.5 and 10 MPa, 293.15 K and
Curve fitting of dynamic viscosity for supersaturated vapor under different coolant pressures was carried out. Then it was applied to
The surface tension of water in this work was needed to determine the void fraction. We estimated the surface tension of water at coolant temperature and corresponding saturation pressure. The surface tension of water under these conditions was adopted as follows:
The curve fitting result is shown in Figure 6.
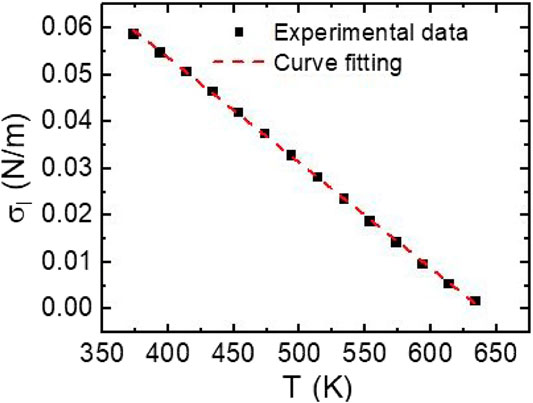
FIGURE 6. Surface tension of water.
Specific enthalpy of liquid and saturated gas was needed to calculate void fraction and other relevant quantities. Specific enthalpy of liquid was adopted as
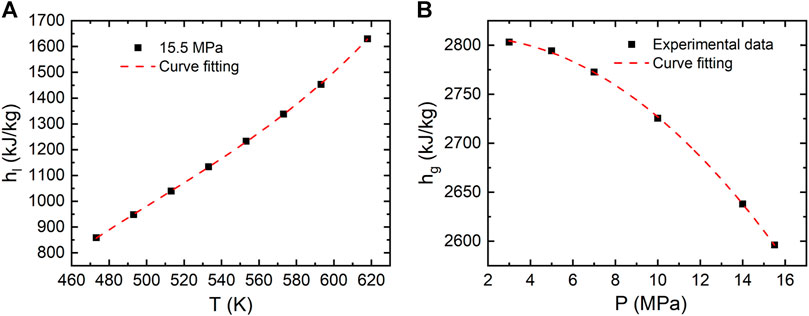
FIGURE 7. Specific enthalpy of liquid under 15.5 MPa (A) and saturated vapor (B).
Saturation temperature was also obtained by fitting the following equation:
where
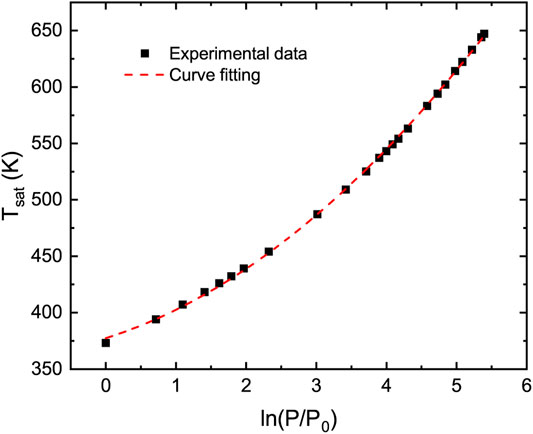
FIGURE 8. Saturation temperature of water under different pressures.
The single-channel model was used mathematically in this work to calculate the boundary condition. Several heat transfer coefficients on the outer surface of cladding were adopted depending on the heat transfer regime. We consider only the heat transfer conditions prior to the point of critical heat flux (CHF), and the corresponding coolant heat transfer coefficient is described as follows.
Dittus–Belter correlation was adopted to calculate the heat transfer coefficient under the single-phase forced flow condition (Dittus and Belter, 1985), as shown in Eq. 6. This equation is applicable for
Several studies were carried out to estimate the heat transfer coefficient under the subcooled boiling regime depending on coolant pressure and heat flux at the boundary. The most widely used correlations were proposed by Jens-Lottes and Thom et al. (Jens and Lottes, 1951; Thom et al., 1965). The expressions are described as follows:
Jens-Lottes correlation:
Thom correlation:
Both Jens-Lottes correlation and Thom correlation cover typical PWR-type conditions. However, since Thom correlation is capable of calculating the coolant heat transfer coefficient in both subcooled boiling regime and saturated boiling regime (Aounallah, 2010), it could serve as a transitional correlation between two regimes. Therefore, it was adopted in this work.
Both Schrock–Grossman correlation and Chen correlation are suitable for the simulation in this region. However, since Schrock–Grossman correlation has a more concise expression and is well performed at low and intermediate pressure ranges (Aounallah, 2010), it was adopted in this work to calculate the coolant heat transfer coefficient in this regime (Schrock and Grossman, 1962), which is given by
In this correlation,
The onset of nucleate boiling (ONB) is defined as the position where the first bubble of vapor appears on the heating wall. According to the study by Al-Yahia and Jo (2017), the evolution of heat flux and wall temperature around the ONB both present a turning point.
The onset of significant void (OSV) is defined as the point where the void fraction begins to increase significantly. The specific enthalpy of the coolant at the OSV was evaluated applying the Saha and Zuber model (Saha and Zuber, 1974):
where
The relation between G and
The flow area of the core and a single channel were estimated as follows:
Typical parameters of assemblages in the PWR are shown in Table 2.
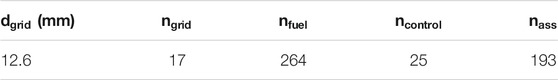
TABLE 2. Parameters of assemblages in the PWR.
Plenty of studies have been carried out to calculate the void fraction in the reactor core. In this work, we adopted the model proposed by Zuber and Findlay (Zuber and Findlay, 1965) and Manon (Manon, 2000). The void fraction was calculated as follows:
where
β and b were calculated as
The formula of drift velocity
The actual steam quality proposed by Levy was calculated based on equilibrium steam quality:
where
However, this expression assumes that the actual steam quality is equal to zero at the OSV, which does not conform to experimental results. In order to obtain a nonzero value at the OSV, Manon (Manon, 2000) proposed the following expression for actual steam quality based on the Levy model (Chen, 1967):
where
where
In order to determine
The single-phase heat transfer coefficient
In order to verify and validate the capability and reliability of the CAMPUS code, some comparisons of simulation results are needed. Validity of the CAMPUS code in predicting fuel rod performance has been proved in the study by Liu et al. (2015); Liu et al. (2016a); Liu et al. (2016b) by comparing the simulation results of CAMPUS with that of BISON, ABAQUS, and FRAPCON. In the study by Cubizolles et al. (2009), a series of fuel rod bundle heat transfer tests in the OMEGA-2 test facility were carried out. The experiments were carried out for a
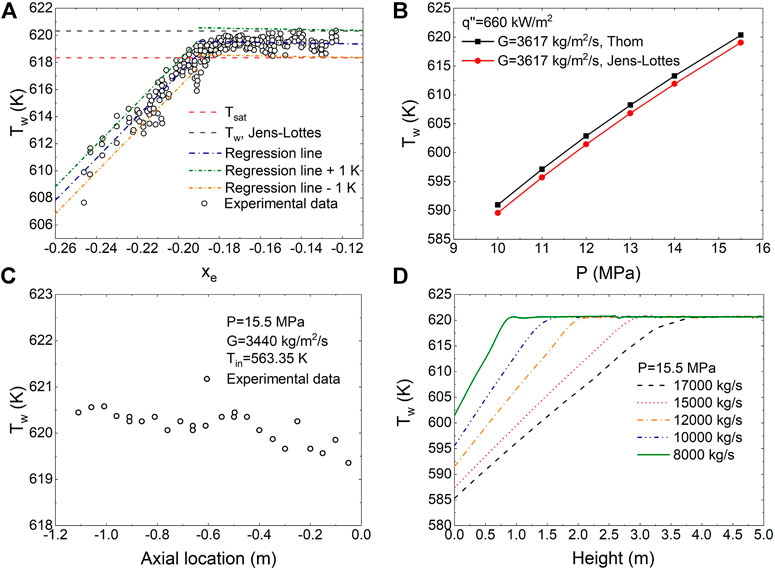
FIGURE 9. (A) Experimental data of wall temperature in subcooled boiling regime from the study by Cubizolles et al. (2009); the experimental data are compared against Jens–Lottes correlation. This test is subsequent to the boiling test shown in (C). (B) comparison of wall temperature predicted using Jens–Lottes correlation and Thom correlation under the normal PWR-type condition in this work. The temperature is compared at 107 s. (C) Experimental data of wall temperature in saturated boiling regime in the study by Cubizolles et al. (2009). (D) Simulation results of wall temperature under several PWR-type conditions in this work. In our model, the area of the entire core was estimated as 4.7 m2. Therefore, 17,000, 15,000, 12,000, 10,000, and 8,000 kg/s correspond, respectively, to 3,617, 3,191, 2,553, 2,128, and 1,702 kg/m2/s.
In this section, the stationary modeling results of void fraction for UO2 fuel under a drop of coolant pressure and mass flux are presented to provide a reference for the LOCA. Steam quality and void fraction are averaged between 104 and 107 s because calculated results show that their variation in this period is negligible. Averaged void fraction as a function of
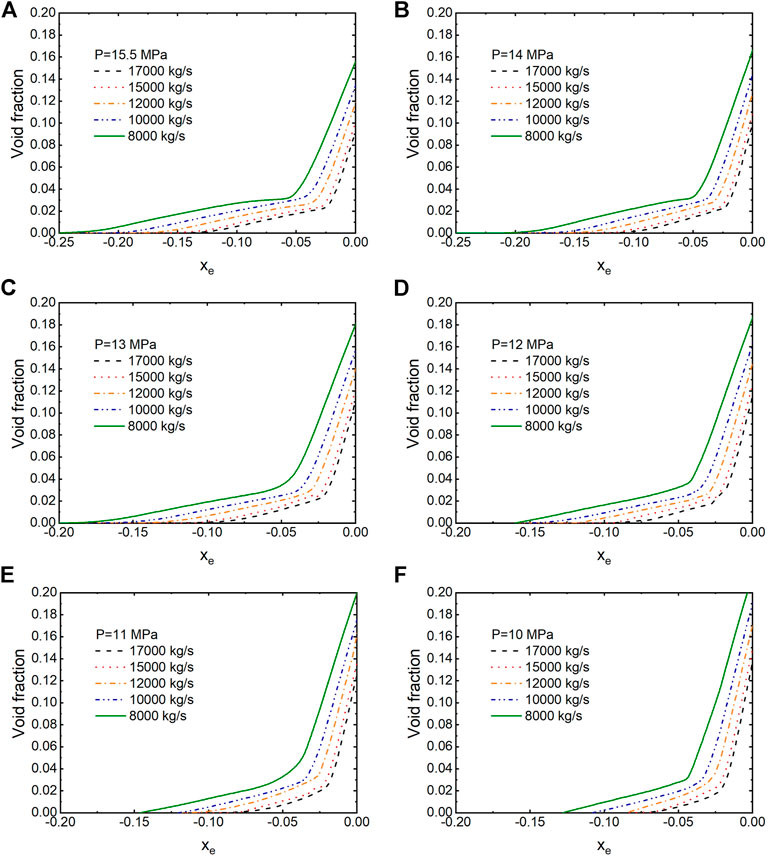
FIGURE 10. Averaged void fraction as a function of
The simulation results of void fraction are shown in Figure 11, as a function of axial location on the fuel rod. We took inlet coolant temperature as 566 K. Under 15.5 MPa, with mass flux investigated, the flow pattern of coolant passes from single-phase–forced convection to two-phase flow. As the pressure and mass flux decrease, the region of single-phase flow is increasingly replaced by two-phase flow. When the pressure decreases to 10 MPa, almost the entire fuel rod cladding is covered by the coolant in subcooled boiling and saturated boiling. This might provide a reference for the prediction of the starting point of critical heat flux under a LOCA.
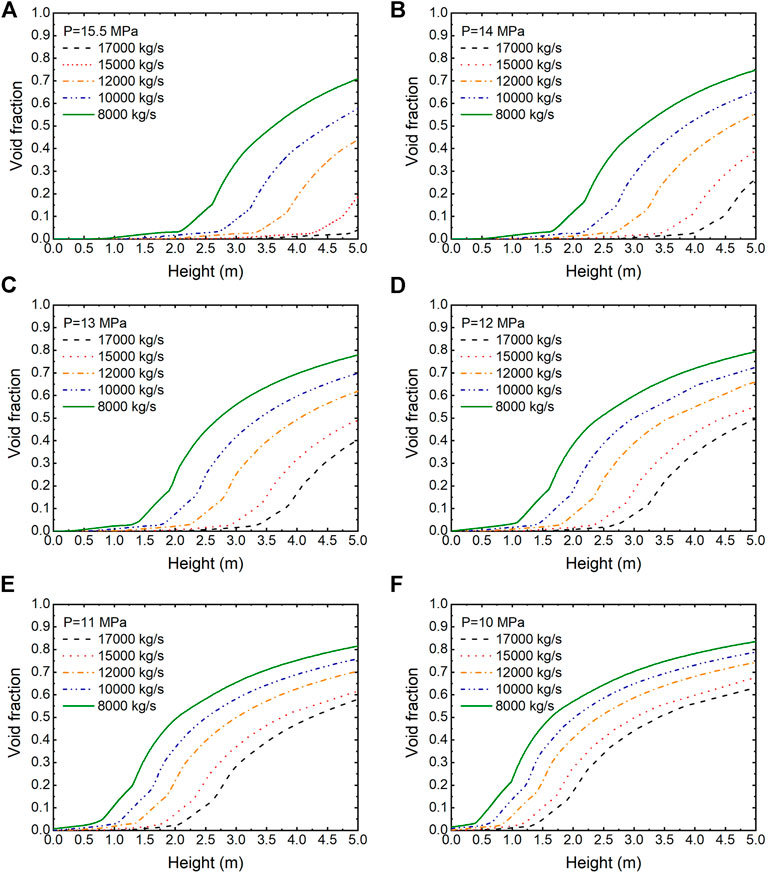
FIGURE 11. Averaged void fraction as a function of height under different coolant pressures and mass fluxes.
In this section, UO2 fuel performances such as hoop stress, axial stress, and radial stress under a drop of coolant pressure and mass flux were investigated. In our model, the simulation time lasts for 107 s, eventually reaching the burnup of nearly 120 WM h/kg(U). Figure 12 presents the evolution of hoop stress with fuel burnup for two operating conditions: one at 15.5 MPa and 17000 kg/s, and the other at 15.5 MPa and 12000 kg/s. Hoop stress was calculated as follows:
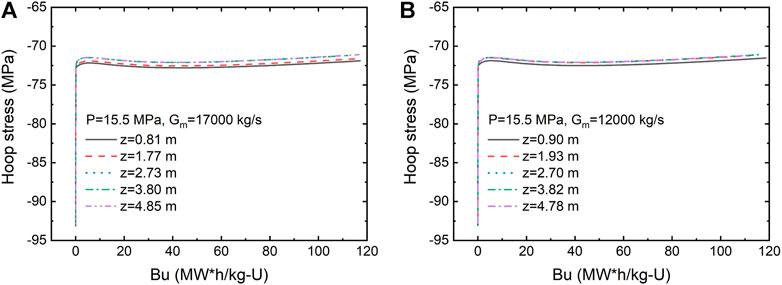
FIGURE 12. Evolution of hoop stress of UO2 fuel with burnup under the coolant pressure of 15.5 MPa and two different mass fluxes. Calculated results are compared at some similar positions in both cases.
Calculated results are compared at some similar positions in both cases. First, we can see that once the fuel power reaches the expected value, hoop stress in both cases is maintained almost as a constant within 120 WM h/kg(U), and relative variations of hoop stress remain within
Averaged hoop stress under different coolant pressures and mass fluxes is shown in Figure 13. The average value of hoop stress between 104 and 107 s is investigated since wall temperature is believed to reach the stationary regime. We can see that under normal coolant pressure (15.5 MPa), hoop stress increases almost linearly with height at the beginning part of the fuel rod. Nevertheless, after a certain point, it reaches saturation and then keeps fluctuating around the saturation line, whatever the mass flux is. This is similar to the distribution of wall temperature along axial location, as shown in Figure 9D. Under normal coolant pressure, within the range of height investigated, wall temperature increases linearly with height in the single-phase–forced convection region and reaches saturation eventually. Therefore, it could be inferred that the distribution of averaged hoop stress indicates exactly the distribution of wall temperature. The point where the hoop stress takes a turn is the starting point of subcooled boiling. We can also observe that hoop stress presents strong dependence on coolant pressure. The saturation value of hoop stress varies from −71.8 MPa to −33.0 MPa as coolant pressure drops from 15.5 to 10 MPa, which has a significant meaning to the safety of the cladding material under a LOCA.
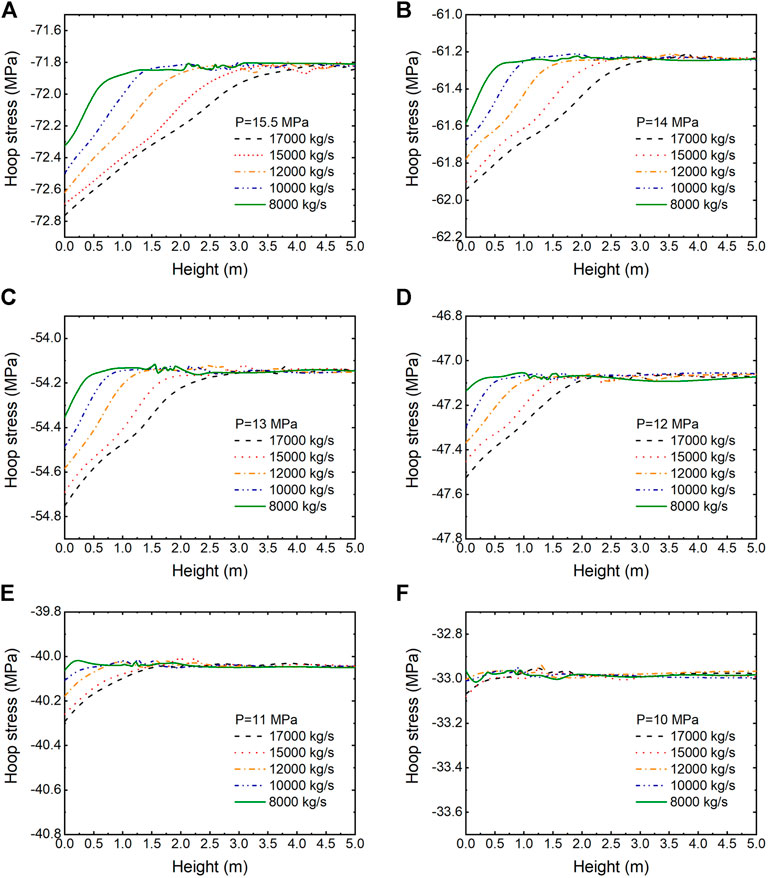
FIGURE 13. Averaged hoop stress of UO2 fuel under different coolant pressures and mass fluxes.
Figure 14 presents the evolution of axial stress with fuel burnup under different coolant pressures: 15.5, 13, and 10 MPa. Under each pressure, two operating conditions are compared: one is 17000 kg/s and the other is 8,000 kg/s. The figure shows simulation results at some similar axial locations of the fuel rod. It can be remarked that axial stress has a relatively large variation within the fuel burnup investigated, especially in the cases of high pressure, different from the evolution of hoop stress. Under the condition of 15.5 MPa and 17000 kg/s, at 4.85 m, axial stress varies from −190 MPa to −130 MPa eventually. The evolution of axial stress with burnup may depend on axial location. At a low axial location of the fuel rod, axial stress decreases more smoothly with burnup, different from the case at a high axial location, as shown in Figure 14A. At higher location such as 3.80 and 4.85 m, the evolution curves even coincide with each other. Combining with Figure 9D, we conclude that the entering of subcooled boiling regime in these two locations leads to the similarity of axial stress evolution. As shown in Figures 14B, D–F, axial stress presents similar trend of evolution at different axial locations since single-phase convection no longer occurs at these positions. Once the coolant flow enters the two-phase region, the evolution of axial stress with burnup at different axial locations follows the same pattern, also independent of mass flux.
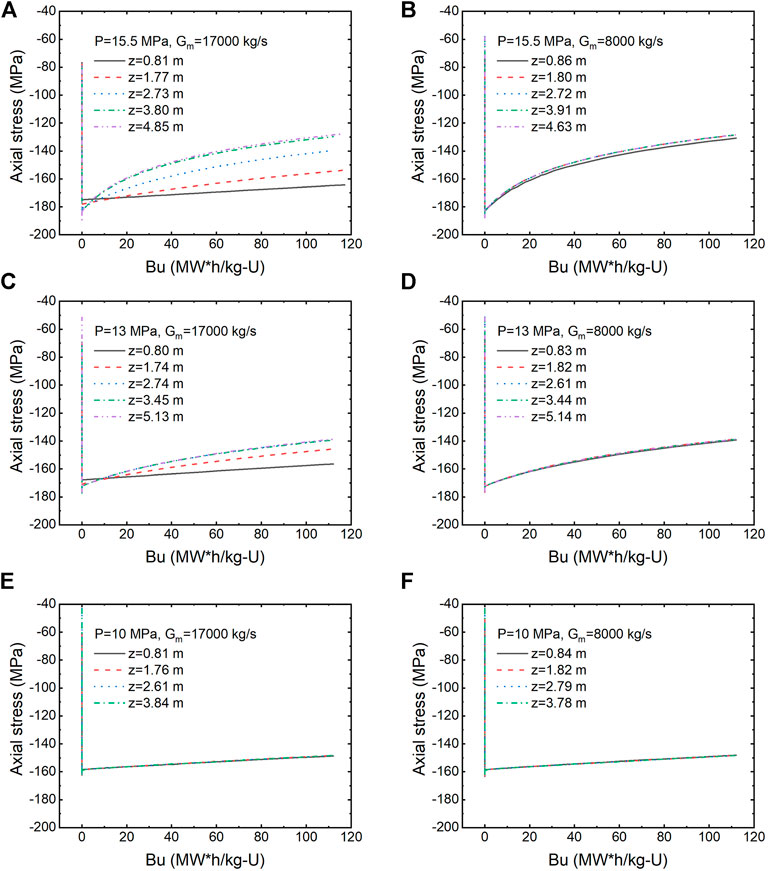
FIGURE 14. Evolution of axial stress of UO2 fuel with burnup under different coolant pressures and mass fluxes.
Comparing the modeling results in Figures 14B, D, F, we can see that the drop of coolant pressure seems to retard the decrease rate of axial stress with burnup in the two-phase flow region. In Figure 15, axial stress at 117 WM h/kg(U) is compared. We can see that axial stress distribution almost coincides with wall temperature distribution, similar to hoop stress. However, at a high mass flux, axial stress distribution in single-phase regions is not as linear as wall temperature.
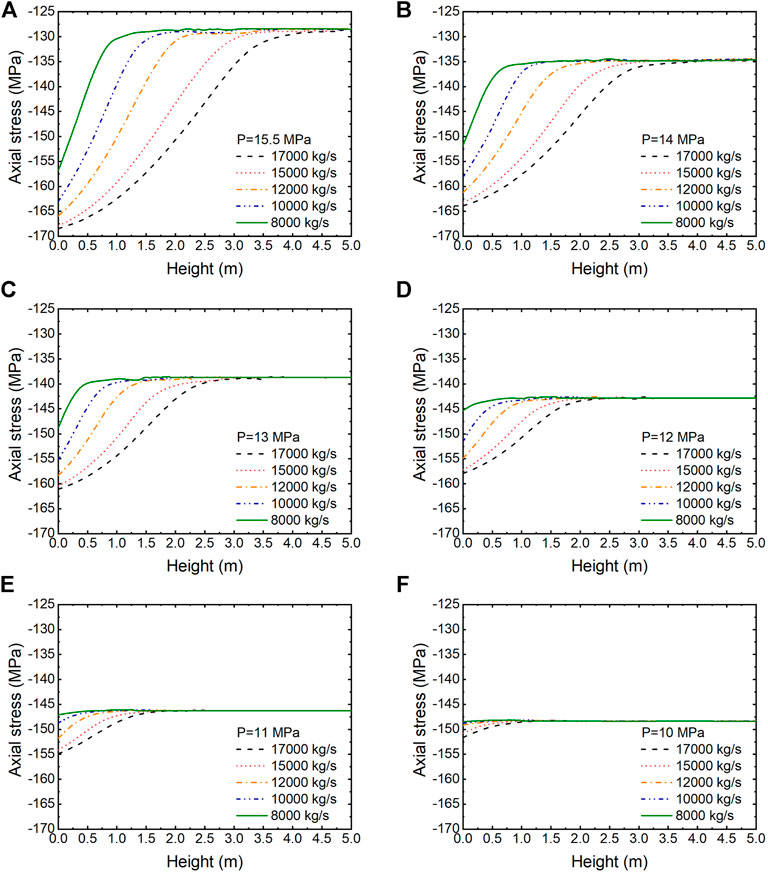
FIGURE 15. Axial stress of UO2 fuel at 117 WM h/kg(U) under different coolant pressures and mass fluxes.
The evolution of radial stress with fuel burnup is shown in Figure 16, and the simulated results under three coolant pressures are presented: 15.5, 13, and 10 MPa. Under each pressure, modeling results at a similar height with two different mass fluxes are compared: 17,000 and 8,000 kg/s. We can see that radial stress does not show a substantial variation with burnup, similar to hoop stress. Compared to hoop stress and axial stress, the average value of radial stress is less remarkable. Therefore, it is less influential to the cladding material.
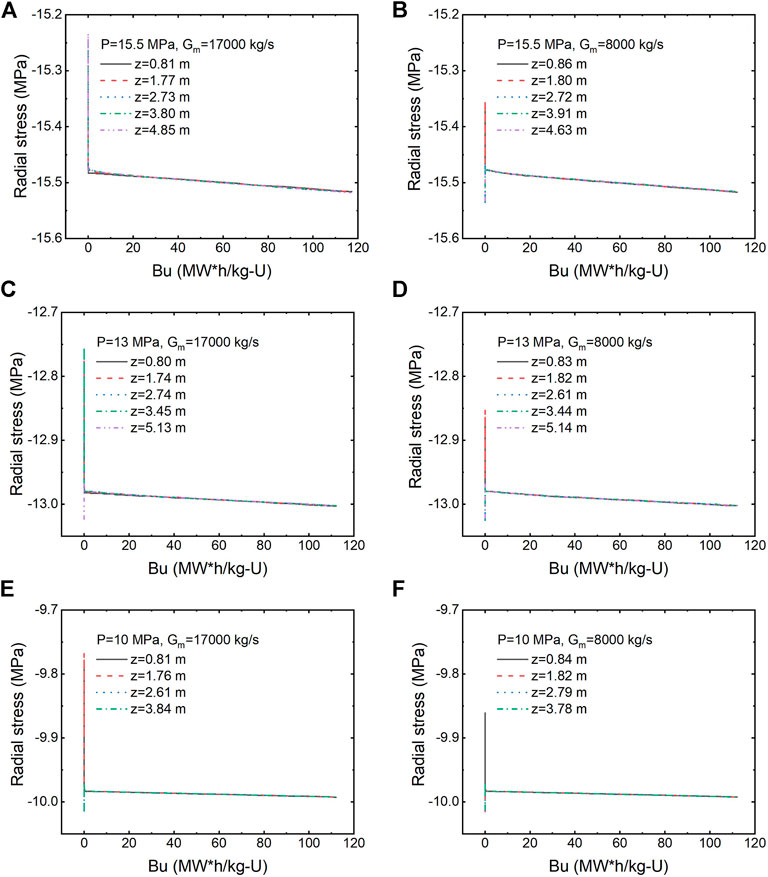
FIGURE 16. Evolution of radial stress of UO2 fuel with burnup under different coolant pressures and mass fluxes.
In summary, based on a previous work by Liu et al. (2016a), we have built up a self-defined multiple physics model based on COMSOL to simulate fuel performance of UO2 under normal conditions and a drop of both coolant pressure and mass flux. By developing the model and analyzing the modeling results, a more comprehensive understanding of both flow regimes before CHF and fuel performance under a loss of coolant pressure and mass flux is presented in this work, providing a reference for the LOCA.
Prediction of void fraction shows that
The study of material performances, hoop stress, radial stress, and axial stress is investigated. First of all, hoop stress and axial stress play obviously more important roles in the safety of the cladding material. In addition, the evolution of stress on Zr cladding may also serve as an indicator of flow pattern, since both hoop stress and axial stress have the same distribution with wall temperature along the axial direction of the fuel rod, determined by the flow pattern. The turning point signifies the start of the subcooled boiling regime. At last, under the condition of the LOCA, on the one hand, the hoop stress on Zr cladding is influenced the most by the drop of coolant pressure. Both hoop stress and axial stress are limited by a value dependent on the saturated boiling regime. On the other hand, the drop in coolant mass flux makes nearly no difference on radial stress, different from hoop stress and axial stress.
In our future work, more research including thermal fluid coupling after CHF, transient change of coolant pressure and mass flux, and other fuel materials with high thermal conductivity like UO2–BeO will be carried out to simulate the LOCA more realistically.
The raw data supporting the conclusion of this article will be made available by the authors, without undue reservation.
The work is mainly done by MY. LQ contributed to the accomplishment of this work, and WZ is the advisor of MY.
The financial support from the Nuclear Power Technology Innovation Center of China (No. 45000-41020012), the Fundamental Research Funds for the Central Universities of China (No. 45000-18841210), the International Science and Technology Cooperation Program of Guangdong Province (No. 2019A050510022), and Guangdong Major Project of Basic and Applied Basic Research (No. 2019B030302011) is highly appreciated.
The authors declare that the research was conducted in the absence of any commercial or financial relationships that could be construed as a potential conflict of interest.
Al-Yahia, O. S., and Jo, D. (2017). Onset of Nucleate Boiling for Subcooled Flow through a One-Side Heated Narrow Rectangular Channel. Ann. Nucl. Energ. 109, 30–40. doi:10.1016/j.anucene.2017.05.014
Aounallah, Y. (2010). Development of a Wide-Range Pre-CHF Convective Boiling Correlation. J. Nucl. Sci. Technology 47, 357–366. doi:10.1080/18811248.2010.9711966
Bailly, H., Menessier, D., and Prunier, C. (1999). The Nuclear Fuel of Pressurized Water Reactors and Fast Reactors Design and Behaviour. Hampshire, UK: Intercept Ltd
Belle, J. (1961). Uranium Dioxide: Properties and Nuclear Applications. US: Naval Reactors, Division of Reactor Development, US Atomic Energy Commission. Washington:Naval Reactors, Division of Reactor Development, U. S. Atomic Energy Commission
Bergles, A. E., and Rohsenow, W. M. (1964). The Determination of Forced-Convection Surface-Boiling Heat Transfer. J. Heat Transfer. 86, 365–372. doi:10.1115/1.3688697
Chen, J. C. (1966). Correlation for Boiling Heat Transfer to Saturated Fluids in Convective Flow. Ind. Eng. Chem. Proc. Des. Dev. 5 (3), 322–329. doi:10.13182/nse62-a2609410.1021/i260019a023
Chen, J. C. (1967). Forced Convection Subcooled Boiling-Prediction of Vapor Tric Fraction. Int. J. Heat Mass Transfer 10 (7), 951–965. doi:10.1016/0017-9310(67)90071-3
Cubizolles, G., Garnier, J., Chataing, T., and Groeneveld, D. (2009). PWR Bundle Heat Transfer Tests in the OMEGA-2 Test Facility. In The 13th International Topical Meeting on Nuclear Reactor Thermal Hydraulics. NURETH-13 Tokyo:Atomic Energy Society of Japan.
Dittus, F. W., and Boelter, L. M. K. (1985). Heat Transfer in Automobile Radiators of the Tubular Type. Int. Commun. Heat mass transfer. 12, 3–22. doi:10.1115/1.400815610.1016/0735-1933(85)90003-x
Dix, G. E. (1971). Vapor Void Fractions for Forced Convection with Subcooled Boiling at Low Flow Rate. Ph.D. Thesis. University of California.
Fox, R. W., McDonald, A. T., and Pritchard, P. J. (1998). Introduction to Fluid Mechanics. New York: John Wiley & Sons.
Frost, B. R. T. (1982). Nuclear Fuel Elements: Design, Fabrication and Performance. New York: Pergamon Press.
Griffith, P., Clark, J. A., and Rohsenow, W. M. (1958). Void S in Subcooled Boiling Systems. Cambridge, Mass: MIT Division of Industrial Cooperation.
Jens, W. H., and Lottes, P. A. (1951). Analysis of Heat Transfer, Burnout, Pressure Drop and Density Date for High-Pressure Water. conference. Lemont, Illinois:Argonne National Laboratory. doi:10.2172/4421630
Kroeger, P. G., and Zuber, N. (1968). An Analysis of the Effects of Various Parameters on the Average Void Fractions in Subcooled Boiling. Int. J. Heat Mass Transfer. 11 (2), 211–233. doi:10.1016/0017-9310(68)90151-8
Lahey, R. T., and Moody, F. (1977). The Thermal Hydraulics of a Boiling Water Nuclear Reactor. La Grange Park, Illinois:American Nuclear Society 5, 173.
Liu, R., Zhou, W., Shen, P., Prudil, A., and Chan, P. K. (2015). Fully Coupled Multiphysics Modeling of Enhanced thermal Conductivity UO 2 -BeO Fuel Performance in a Light Water Reactor. Nucl. Eng. Des. 295, 511–523. doi:10.1016/j.nucengdes.2015.10.019
Liu, R., Zhou, W., Prudil, A., and Chan, P. K. (2016). Multiphysics Modeling of UO2-SiC Composite Fuel Performance with Enhanced thermal and Mechanical Properties. Appl. Therm. Eng. 107, 86–100. doi:10.1016/j.applthermaleng.2016.06.173
Liu, R., Prudil, A., Zhou, W., and Chan, P. K. (2016). Multiphysics Coupled Modeling of Light Water Reactor Fuel Performance. Prog. Nucl. Energy 91, 38–48. doi:10.1016/j.pnucene.2016.03.030
Liu, R., Zhou, W., and Cai, J. (2018). Multiphysics Modeling of Accident Tolerant Fuel-Cladding U3Si2-FeCrAl Performance in a Light Water Reactor. Nucl. Eng. Des. 330, 106–116. doi:10.1016/j.nucengdes.2018.01.041
Liu, R., and Zhou, W. (2017). Multiphysics Modeling of Novel UO2-BeO sandwich Fuel Performance in a Light Water Reactor. Ann. Nucl. Energ. 109, 298–309. doi:10.1016/j.anucene.2017.05.037
Manon, E. (2000). Contribution à l’analyse et à la modélisation locale des écoulements bouillants sous-saturés dans les conditions des réacteurs à eau sous pression. [Ph.D. Thesis]. (Paris:Ecole Centrale de Paris)
Pastore, G., Williamson, R. L., Gardner, R. J., Novascone, S. R., Tompkins, J. B., Gamble, K. A., et al. (2021). Analysis of Fuel Rod Behavior during Loss-Of-Coolant Accidents Using the BISON Code: Cladding Modeling Developments and Simulation of Separate-Effects Experiments. J. Nucl. Mater. 543, 152537. doi:10.1016/j.jnucmat.2020.152537
Saha, P., and Zuber, N. (1974). Point of Net Vapor Generation and Vapor Void Fraction in Subcooled Boiling. Proc. 5th Int. Heat Transfer Conf. 4, 175–179. doi:10.1615/IHTC5.430
Schrock, V. E., and Grossman, L. M. (1962). Forced Convection Boiling in Tubes. Nucl. Sci. Eng. 12, 474–481. doi:10.13182/nse62-a26094
Shah, M. M. (1977). A General Correlation for Heat Transfer during Subcooled Boiling in Pipes and Annuli. ASHRAE Trans. 83, 202–217.
Shah, M. M. (2017). New Correlation for Heat Transfer during Subcooled Boiling in plain Channels and Annuli. Int. J. Therm. Sci. 112, 358–370. doi:10.1016/j.ijthermalsci.2016.10.016
Thom, J. R. S., Walker, W. M., Fallon, T. A., and Reising, G. F. S. (1965). 180. Paper 6: Boiling in Sub-cooled Water during Flow up Heated Tubes or Annuli. Proc. Inst. Mech. Eng. 226–246. doi:10.1016/0017-9310(86)90205-X
Van Uffelen, P., Győri, C., Schubert, A., van de Laar, J., Hózer, Z., and Spykman, G. (2008). Extending the Application Range of a Fuel Performance Code from normal Operating to Design Basis Accident Conditions. J. Nucl. Mater. 383, 137–143. doi:10.1016/j.jnucmat.2008.08.043
Van Uffelen, P., Hales, J., Li, W., Rossiter, G., and Williamson, R. (2019). A Review of Fuel Performance Modelling. J. Nucl. Mater. 516, 373–412. doi:10.1016/j.jnucmat.2018.12.037
Zuber, N., and Findlay, J. A. (1965). Average Volumetric Concentration in Two-phase Flow Systems. J. Heat Transfer. 87, 453–468. doi:10.1115/1.3689137
g acceleration of gravity (m/s2) saturated vapor, also gas phase
G mass flux density (kg/s/m2)
h specific enthalpy (J/kg)
k heat conductivity (W/m/K)
P coolant pressure (Pa)
T coolant temperature (K)
x actual steam quality
z height (m)
α void fraction
μ dynamic viscosity (Pa s)
ρ density (kg/m3)
σ surface tension (N/m)
b bulk
f film
g acceleration of gravity (m/s2) saturated vapor, also gas phase
V vapor
Z position
Keywords: void fraction, mechanical performance, multiphysics, CAMPUS code, LOCA, PWR
Citation: Yu M, Qian L and Zhou W (2021) Multiphysics Investigation on Coolant Thermohydraulic Conditions and Fuel Rod Behavior During a Loss-of-Coolant Accident. Front. Energy Res. 9:691813. doi: 10.3389/fenrg.2021.691813
Received: 07 April 2021; Accepted: 18 May 2021;
Published: 10 June 2021.
Edited by:
Xiaojing Liu, Shanghai Jiao Tong University, ChinaReviewed by:
Jongrok Kim, Korea Atomic Energy Research Institute (KAERI), South KoreaCopyright © 2021 Yu, Qian and Zhou. This is an open-access article distributed under the terms of the Creative Commons Attribution License (CC BY). The use, distribution or reproduction in other forums is permitted, provided the original author(s) and the copyright owner(s) are credited and that the original publication in this journal is cited, in accordance with accepted academic practice. No use, distribution or reproduction is permitted which does not comply with these terms.
*Correspondence: Wenzhong Zhou, emhvdXd6aDNAbWFpbC5zeXN1LmVkdS5jbg==
Disclaimer: All claims expressed in this article are solely those of the authors and do not necessarily represent those of their affiliated organizations, or those of the publisher, the editors and the reviewers. Any product that may be evaluated in this article or claim that may be made by its manufacturer is not guaranteed or endorsed by the publisher.
Research integrity at Frontiers
Learn more about the work of our research integrity team to safeguard the quality of each article we publish.