 Gaoya Shi
 Siqi Chen
 Hao Yuan1,2
 Xueyuan Wang
95% of researchers rate our articles as excellent or good
Learn more about the work of our research integrity team to safeguard the quality of each article we publish.
Find out more
ORIGINAL RESEARCH article
Front. Energy Res. , 16 June 2021
Sec. Electrochemical Energy Storage
Volume 9 - 2021 | https://doi.org/10.3389/fenrg.2021.690266
This article is part of the Research Topic Battery Technology and Management for Transportation Electrification View all 6 articles
Online state of health (SOH) estimation is essential for lithium-ion batteries in a battery management system. As the conventional SOH indicator, the capacity is challenging to be estimated online. Apart from the capacity, various indicators related to the internal resistance are proposed as indicators for the SOH estimation. However, research gaps still exist in terms of optimal resistance-related indicators, online acquisition of indicators, temperature disturbance elimination, and state of charge (SOC) disturbance elimination. In this study, the equivalent circuit model parameters are identified based on recursive least square method in dynamic working conditions in the life span. Statistical analysis methods including multiple stepwise regression analysis and path analysis are introduced to characterize the sensitivity of the parameters to SOH estimation. Based on the above approach, the coupling relationship between the parameters is comprehensively analyzed. Results indicate that the ohmic resistance R0 and the diffusion capacitance Cd are the most suitable parameters for the SOH indication. Furthermore, R0 and Cd are proved to be exponentially correlated to the ambient temperature, while SOC demonstrates a quadratic trend on them. To eliminate the disturbance caused by the ambient temperature and SOC, a compensating method is further proposed. Finally, a mapping relationship between SOH and the indicators under normal operations is established. SOH can be estimated with the maximum error of 2.301%, which proves the reliability and feasibility of the proposed indicators and estimation method.
Lithium-ion batteries are widely used as the primary energy storage for electric vehicles (EVs), owing to high energy density and low self-discharge rate (Chen et al., 2019; Liu et al., 2019). A reliable battery management system (BMS) is significant in real applications. Among the BMS functions, state of health (SOH) estimation is quite essential for timely maintenance and retirement. And online acquisition of indicators is the premise of the SOH estimation function.
Currently, many studies are conducted for the online SOH estimation of lithium-ion batteries, which involve battery aging mechanism confirmation (Broussely et al., 2005; Agubra and Fergus, 2013), battery life modeling (Ramadass et al., 2004; Gu et al., 2014a), accelerated life testing (Thomas et al., 2008; Gu et al., 2014b), and the conversion between real applications and lab applications (Takei et al., 2011; Hua et al., 2015; Sun and Xiong, 2015). In these research studies, the SOH indicator is the first and the most important thing.
The capacity and internal resistance of the battery are widely used SOH indicators (Jiang et al., 2019). Many data-driven SOH estimation methods such as support-vector machine (Deng et al., 2016), relevance vector machine (Zheng and Fang, 2015), Gaussian process regression (Liu et al., 2020a; Liu et al., 2020b), and extreme learning machine (Pan et al., 2018) are proposed to estimate SOH based on the capacity. Sliding mode observer (Kim, 2010), genetic algorithm (Chen et al., 2013), total least squares (Chen et al., 2013), Kalman filter (Berecibar et al., 2016), particle filter (Tang et al., 2019), and other improved state estimation methods are also used to quantify SOH with capacity and internal resistance as indicators. Apart from capacity and resistance, other indicators are also proposed in the previous studies. For instance, Bloom (Bloom et al., 2005) used the expression dV/dQ to determine the life state. A similar indicator is also widely suggested (Li et al., 2011; Wang et al., 2011; Han et al., 2014). Moreover, falloff of the battery terminal voltage (Zhou et al., 2016), curves of the terminal voltage during charging (Liu and Chen, 2019; Park et al., 2020), and time spent on a charging/discharging process (Yun and Qin, 2020) are also investigated as the SOH indicators.
Battery capacity is a relatively intuitive SOH indicator. However, the online estimation of the capacity is challenging due to the complexity of the estimation algorithms and the limited variety of inputs available from a cell under operation (Basia et al., 2021; Li et al., 2021). Hence, the SOH estimation methods based on capacity may be limited in EVs. To address this issue, the internal resistance can be utilized as an SOH indicator. At present, many studies have used internal resistance to characterize the SOH. Chen et al. (2013) concluded that the diffusion capacitance could be symbolized to characterize the battery life. Remmlinger et al. (2011) used a sum of the ohmic resistance and the gain of the first-order low-pass transfer-function element representing the polarization effect as the indicator of the battery performance. Wang et al. (2015) and Zenati et al. (2012) employed the ohmic resistance to evaluate the battery life. Furthermore, the charge transfer resistance is also used to characterize the SOH (Wang et al., 2019). Since many kinds of indicators related to the internal resistance are proposed, applicability and sensitivity to the SOH estimation need to be further analyzed for a specific application.
To obtain internal resistance, Zenati et al. (2012) adopted a fuzzy logic system to compute coefficients applied to the ohmic resistance measurements. This method possesses a higher accuracy but requires a higher amount of computation. Chen et al. (2013) used the genetic algorithm to identify the diffusion capacitance. The algorithm is difficult to be implemented online due to high computational complexity. Wang et al. (2019) selected the charge transfer resistance as an SOH indicator and obtained the resistance by fitting the impedance spectroscopy. However, the measurement of the impedance spectra requires supplementary devices (Basia et al., 2021). For online SOH estimation, the indicators should be obtained online.
Besides, there are many uncertainties in actual vehicle operating conditions. For the battery, the state including temperature and state of charge (SOC) will always change; it has a significant impact on the internal resistance (Wang et al., 2019; Wang et al., 2021). Remmlinger et al. (2011), Wang et al. (2015), and other researchers ignored the influence of SOC in their work. Galeotti et al. (2015) studied the variation of internal resistance with SOC and formed a map to consider the effect during the SOH estimation with the internal resistance. However, the influence of temperature on internal resistance was still ignored. In reference (Stroe et al., 2014), the impact of temperature was also not considered. To accurately describe the battery SOH, these factors should be considered.
To fulfill the research gaps, 1) the equivalent circuit model (ECM) parameters are identified based on the recursive least square method (RLSM), facilitating the online implementation; 2) a novel SOH indicator is determined after the applicability and sensitivity analysis on the identified parameters; and 3) a compensating method is proposed to eliminate the disturbance of temperature and SOC to the indicator. Finally, a mapping relationship between the battery SOH and the indicators is established and verified.
As listed in Supplementary Table S1, Cells 1–3 (LFP (8Ah)) are utilized to analyze and determine SOH indicators, and Cells 4–5 (LFP (40Ah) and NCA (2.9Ah)) are used for verification. Besides, Cell 4 is also used to develop the temperature and SOC compensation methods. The cycle aging tests are performed in a climate chamber at 30°C (Cell 2 and Cell 4), 35°C (Cell 1), and 40°C (Cell 3 and Cell 5) for different battery cells. The aging cycle is made up of a CC-CV charge process and a 2C-rate CC discharge process. In the CC-CV charge process, the battery cells are charged at a constant current of 1C-rate until the cutoff voltage is reached, and a constant voltage charge maintains the cutoff voltage until the current decayed to 1/10C-rate. The detailed settings about the charge and discharge processes are available in the Supplementary Material (Supplementary Table S2).
The test matrix for the reference performance test (RPT) is shown in Table 1. To identify the ECM parameters, the New European Driving Cycle (NEDC) and the Urban Dynamometer Driving Schedule (UDDS) are used in the RPT. These two operational conditions can excite the battery dynamic characteristic fully, facilitating parameter identification. The battery SOC is set to 60 and 70% for the parameter identification due to the following reasons:
(1) There exists a large current in the NEDC and UDDS conditions, which may cause transient overpotential phenomena. To avoid the testing failure caused by this issue, a middle SOC range is chosen.
(2) The open-circuit voltage (OCV) is relatively stable in this SOC range, reducing the error of parameter identification.
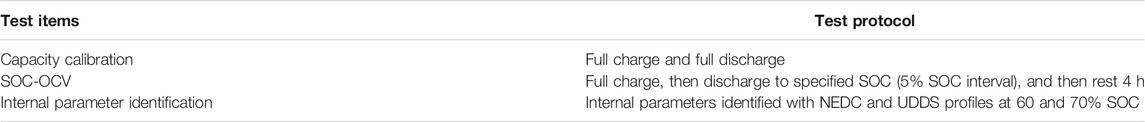
TABLE 1. Test matrix of RPT.
According to the operational temperature range of the battery cell in a real application, 5, 15, 25, and 35°C are set in the test to study the evolution of parameters at different temperatures. As for the disturbance of SOC, different SOCs (20–80% SOC with 10% SOC interval) are taken into consideration. RPT, as described above, is conducted on Cell 4 at different life stages under these settings.
ECM is widely used in the issues of parameter identification since it achieves a trade-off between accuracy and computational efficiency (Schmidt and Skarstad, 1997; Gomez et al., 2011). In the study, parameters identified from the ECM are utilized to construct the mapping relationship between internal parameters and capacity during the aging process. As shown in Figure 1, the second-order ECM is adopted to describe the battery dynamics. The specific definitions and explanations of the seven parameters (R0, Rp, Cp, Rd, Cd, E0, and U) can refer to our previous work (Dai et al., 2016). The difference equation of the battery model is governed by Eq. 1 (Gomez et al., 2011; Chang et al., 2014).
where Et,k is the difference between the terminal voltage U and the OCV at time k and Ik is the current at time k. The definitions of a, b, θ1, θ2, θ3, θ4, and θ5 are as follows:
In the study, the RLSM is used to identify the values of model parameters, that is, θ1, θ2, θ3, θ4, and θ5 (Dai et al., 2016). Once θ1, θ2, θ3, θ4, and θ5 are known, ECM parameters can be calculated by Eqs. 9–14:
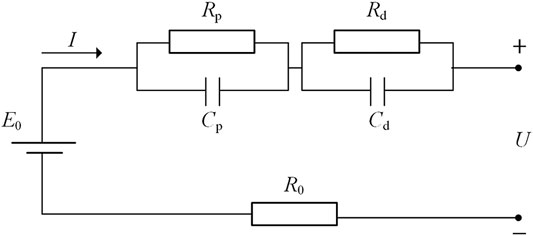
FIGURE 1. The second-order ECM.
To find the most sensitive SOH indicators, typical multivariate analysis methods including multiple stepwise regression analysis (MSRA) and path analysis (PA) are used to analyze the coupling relationship between the ECM parameters during the whole life span.
MSRA introduces the parameters into the characteristic equation one by one and removes the low-priority parameters based on some statistical indexes. The typical statistical indexes for judging whether a statistical variable satisfies the significant requirements include F-statistic, t-statistic, p-statistic, and R-squared. The F-statistic represents the degree of similarity between the sample and the population. A bigger F-statistic value represents the better effectiveness of sample data. The t-statistic can be used to evaluate the significance of each variable contained in the final regression equation. A bigger t-statistic value means that the variable is more significant. The thresholds of the t-statistic value at different significance levels are illustrated in Supplementary Table S3. When the significance level is lower than 0.05, the regression equation can be established. The p-statistic describes the error probability of the regression equation. A smaller p-statistic value means a smaller error. When the p-statistic value is higher than 0.05, the regression equation cannot be established. R-squared value reflects the fitting effect of the model. The closer the R-squared value is to 1, the better the fitting effect is.
Primary ECM parameters related to battery life span are initially extracted through MSRA, and then the regression equation between the selected parameters and SOH is established. Furthermore, the p-statistic value and R-squared value are used to evaluate the established model. The detailed calculation process of MSRA can be found in the study by Nghiep and Al (2001) and Stolzenberg (2004).
Each ECM parameter has a particular mapping relationship with battery capacity. For a specific parameter, this mapping relationship is not only related to its direct impact but also affected by the coupling relationship with the other parameters. PA can be utilized to analyze the coupling relationship between characteristic parameters (Stage et al., 2004), which is beneficial to acquire the direct influence of each parameter on the mapping relationship and mine the indirect impact on the other parameters by a correlation coefficient, direct path coefficient, and indirect path coefficient. Furthermore, the direct or indirect influence can be quantified through numerical models (Park et al., 2021).
The method is briefly described as follows. A multiple linear regression equation is established as Eq. 15.
where
Combining the above two equations, the following equation can be acquired:
where
where
The ECM parameters generally fluctuate with temperature and SOC even in the same battery aging state, which affects the reliability of the SOH definition. Hence, additional tests are conducted to reveal the disturbance of temperature and SOC. The SOH definition is modified accordingly. Moreover, the accuracy of the modified SOH definition will be verified by further battery life tests. The approach for SOH indicator determination proposed in this work is depicted in Figure 2.
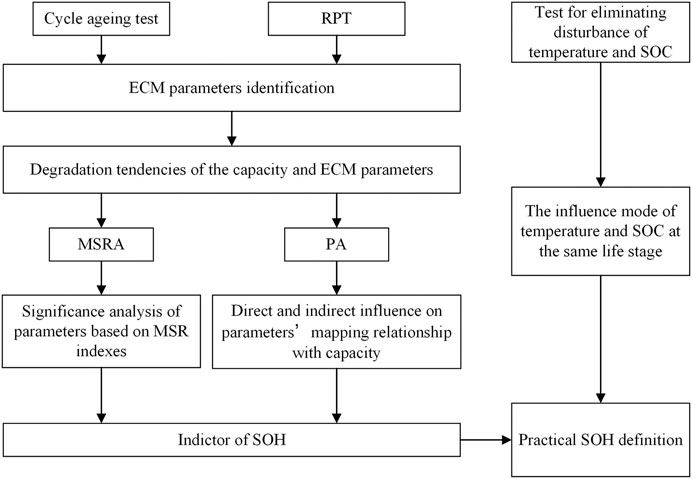
FIGURE 2. Methodology for SOH indicator determination.
The identification model for the ECM parameters is shown in Figure 3. The process is carried out in Matlab/Simulink. Coulomb counting is used to estimate SOC during the experiments. The current can be precisely measured by the battery tester, which leads to a tiny error during the Coulomb counting. Therefore, SOC estimation is considered accurate enough during the experiments.
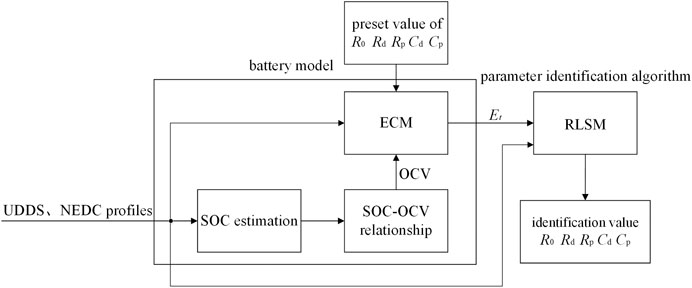
FIGURE 3. Model of parameter identification.
Further, the real-time value of OCV can be calculated based on the predefined SOC–OCV relationship, which originated from RPT in Experimental Setup. The terminal voltage U minus OCV of the ECM is the modeled voltage response Et required by the identification algorithm. The ECM parameters are identified based on the RLSM. To verify the accuracy of the identification method, the values of ECM parameters are preset, and the model is then tested with current profiles of UDDS and NEDC.
The validation test is carried out four times. By comparing the identified results with the preset values of ECM parameters, the accuracy of the identification method can be validated. The comparison results in different life stages under UDDS current profile are shown in Supplementary Figure S1. The identification values of R0, Rd, Rp, and Cd are approximately equal to their preset values. However, there is a relative error of about 3% in identifying Cp (within the tolerance). A similar conclusion can be drawn in the NEDC condition. R0, Rd, Rp, and Cd can be accurately estimated, and for the polarization capacitance Cp, the error is within 4%.
UDDS and NEDC current profiles are loaded to the battery on the testing bench, and the actual values of response voltage and current can be obtained and put into the identification algorithm. Accordingly, the ECM parameters can be identified. The convergence process of each parameter identification under the UDDS current profile is shown in Figures 4A–E. The convergence time of each parameter is similar: about 300 s.
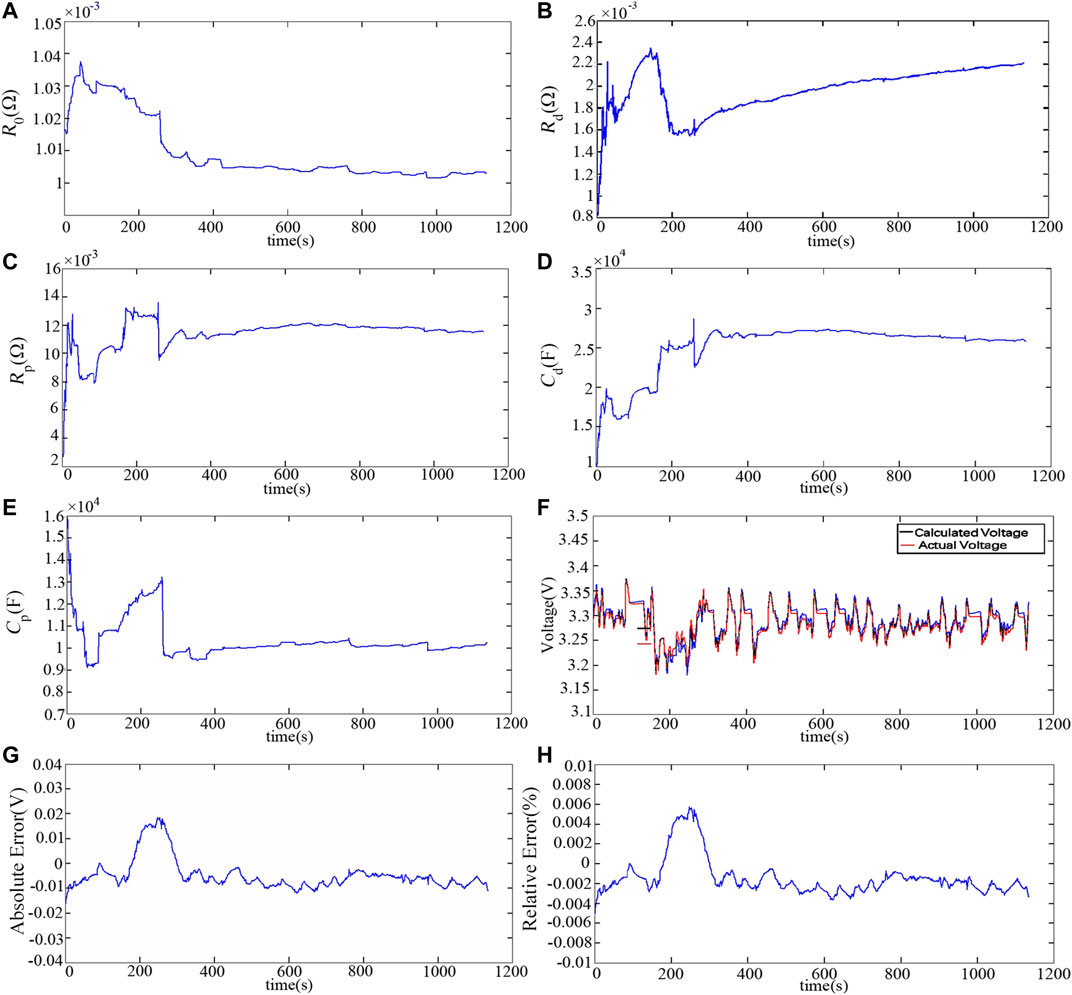
FIGURE 4. (A) Convergence process of R0. (B) Convergence process of Rd. (C) Convergence process of Rp. (D) Convergence process of capacitance Cd. (E) Convergence process of capacitance Cp. (F) Comparison between calculated voltage and actual voltage. (G) Absolute error of calculated voltage compared with actual voltage. (H) Relative error of calculated voltage compared with actual voltage.
In previous studies of battery model parameter identification, the performance of the identification is generally validated by comparing the modeled voltage and the actual voltage. The modeled voltage is obtained by the following method. The ECM parameters are set in the above parameter identification model to the identification results obtained by the RLSM with the input (the actual values of response voltage and current). The modeled voltage response Et can be calculated by the ECM module. As shown in Figure 4F, the modeled voltage matches the actual voltage well. The absolute error and the relative error are displayed in Figures 4G,H. The maximum absolute error is 0.0184 V, and the maximum relative error is just 0.57%. The result under the NEDS current profile is similar. The maximum absolute error is 0.0299 V, and the relative error is within 0.96%. Therefore, the proposed identification method is reliable and reasonable.
The ECM parameters during the whole lifetime are estimated based on the aforementioned identification method. Accordingly, the degradation tendency of each parameter can be obtained. Subsequently, the results are statistically analyzed to explore the relationships between the ECM parameters and the battery capacity to extract the optimal SOH indicators. In the study, the normalized values of ECM parameters are adopted for eliminating the errors caused by the difference between different physical units.
For the LFP battery with a nominal capacity of 8Ah (Cell 1–Cell 3), the degradation tendencies of the ECM parameters identified at 70% SOC during the whole lifetime are depicted in Figure 5. With the battery aging, R0, RP, and Rd increase, while CP and Cd decrease, which is similar to the verification batteries (Cell 4 and Cell 5) drawn in Supplementary Figure S2. Hence, these five parameters can all be used as SOH indicators to characterize the battery life. For batteries at 60% SOC, the same conclusion can be obtained.
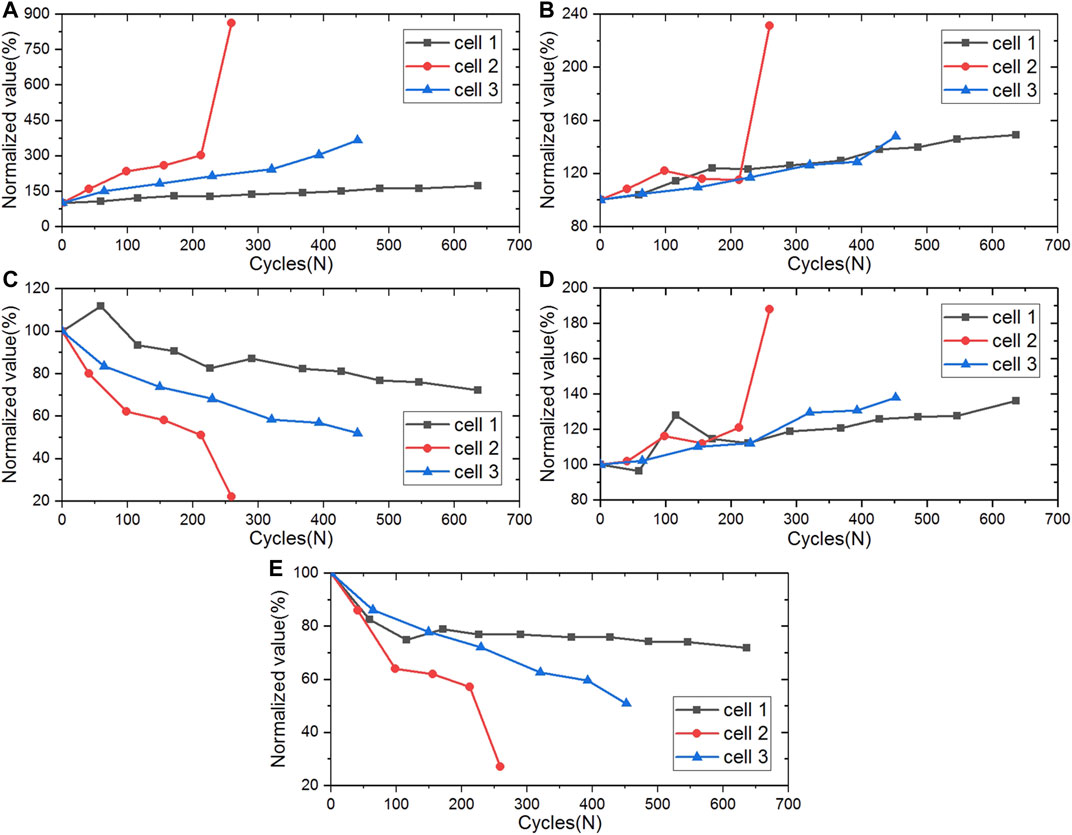
FIGURE 5. Degradation tendencies of ECM parameters under 70% SOC for Cells 1–3: (A)R0, (B)Rp, (C)Cp, (D)Rd, and (E)Cd.
As mentioned above, the five ECM parameters can be used to characterize the battery SOH. However, their mapping relationship with the capacity varies. The mapping relationship between some parameters and the capacity is noticeable, while the other parameters cannot reflect the capacity evolution. In this section, MSRA and PA are used to find indicators considerably correlated with the capacity.
Parameters of Cell 1 identified at 70% SOC are taken as an example for MSRA. The normalized values of the parameters at different life stages are available in the Supplementary Material (Supplementary Figure S3A). The indexes of MSR for each parameter are listed in Table 2. Note that there are three analysis results of MSR indexes in Table 2. Here is the first analysis. As mentioned in the Principle of Multiple Stepwise Regression Analysis, when the values of F-statistic, t-statistic, and R-square are higher, the p-statistic is smaller, and the parameter will be more significant. Hence, the relationship between the ohmic resistance R0 and the battery capacity is apparent.
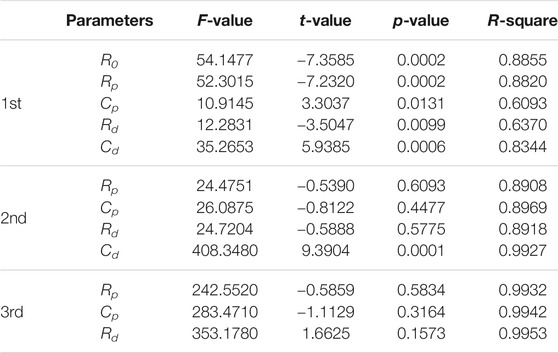
TABLE 2. Indexes of MSR for Cell 1.
After removing R0, MSRA is performed again for the remaining ECM parameters. The second analysis in Table 2 gives out the indexes for the remaining four parameters, revealing that Cd is another parameter in the regression equation.
In MSRA, when multiple parameters appear in the regression equation due to the coupling relationship between these parameters, it is necessary to analyze the significance of each parameter to determine whether there are parameters that need to be removed from the equation. The t-statistic value of R0 is −11.4129 and that of Cd is 9.3904. Furthermore, their p-statistic values are both close to 0. Therefore, R0 and Cd are both essential parameters. These parameters should be kept in the regression equation.
The MSR indexes of the remaining three parameters are calculated again. The third analysis in Table 2 shows that the most critical parameter is Rd. However, the t-statistic value is less than 2.365 (sample size is 9), and the p-statistic value is more than 0.05, which cannot meet the lowest requirement for entry into the regression equation described in Principle of Multiple Stepwise Regression Analysis. Similarly, the other ECM parameters cannot be introduced into the regression equation. So far, the MSRA is finished. The ohmic resistance R0 and the capacitance Cd are the most suitable indicators of the battery life for Cell 1 at 70% SOC. The final linear equation characterizing SOH is expressed with
Moreover, MSRA is also performed on the same battery (Cell 1) calibrated at 60% SOC, and Supplementary Figure S3B exhibits the normalized values of ECM parameters. The critical parameters include ohmic resistance R0, capacitance Cd, and resistance Rp. And the linear regression equation is established as Eq. 20.
From Eqs. 19 and 20, it is found that the SOH indicators are different for the same battery at different SOCs. Therefore, it is not easy to obtain the general SOH indicators only through MSRA. The same conclusion can be obtained in the MSRA of Cell 2. The most critical parameters are Rd and Cd for Cell 2 at 70% SOC. However, only Cd is selected as the indicator for Cell 2 at 60% SOC.
To summarize, SOH can be defined by MSRA, but for the same battery at different SOCs or different batteries at the same SOC, the SOH indicators are not the same. Therefore, pure MSRA cannot obtain stable SOH indicators, and PA is proposed to achieve this objective.
(1) Analysis of Cell 1 at 70% SOC
Table 3 shows the correlation coefficients between ECM parameters. The positive coefficient represents a positive correlation, the negative coefficient means negatively correlated, and the degree of correlation is determined by the absolute value of the coefficient. The correlation coefficient thresholds at different significance levels (P) are illustrated in Supplementary Table S4. There is a significant relationship between two variables when p < 0.05 and an extremely significant relationship when p < 0.01. For Cell 1 at 70% SOC, it can be observed that the correlation coefficient thresholds of the significant level and the extremely significant level are 0.666 and 0.798, respectively. From Table 3, although there is no significant correlation between Cp and Cd, the correlation coefficients between all other parameter pairs have reached a high level. There are even quite a few parameter pairs that have an extremely significant relationship. Thus, there is a complicated coupling relationship between the abovementioned parameters.
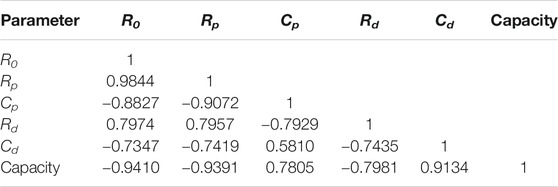
TABLE 3. Correlation coefficient between parameters of Cell 1 (70% SOC).
The direct path coefficients and the indirect path coefficients of ECM parameters can be calculated as introduced in Principle of path analysis, and the result is demonstrated in Table 4. The bold numbers on the diagonal line in Table 4 are the direct path coefficients between each ECM parameter and battery capacity. The rightmost column of the table is the correlation coefficients between each parameter and capacity, as mentioned in Table 3. The remaining numbers are the indirect path coefficients. Each parameter has four indirect path coefficients since its mapping relationship with capacity can be affected by the four coupling relationships between it and the remaining four parameters. This coupling relationship is considered an indirect influence. The positive and negative of the path coefficient represent the positive and negative influence, and the absolute value of the path coefficient represents the degree of influence. Notably, the correlation coefficient of each parameter is equal to the direct path coefficient plus the sum of all indirect path coefficients.
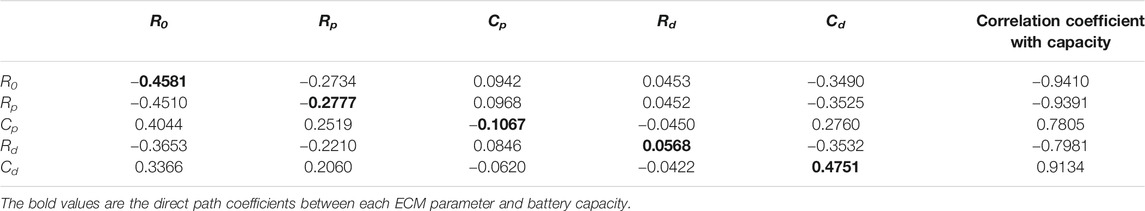
TABLE 4. Direct path coefficient and indirect path coefficient of Cell 1 (70% SOC).
The analysis for Table 4 is described as follows:
(a) The correlation coefficient indicates the significance of each parameter’s mapping relationship with capacity. Accordingly, the order of the ECM parameters’ relevance is R0> Rp> Cd> Rd> Cp. However, the order does not mean that R0 can be used as an SOH indicator, and Cp does not have this potential. As elaborated above, the correlation coefficient is equal to the direct path coefficient plus the sum of all indirect path coefficients. Therefore, it can be concluded that the above mapping relationship includes the direct influence and the indirect influence from the other parameters.
(b) The correlation coefficient between Cd and the battery capacity reaches a high level (0.9134), and the direct path coefficient between them is the highest (0.4751). The indirect path coefficient of Cd through R0 is larger, and that through other parameters are relatively small, which indicates that the significant mapping relationship between Cd and capacity is mainly affected by itself and the indirect influences through Cd and R0.
(c) The direct path coefficient and the correlation coefficient between R0 and capacity are both considerable. Hence, R0 is an essential factor. Cd plays a principal role in the indirect influence by analyzing the indirect path coefficients of R0.
(d) The correlation coefficient between Rp and capacity is also relatively large, ranking the second among all five ECM parameters. Noted that the indirect influences through R0 (−0.4510) and Cd (−0.3525) are higher than the direct influence of Rp itself (−0.2777). Conversely, the indirect influences through Cp and Rd have almost no contribution to the mapping relationship of Rp with capacity. It can be concluded that the mapping relationship between Rp and capacity mainly results from the effects of R0 and Cd, and Rp is not suitable as an SOH indicator.
(e) For Cp and Rd, although the correlation coefficients have reached a significant level, the direct path coefficients between them and the battery capacity are small. The significant correlation coefficient is caused by the indirect influences of R0 and Cd. Hence, Cp and Rd have no potential as SOH indicators.
Based on the above analysis, the ohmic resistance R0 and the capacitance Cd are considered to be the optimal SOH indicators for Cell 1 at 70% SOC. The expression of SOH is shown in Supplementary Table S5.
(2) Analysis of Cell 1 at 60% SOC
The PA process of Cell 1 at 60% SOC is the same as above. There are also complicated coupling relationships between the ECM parameters. The direct path coefficients and the indirect path coefficients of ECM parameters are documented in Table 5. The significance of the five parameters can be sorted as R0> Cd> Rp> Cp> Rd. There is a considerable mapping relationship between R0 and the capacity caused by itself and the indirect influence through Cd. The direct path coefficient of Cd and its indirect path coefficient through R0 are also significant. The direct influences of Rp, Cp, and Rd on their mapping relationships with battery capacity are not apparent, but their indirect influences through R0 and Cd are evident. Hence, the same conclusion can be drawn as the above Cell 1 at 70% SOC. R0 and Cd are selected as the SOH indicators. Moreover, its SOH expression is also demonstrated in Supplementary Table S5.
(3) Analysis of Cells 2–5
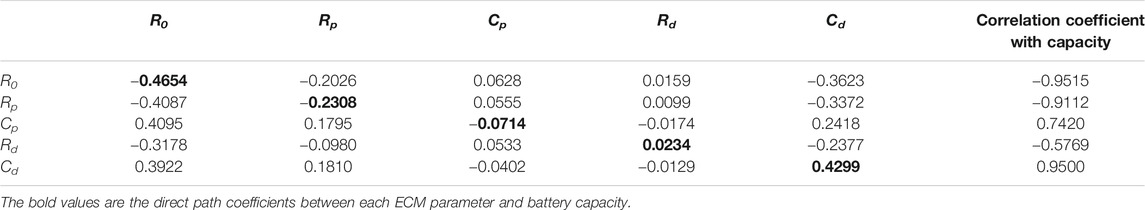
TABLE 5. Direct path coefficient and indirect path coefficient of Cell 1 (60% SOC).
The accelerated aging test temperature of Cell 2 (30°C) and Cell 3 (40°C) is different from that of Cell 1 (35°C). The same PA is carried out on them. Combining the analysis results of the correlation coefficient, direct path coefficient, and indirect path coefficient, the ohmic resistance R0 and capacitance Cd can be determined as the primary SOH indicators, which are consistent with the conclusion of Cell 1. The nominal capacity of Cell 4 (40Ah) is varied from that of Cells 1–3 (8Ah), and the type of Cell 5 (NCA) is different from that of Cells 1–3 (LFP). PA is conducted on Cell 4 and Cell 5 at 60% SOC and 70% SOC to investigate whether the above conclusions are universal. Since the analysis process is the same as above, there is no need to repeat it. The same as in Cells 1–3, the final SOH indicators are R0 and Cd. Their SOH expressions are demonstrated in Supplementary Table S5.
According to the above analysis, the SOH expressions of Cells 1–5 at different SOCs can be obtained, as shown in Supplementary Table S5. The comparison of the actual SOH and calculated SOH derived from the above SOH expressions is illustrated in Figure 6. The calculated SOH at different SOCs of all the cells reproduces the experimental results with a maximum error of 2.8%. Therefore, as long as the real-time values of R0 and Cd are identified online, SOH can be accurately estimated.
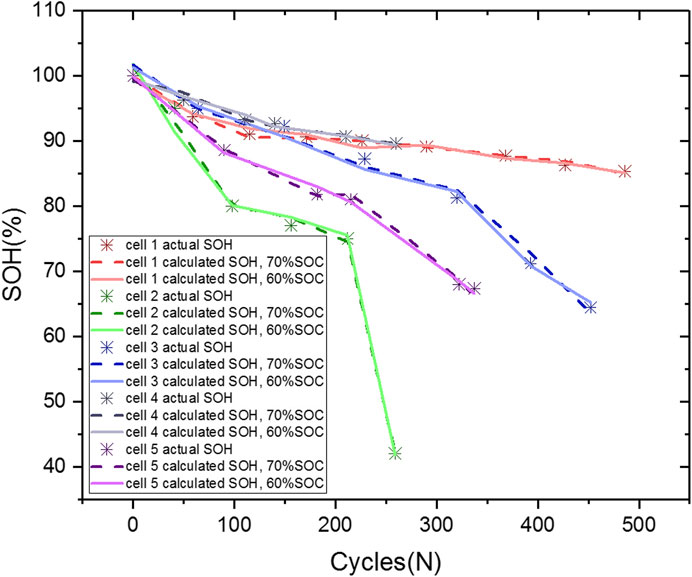
FIGURE 6. Comparison between the calculated SOH and actual SOH.
Since the ECM parameters are easily affected by ambient temperature and SOC, the definition of SOH in the previous section needs to be revised.
The ECM parameters of Cell 4 are identified at different temperatures to investigate the evolutions of R0 and Cd. Figures 7A and B present the variations of SOH indicators at different temperatures. It is apparent that R0 decreases and Cd increases as the temperature increases. Furthermore, the variation laws are similar for various SOC. 50% SOC is selected to investigate the modified expression of SOH. The SOH definition based on the method in Determination of State of Health Indicators Based on Statistical Analysis is expressed as follows:
According to Figures 7A and B, temperature and the two SOH indicators are both considered to be exponentially or linearly correlated. Their expressions are as follows:
where T is the absolute temperature and Tref is the reference temperature set to 25°C (298.15 K).
The results of performing exponential and linear temperature factors are shown in Figures 8A,B, respectively. Figure 9A reveals the error in the above two SOH expressions to compare the accuracy of the exponential trend and the linear trend. The maximum error of the exponential trend is 2.74% at 25°C (298.15 K), while the maximum error of the linear trend is 3.99% at 25°C (298.15 K). Moreover, the overall error of the linear trend is more significant than that of the exponential trend. Therefore, it can be concluded that the disturbance of temperature to the SOH indicators is closer to the exponential trend.
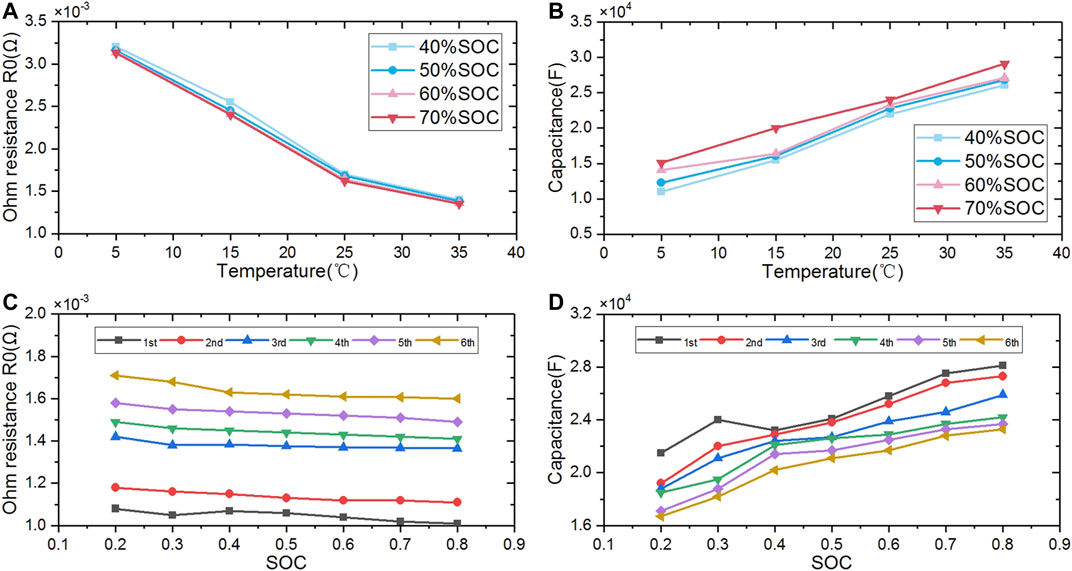
FIGURE 7. (A) The disturbance of temperature to ohmic resistance R0 under different SOCs. (B) The disturbance of temperature to capacitance Cd under different SOCs. (C) The disturbance of SOC to ohmic resistance R0 at different life stages. (D) The disturbance of SOC to capacitance Cd at different life stages.
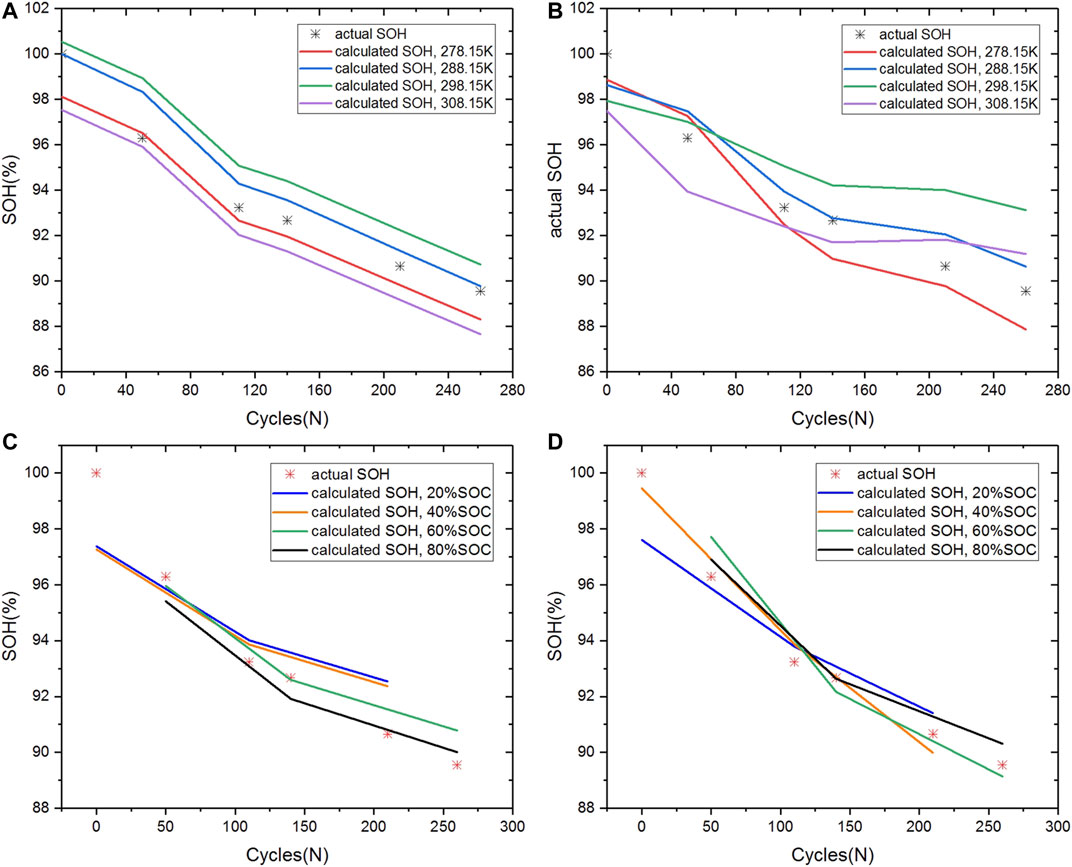
FIGURE 8. The comparison between the calculated SOH under different temperatures and the actual SOH of Cell four under 50% SOC. (A) Exponential temperature factor. (B) Linear temperature factor; the comparison between the calculated SOH under different SOCs and the actual SOH of Cell 4 at 25°C. (C) Exponential SOC factor. (D) Quadratic SOC factor.
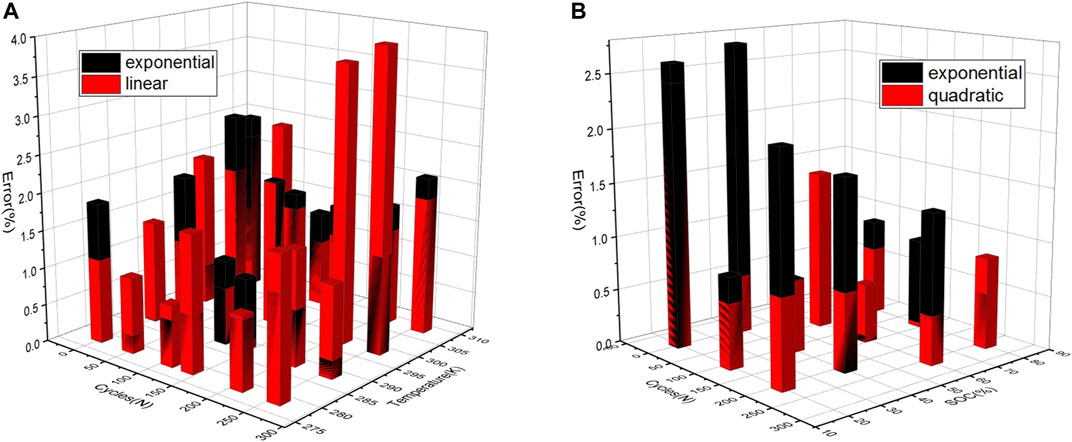
FIGURE 9. (A) Errors of SOH expressions with exponential temperature factor and linear temperature factor. (B) Errors of SOH expressions with exponential SOC factor and quadratic SOC factor.
Similarly, based on the experimental data of Cell 4, the evolution of SOH indicators at different SOCs is also studied. As Figures 7A,B reveal, the disturbances of different SOCs to the SOH indicators are roughly the same at each temperature within the operational temperature range of the battery (5–35°C). Thus, the experimental data at 25°C can be used for analysis, and the results can be applied to other temperatures. Figures 7C and D present the variations of the SOH indicators at different SOCs at 25°C. Based on the variation trends, the impacts of SOC on SOH indicators are both fitted with an exponential or quadratic relationship. Their expressions are illustrated as Eqs. 26, 27, respectively.
where μ, σ, δ, a, b, c, d, and ϕ are the model parameters, and the fitting results are described as follows:
The results of performing exponential and quadratic SOC factors are shown in Figures 8C and D, respectively. The comparison of errors is shown in Figure 9B, which reveals that the quadratic relationship between SOC and SOH indicators is in better agreement with the experimental data.
Based on the above analysis, both temperature and the two SOH indicators are proven to be exponentially correlated, while both the SOC and the two SOH indicators are quadratically correlated. Finally, the definition of SOH considering the disturbance of temperature and SOC is established as Eq. 30.
The comparisons between the actual SOH and the estimated SOH at different SOCs (40, 50, 60, and 70%) and temperatures (5, 15, 25, and 35°C) are shown in Figure 10. Among them, the actual SOH at 5, 15, and 35°C is 90.648%, and the maximum error is 2.301% under a specific operational condition (40% SOC, 15°C). Differently, the actual SOH at different SOCs varies at 25°C to verify the applicability of the final SOH definition in different life stages. The actual SOH at SOC of 40, 50, 60, and 70% is 100, 96.29, 92.66, and 90.648%, respectively. In Figure 10C, it can be observed that the SOH calculated by Eq. 30 is quite close to the actual SOH, and the maximum error is 1.276% at 40% SOC. This result indicates that the proposed indicators can be used for accurate SOH estimation considering different ambient temperatures and SOCs.
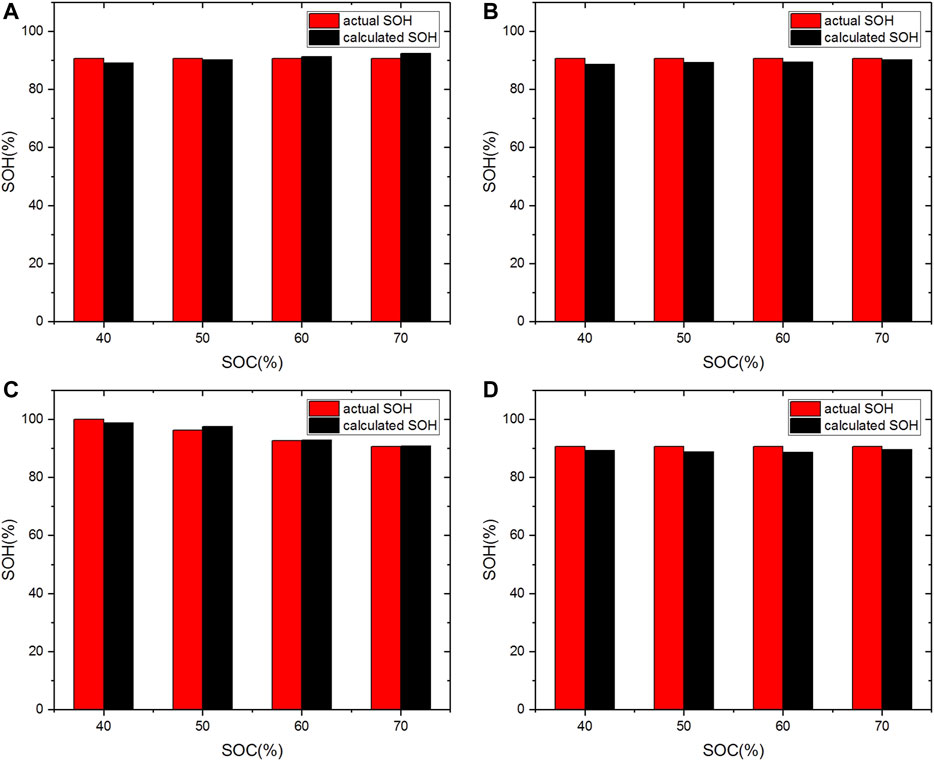
FIGURE 10. The comparison between the calculated SOH under different SOCs at various temperatures and the actual SOH: (A) 5°C, (B) 15°C, (C) 25°C, and (D) 35°C.
In most cases, SOH estimation is conducted based on the battery capacity. However, the capacity estimation is difficult to be implemented online in EVs. Measurable SOH indicators from ECM based on statistical analysis are proposed in this study. The main conclusions of this research are drawn as below:
(1) The RLSM is utilized to identify the ECM parameters in UDDS and NEDC conditions. The identified values of R0, Rd, Rp, Cd, and Cp are verified with the fitting of the battery response voltage. The identification errors are within the tolerance.
(2) With the battery aging, R0, RP, and Rd increase, while CP and Cd decrease. However, there are complicated coupling relationships between these ECM parameters. These coupling relationships are analyzed by MSRA and PA. According to the analysis results, R0 and Cd are finally determined as SOH indicators. This conclusion applies to NCA batteries and LFP batteries with different nominal capacities.
(3) R0 and Cd fluctuate at ambient temperature and SOC. It is proved that the two SOH indicators and ambient temperature are both exponentially correlated, while the impacts of battery SOC on both R0 and Cd present a quadratic trend. Accordingly, the final SOH definition considering the disturbance of temperature and SOC is established. The maximum error is 2.301% at 40% SOC and 15°C.
The raw data supporting the conclusions of this article will be made available by the authors, without undue reservation.
Conceptualization, GS, XW, and HD; Methodology, GS, SC, HY, HZY, XW, and HD; Investigation, GS, and HY; Writing–Original Draft, GS, XW, and HD; Writing–Review and Editing, GS, XW, SC, HY, HZY, XW, and HD; Supervision, XW and HD.
This work is financially supported by the National Natural Science Foundation of China (NSFC, grant nos. U20A20310 and U1764256)
The authors declare that the research was conducted in the absence of any commercial or financial relationships that could be construed as a potential conflict of interest.
The Supplementary Material for this article can be found online at: https://www.frontiersin.org/articles/10.3389/fenrg.2021.690266/full#supplementary-material
Agubra, V., and Fergus, J. (2013). Lithium Ion Battery Anode Aging Mechanisms. Materials 6 (4), 1310–1325. doi:10.3390/ma6041310
Alwin, D. F., and Hauser, R. M. (1975). The Decomposition of Effects in Path Analysis. Am. Sociological Rev. 40 (1), 37–47. doi:10.2307/2094445
Basia, A., Simeu-Abazi, Z., Gascard, E., and Zwolinski, P. (2021). Review on State of Health Estimation Methodologies for Lithium-Ion Batteries in the Context of Circular Economy. CIRP J. Manufacturing Sci. Tech. 32, 517–528. doi:10.1016/j.cirpj.2021.02.004
Berecibar, M., Gandiaga, I., Villarreal, I., Omar, N., Van Mierlo, J., and Van den Bossche, P. (2016). Critical Review of State of Health Estimation Methods of Li-Ion Batteries for Real Applications. Renew. Sust. Energ. Rev. 56, 572–587. doi:10.1016/j.rser.2015.11.042
Bloom, I., Jansen, A. N., Abraham, D. P., Knuth, J., Jones, S. A., Battaglia, V. S., et al. (2005). Differential Voltage Analyses of High-Power, Lithium-Ion Cells. J. Power Sourc. 139 (1), 295–303. doi:10.1016/j.jpowsour.2004.07.021
Broussely, M., Biensan, P., Bonhomme, F., Blanchard, P., Herreyre, S., Nechev, K., et al. (2005). Main Aging Mechanisms in Li Ion Batteries. J. Power Sourc. 146 (1), 90–96. doi:10.1016/j.jpowsour.2005.03.172
Chang, M.-T., Lin, Y.-S., Ling, S.-H., Liang, S.-H., Lin, C.-H., and Chen, K.-C. (2014). Identification of the Parameters in Equivalent Circuit Model of Lithium-Ion Batteries. ECS Trans. 61 (27), 125–130. doi:10.1149/06127.0125ecst
Chen, S., Peng, X., Bao, N., and Garg, A. (2019). A Comprehensive Analysis and Optimization Process for an Integrated Liquid Cooling Plate for a Prismatic Lithium-Ion Battery Module. Appl. Therm. Eng. 156, 324–339. doi:10.1016/j.applthermaleng.2019.04.089
Chen, Z., Mi, C. C., Fu, Y., Xu, J., and Gong, X. (2013). Online Battery State of Health Estimation Based on Genetic Algorithm for Electric and Hybrid Vehicle Applications. J. Power Sourc. 240, 184–192. doi:10.1016/j.jpowsour.2013.03.158
Dai, H., Xu, T., Zhu, L., Wei, X., and Sun, Z. (2016). Adaptive Model Parameter Identification for Large Capacity Li-Ion Batteries on Separated Time Scales. Appl. Energ. 184, 119–131. doi:10.1016/j.apenergy.2016.10.020
Deng, Z., Yang, L., Cai, Y., Deng, H., and Sun, L. (2016). Online Available Capacity Prediction and State of Charge Estimation Based on Advanced Data-Driven Algorithms for Lithium Iron Phosphate Battery. Energy 112, 469–480. doi:10.1016/j.energy.2016.06.130
Galeotti, M., Cinà, L., Giammanco, C., Cordiner, S., and Di Carlo, A. (2015). Performance Analysis and SOH (State of Health) Evaluation of Lithium Polymer Batteries through Electrochemical Impedance Spectroscopy. Energy 89, 678–686. doi:10.1016/j.energy.2015.05.148
Gomez, J., Nelson, R., Kalu, E. E., Weatherspoon, M. H., and Zheng, J. P. (2011). Equivalent Circuit Model Parameters of a High-Power Li-Ion Battery: Thermal and State of Charge Effects. J. Power Sourc. 196 (10), 4826–4831. doi:10.1016/j.jpowsour.2010.12.107
Gu, W., Sun, Z., Wei, X., and Dai, H. (2014a). A Capacity Fading Model of Lithium-Ion Battery Cycle Life Based on the Kinetics of Side Reactions for Electric Vehicle Applications. Electrochimica Acta 133, 107–116. doi:10.1016/j.electacta.2014.03.186
Gu, W., Sun, Z., Wei, X., and Dai, H. (2014b). A New Method of Accelerated Life Testing Based on the Grey System Theory for a Model-Based Lithium-Ion Battery Life Evaluation System. J. Power Sourc. 267, 366–379. doi:10.1016/j.jpowsour.2014.05.103
Han, X., Ouyang, M., Lu, L., Li, J., Zheng, Y., and Li, Z. (2014). A Comparative Study of Commercial Lithium Ion Battery Cycle Life in Electrical Vehicle: Aging Mechanism Identification. J. Power Sourc. 251, 38–54. doi:10.1016/j.jpowsour.2013.11.029
Hua, Y., Cordoba-Arenas, A., Warner, N., and Rizzoni, G. (2015). A Multi Time-Scale State-Of-Charge and State-Of-Health Estimation Framework Using Nonlinear Predictive Filter for Lithium-Ion Battery Pack with Passive Balance Control. J. Power Sourc. 280, 293–312. doi:10.1016/j.jpowsour.2015.01.112
Jiang, B., Dai, H., Wei, X., and Xu, T. (2019). Joint Estimation of Lithium-Ion Battery State of Charge and Capacity within an Adaptive Variable Multi-Timescale Framework Considering Current Measurement Offset. Appl. Energ. 253, 113619. doi:10.1016/j.apenergy.2019.113619
Kim, I. L.-S. (2010). A Technique for Estimating the State of Health of Lithium Batteries through a Dual-Sliding-Mode Observer. IEEE Trans. Power Elect. 25 (4), 1013–1022. doi:10.1109/TPEL.2009.2034966
Li, W., Sengupta, N., Dechent, P., Howey, D., Annaswamy, A., and Sauer, D. U. (2021). Online Capacity Estimation of Lithium-Ion Batteries with Deep Long Short-Term Memory Networks. J. Power Sourc. 482, 228863. doi:10.1016/j.jpowsour.2020.228863
Li, Z., Lu, L., Ouyang, M., and Xiao, Y. (2011). Modeling the Capacity Degradation of LiFePO4/graphite Batteries Based on Stress Coupling Analysis. J. Power Sourc. 196 (22), 9757–9766. doi:10.1016/j.jpowsour.2011.07.080
Liu, J., and Chen, Z. (2019). Remaining Useful Life Prediction of Lithium-Ion Batteries Based on Health Indicator and Gaussian Process Regression Model. Ieee Access 7, 39474–39484. doi:10.1109/access.2019.2905740
Liu, K., Ashwin, T. R., Hu, X., Lucu, M., and Widanage, W. D. (2020a). An Evaluation Study of Different Modelling Techniques for Calendar Ageing Prediction of Lithium-Ion Batteries. Renew. Sust. Energ. Rev. 131, 110017. doi:10.1016/j.rser.2020.110017
Liu, K., Hu, X., Wei, Z., Li, Y., and Jiang, Y. (2019). Modified Gaussian Process Regression Models for Cyclic Capacity Prediction of Lithium-Ion Batteries. IEEE Trans. Transp. Electrific. 5 (4), 1225–1236. doi:10.1109/TTE.2019.2944802
Liu, K., Li, Y., Hu, X., Lucu, M., and Widanage, W. D. (2020b). Gaussian Process Regression with Automatic Relevance Determination Kernel for Calendar Aging Prediction of Lithium-Ion Batteries. IEEE Trans. Ind. Inf. 16 (6), 3767–3777. doi:10.1109/TII.2019.2941747
Nghiep, N., and Al, C. (2001). Predicting Housing Value: A Comparison of Multiple Regression Analysis and Artificial Neural Networks. J. real estate Res. 22 (3), 313–336. doi:10.1080/10835547.2001.12091068
Pan, H., Lü, Z., Wang, H., Wei, H., and Chen, L. (2018). Novel Battery State-Of-Health Online Estimation Method Using Multiple Health Indicators and an Extreme Learning Machine. Energy 160, 466–477. doi:10.1016/j.energy.2018.06.220
Park, E. S., Fitzpatrick, K., Das, S., and Avelar, R. (2021). Exploration of the Relationship Among Roadway Characteristics, Operating Speed, and Crashes for City Streets Using Path Analysis. Accid. Anal. Prev. 150, 105896. doi:10.1016/j.aap.2020.105896
Park, K., Choi, Y., Choi, W. J., Ryu, H.-Y., and Kim, H. (2020). LSTM-based Battery Remaining Useful Life Prediction with Multi-Channel Charging Profiles. Ieee Access 8, 20786–20798. doi:10.1109/access.2020.2968939
Ramadass, P., Haran, B., Gomadam, P. M., White, R., and Popov, B. N. (2004). Development of First Principles Capacity Fade Model for Li-Ion Cells. J. Electrochem. Soc. 151 (2), A196–A203. doi:10.1149/1.1634273
Remmlinger, J., Buchholz, M., Meiler, M., Bernreuter, P., and Dietmayer, K. (2011). State-of-health Monitoring of Lithium-Ion Batteries in Electric Vehicles by On-Board Internal Resistance Estimation. J. Power Sourc. 196 (12), 5357–5363. doi:10.1016/j.jpowsour.2010.08.035
Schmidt, C. L., and Skarstad, P. M. (1997). Development of an Equivalent-Circuit Model for the Lithium/iodine Battery. J. Power Sourc. 65 (1), 121–128. doi:10.1016/s0378-7753(96)02604-3
Stage, F. K., Carter, H. C., and Nora, A. (2004). Path Analysis: An Introduction and Analysis of a Decade of Research. J. Educ. Res. 98 (1), 5–13. doi:10.3200/JOER.98.1.5-13
Stolzenberg, R. M. (2004). “Multiple Regression Analysis,” in Handbook of Data Analysis. Editors M. Hardy, and A. Bryman (Thousand Oaks, CA: Sage Publications), 165–208.
Stroe, D. I., Swierczynski, M., Stan, A. I., Knap, V., Teodorescu, R., and Andreasen, S. J. (2014). “Diagnosis of Lithium-Ion Batteries State-Of-Health Based on Electrochemical Impedance Spectroscopy Technique,” in IEEE Energy Conversion Congress and Exposition (ECCE), Pittsburgh, PA, 4576–4582.
Sun, F., and Xiong, R. (2015). A Novel Dual-Scale Cell State-Of-Charge Estimation Approach for Series-Connected Battery Pack Used in Electric Vehicles. J. Power Sourc. 274, 582–594. doi:10.1016/j.jpowsour.2014.10.119
Takei, K., Seki, S., Mita, Y., Miyashiro, H., and Terada, N. (2011). “Investigations of Accelerated Life Evaluation Tests for High-Power Lithium-Ion Secondary Batteries for Plug-In Hybrid Electric Vehicles,” in Meeting Abstracts: The Electrochemical Society, Boston, MA, 1421.
Tang, X., Wang, Y., Zou, C., Yao, K., Xia, Y., and Gao, F. (2019). A Novel Framework for Lithium-Ion Battery Modeling Considering Uncertainties of Temperature and Aging. Energ. Convers. Manag. 180, 162–170. doi:10.1016/j.enconman.2018.10.082
Thomas, E. V., Bloom, I., Christophersen, J. P., and Battaglia, V. S. (2008). Statistical Methodology for Predicting the Life of Lithium-Ion Cells via Accelerated Degradation Testing. J. Power Sourc. 184 (1), 312–317. doi:10.1016/j.jpowsour.2008.06.017
Wang, J., Liu, P., Hicks-Garner, J., Sherman, E., Soukiazian, S., Verbrugge, M., et al. (2011). Cycle-life Model for Graphite-LiFePO4 Cells. J. Power Sourc. 196 (8), 3942–3948. doi:10.1016/j.jpowsour.2010.11.134
Wang, T., Pei, L., Wang, T., Lu, R., and Zhu, C. (2015). On-Board State-Of-Health Estimation at a Wide Ambient Temperature Range in Lithium-Ion Batteries. Energies 8 (8), 8467–8481. doi:10.3390/en8088467
Wang, X., Wei, X., and Dai, H. (2019). Estimation of State of Health of Lithium-Ion Batteries Based on Charge Transfer Resistance Considering Different Temperature and State of Charge. J. Energ. Storage 21, 618–631. doi:10.1016/j.est.2018.11.020
Wang, X., Wei, X., Zhu, J., Dai, H., Zheng, Y., Xu, X., et al. (2021). A Review of Modeling, Acquisition, and Application of Lithium-Ion Battery Impedance for Onboard Battery Management. eTransportation 7, 100093. doi:10.1016/j.etran.2020.100093
Yun, Z., and Qin, W. (2020). Remaining Useful Life Estimation of Lithium-Ion Batteries Based on Optimal Time Series Health Indicator. Ieee Access 8, 55447–55461. doi:10.1109/access.2020.2981947
Zenati, A., Desprez, P., Razik, H., and Rael, S. (2012). “A Methodology to Assess the State of Health of Lithium-Ion Batteries Based on the Battery's Parameters and a Fuzzy Logic System,” in IEEE International Electric Vehicle Conference, Greenville, SC, 1–6.
Zheng, X., and Fang, H. (2015). An Integrated Unscented Kalman Filter and Relevance Vector Regression Approach for Lithium-Ion Battery Remaining Useful Life and Short-Term Capacity Prediction. Reliability Eng. Syst. Saf. 144, 74–82. doi:10.1016/j.ress.2015.07.013
Zhou, Y., Huang, M., Chen, Y., and Tao, Y. (2016). A Novel Health Indicator for On-Line Lithium-Ion Batteries Remaining Useful Life Prediction. J. Power Sourc. 321, 1–10. doi:10.1016/j.jpowsour.2016.04.119
SOH State of health
SOC State of charge
EVs Electric vehicles
ECM Equivalent circuit model
LFP Lithium iron phosphate
NCA Nickel–cobalt–aluminum
RPT Reference performance test
NEDC New European Driving Cycle
UDDS Urban Dynamometer Driving Schedule
OCV Open circuit voltage
RLSM Recursive least square method
PCA Principal component analysis
CA Correlation analysis
MSRA Multiple stepwise regression analysis
PA Path analysis
BMS Battery management system
R0 Ohmic resistance (Ω)
Rp Polarization resistance (Ω)
Rd Diffusion resistance (Ω)
Cp Polarization capacitance (F)
Cd Diffusion capacitance (F)
E0 OCV of the cell (V)
I Load current (A)
U Terminal voltage (V)
Et Response voltage (V)
ts The sampling time (s)
y Dependent variable
T Absolute temperature (K)
Tref Reference temperature (298.15K).
Keywords: lithium-ion battery, state of health, indicator, equivalent circuit model, statistical analysis
Citation: Shi G, Chen S, Yuan H, You H, Wang X, Dai H and Wei X (2021) Determination of Optimal Indicators Based on Statistical Analysis for the State of Health Estimation of a Lithium-Ion Battery. Front. Energy Res. 9:690266. doi: 10.3389/fenrg.2021.690266
Received: 02 April 2021; Accepted: 17 May 2021;
Published: 16 June 2021.
Edited by:
Caiping Zhang, Beijing Jiaotong University, ChinaReviewed by:
Jinpeng Tian, Beijing Institute of Technology, ChinaCopyright © 2021 Shi, Chen, Yuan, You, Wang, Dai and Wei. This is an open-access article distributed under the terms of the Creative Commons Attribution License (CC BY). The use, distribution or reproduction in other forums is permitted, provided the original author(s) and the copyright owner(s) are credited and that the original publication in this journal is cited, in accordance with accepted academic practice. No use, distribution or reproduction is permitted which does not comply with these terms.
*Correspondence: Xueyuan Wang, N3dhbmd4dWV5dWFuQHRvbmdqaS5lZHUuY24=; Haifeng Dai, dG9uZ2ppZGFpQHRvbmdqaS5lZHUuY24=
Disclaimer: All claims expressed in this article are solely those of the authors and do not necessarily represent those of their affiliated organizations, or those of the publisher, the editors and the reviewers. Any product that may be evaluated in this article or claim that may be made by its manufacturer is not guaranteed or endorsed by the publisher.
Research integrity at Frontiers
Learn more about the work of our research integrity team to safeguard the quality of each article we publish.