 Bo Zeng1
 Bo Sun
- 1State Key Laboratory of Alternate Electrical Power System with Renewable Energy Sources, North China Electric Power University, Beijing, China
- 2School of Economics and Management, North China Electric Power University, Baoding, China
- 3Tsinghua-Berkeley Shenzhen Institute, Tsinghua University, Shenzhen, China
- 4Economic and Electrical Research Institute, Shanxi Electrical Power Company of SGCC, Taiyuan, China
The proliferation of plug-in electric vehicles has led to increased public charging infrastructure in cities worldwide. Grid-connected parking lot spaces are the most common charging option due to their technological readiness and convenience of adoption. Since the batteries aggregated by parking lots can be regarded as virtual energy storage, grid-connected parking lots are expected to provide many benefits to the urban distribution grid. This paper proposes a comprehensive methodological framework to evaluate the potential benefits and costs of utilizing grid-connected parking lot infrastructures to promote energy supply sustainability in future power distribution grids. Capacity-value-based and cost-effectiveness indexes are developed, which quantify the potential contribution of parking lots to power supply reliability and the associated economic implications. To realistically describe the available generation capacity of parking lot resources, a comprehensive model is presented, which explicitly considers the impact of external stimuli (incentive rates) on the behavioral patterns of lot users. Vehicle user responsiveness to incentive grades is derived from social field surveys. To conduct the evaluation, a hybrid algorithm based on Monte Carlo simulations is employed. The proposed methodology is illustrated on a real distribution grid in Beijing. The results confirm the effectiveness of our proposed approach and support practical policy suggestions.
Introduction
Worsening environmental problems are increasingly promoting the transformation of the global energy system. Transportation in the current system accounts for a large proportion of the energy consumption sector, so transportation plays a vital role in achieving the sustainable development of the energy system. The electrification of transportation needs can effectively solve the problem of dependence on fossil fuels and exhaust emissions. Given this, in the past ten years, the electric vehicle industry has achieved remarkable development worldwide (Du et al., 2019).
In future smart cities, the information and intelligence of the power supply system are necessary requirements, and the sustainability of the energy supply is also an essential aspect. Therefore, an urban power supply system is needed to provide users with reliable and stable power services (Xu and Chung, 2016). At present, newly added power generation units ensure that the sustainable power supply target is reached. These redundant power generating units can provide end-users with the required backup power in an emergency (Silva et al., 2018). However, a redundant power generation unit added to a system requires additional investment and remains in a hot standby state for a long time after installation. The overall utilization rate is shallow, so plug-in electric vehicles (PEVs) are expected to play an important role. Since most family cars are parked more than 95% of each day (Heydarian-Forushani et al., 2016), a grid-connected parking lot (GPL) can act as a controllable load during charging or as a virtual energy storage unit during discharging. In future smart cities, different types of GPLs could be used to meet the energy needs of PEVs (Moradijoz et al., 2020). Intelligent charging piles will play a vital role as connection devices between electric vehicles and the grid. GPLs can obtain the battery status of electric vehicles in real time through intelligent charging piles. Using electric vehicle batteries to absorb new energy is a promising research direction for smart grids (Farzin and Monadi, 2019). There have been some studies on the impact of vehicle-to-grid (V2G) systems on the power grid by electric vehicles as a movable load or energy storage unit. Utilizing the energy stored in the batteries of electric cars increases the ability of the power system to resist natural disasters by participating in V2G systems and improving the resilience of the power system (Momen et al., 2020). When a power supply or feeder fails, the GPL is used as the power supply of the distribution network, which can increase the reliability of the distribution network and reduce the failure time of the distribution network (Guner and Ozdemir, 2020). Participation in V2G systems can shift the charging demand of PEVs from peak hours to off-peak hours, which can significantly increase the economic and environmental benefits of power systems (Onishi et al., 2020). In distribution system planning, an investment in system expansion can be deferred by exploiting the storage capacity of the GPL (Al-Rubaye et al., 2019). By controlling the active power injected or released by the GPL to achieve stable voltage fluctuation, the reliability and stability of the power grid can be improved (Singh et al., 2018).
However, the aforementioned research does not address the impact of GPLs on the overall sustainability of smart cities. To fill this gap, some scholars have studied this issue. Sequential Monte Carlo simulation technology is used to determine the sufficiency of the power supply when participating in V2G through GPLs under different urban power system (UPS) operation modes in Xu and Chung (2016). When considering GPL participation in auxiliary services, random methods are used to determine the impact of GPLs on UPS reliability (Mohammadi-Hosseininejad et al., 2018). A GPL is used as a backup unit to restore power to a faulty area or as a storage unit to address downstream blockages of feeders, thereby helping to restore power. There is also a framework based on nonsequential Monte Carlo simulations that can assess the sustainability of GPLs and consider the role of renewable energy (Farzin et al., 2017). This work fully captures the volatility related to electric vehicles and renewable energy and probabilistically simulates the V2G capability of providing grid-to-vehicle (G2V) resources during an emergency for research purposes. The use of PEVs can increase the flexibility of a power system, and this effect is related to the popularity of PEVs (Bozic and Pantos, 2015). There is also an article that considers the total charging load of electric vehicles in a GPL and the travel mode of electric vehicles and combines the charging load and system load of electric vehicles to evaluate the reliability of the system (Irshad et al., 2020). Some researchers have also considered the uncertainty of incentive policies regarding the charging behavior of private car owners and their impact on public transportation plans (Zeng et al., 2021a). Additionally, considering the charging decisions of PEV users at the bottom layer of the two-tier model can effectively capture the uncertainty and self-interested behavior of electric vehicle owners (Zeng et al., 2020a). The results show that considering uncertainty in electric vehicles could have a significant impact on the results of the final evaluation. Similarly, a cost/value evaluation framework is proposed in Neyestani et al. (2015), and other improvements are made in Shaukat et al. (2018).
The above researches show that GPL is an emerging element of future smart cities and a new choice to enhance the sustainable operation of future urban power grids. However, none of them consider the potential economic value of GPLs. From a system perspective, due to the use of a two-way charger, a GPL can be regarded as a virtual energy storage unit, which can provide capacity support for the grid by extracting energy from PEV batteries in an emergency. Therefore, the GPL responds to potential emergencies (such as generator failures and fluctuations in load demand) by improving the operating level (generation capacity) of the power system and provides important assistance for the sustainability of energy services. Compared with traditional expansion-based solutions, this solution does not require additional asset investment, reduces the risk of load loss, and has the opportunity to achieve better urban energy system sustainability performance (in economic and environmental terms).
However, the above-mentioned works provide an incomplete assessment of the impact of GPLs in future smart city power supply systems and do not involve the economic impact of GPLs on the power grid. The economy is the most intuitive manifestation of the impact of GPLs on the power grid. Therefore, this paper proposes a new evaluation framework based on capacity value, which uses GPLs as virtual energy storage to evaluate the sustainable power supply capability of GPLs for future smart cities. The capacity value is used to evaluate the ability of a specific power generation resource to contribute sufficient power (Keane et al., 2011). However, in this research, we extend the concept of capability value to the context of GPLs. The goal is to quantify the potential benefits of GPLs in increasing the reliability and sustainability of power supplies and then to quantify the economic value that GPLs can provide in virtual energy storage. To achieve this goal, this article develops a new model to characterize a GPL’s available generation capacity and considers the role of critical parameters in the operation process. Unlike existing works, in our research, we propose a framework in which a GPL is regarded as a virtual energy storage unit to evaluate the capacity power and the economy of the energy storage device.
The main contributions and innovations of this paper are as follows:
(1) A comprehensive methodological framework is proposed to quantify the potential costs and benefits of utilizing GPLs as virtual energy storage to improve the sustainability of urban distribution systems.
(2) This study creatively associates capacity value indicators with economic indicators, which has reference significance for the planning of GPLs in future smart city contexts.
(3) This study puts forward corresponding policy recommendations based on the results of case studies of GPLs.
The rest of this paper is organized as follows: first, the capacity value metrics defined for GPLs is introduced in Section “Capacity Value Metrics,” and then the method for estimating the available GPL generation capacity is presented in Section “Modeling of GPLs.” Section “Economic Analysis” presents the economic analysis model of GPLs. Section “Evaluation Algorithm” provides the algorithm framework used to perform the capacity value calculation. Section “Case Study” presents case studies and a discussion about the evaluation results. Finally, the conclusions of this study are drawn in Section “Conclusion.”
Capacity Value Metrics
The capacity value is initially used to quantify the capacity of generator sets (Keane et al., 2011). This article regards a GPL as a virtual energy storage unit similar to a power generation resource. This is because PEVs use power batteries as the source and can participate in V2G through charging piles, which can be regarded as virtual energy storage units, and when the power grid needs them, the energy in PEV batteries can be injected back to the power grid. Therefore, the concept of capacity value can be reasonably extended to the evaluation of GPLs.
In fact, in existing research, there are two commonly used evaluation indicators, the equivalent firm capacity and the equivalent conventional capacity (ECC). These two indicators can operate well in a wide range of applications (Keane et al., 2011; Dent et al., 2015; Ding and Xu, 2017; Zeng et al.,2020a,b). To keep the description uniform, in this article, the same method is used to present the capacity value. A detailed introduction is given below.
In this study, the definition of the equivalent firm capacity is the generator capacity that can be replaced by GPL resources, where the forced outage rate (FOR) of the generator is 0, which means that the generator is completely reliable. First, let the GPL participate in V2G and calculate the UPS (with V2G) reliability index E1 in this state, which represents the UPS reliability of the GPL participating in V2G; then calculate the UPS (without V2G) reliability index E2 of the GPL not participating in V2G. By comparing the reliability index, it can be judged whether GPL has the ability to increase UPS reliability when participating in V2G. If V2G can improve the reliability of UPS, calculate the reliability of this system by gradually adding the new generator capacity of the UPS (without V2G) until it is the same as the reliability index of the UPS (with V2G) system. Then, the generator capacity value that can be replaced by GPL can be determined by the increased capacity value.
The concept of the ECC metric is defined according to the principles of the equivalent firm capacity metric. However, a “real” conventional generator, which is different from the equivalent firm capacity, is adopted by the ECC, and the specific reliability characteristics for capacity value estimation are possessed by the ECC.
From the above, the mathematical expression of the ECC is as follows:
Where is the UPS reliability index concerning the GPL’s V2G. In this paper, the well-known expected energy not supplied (EENS) (Zeng et al.,2020a,b) is adopted and FOR is non-zero. Then calculate the reliability index of the UPS with GPL not participating in V2G, the formula is as follows:
where CE indicates the installed capacity of the generator unit. To estimate the ECC, CE can be adjusted so that the EENS of the system will reach the same level as that of the system which GPL participating in V2G, . Finally, the result for CE tends to stabilize; the value of CE is considered the ECC of the GPL here.
Modeling of GPLs
The distribution network studied in this paper includes transformers, transmission lines, renewable energy units, loads, and GPLs. For renewable energy power generation (such as wind or solar energy), the power output depends on weather conditions, so these generator sets cannot guarantee stable output power. In reliability studies, the impact of uncertainties in the renewable energy supply can be represented by using a proper probability distribution function (PDF). The impact of these uncertainties can be appropriately considered and reflected in our developed evaluation framework by using the Monte Carlo simulation method, which is presented in detail in Section “Evaluation Algorithm.” Regarding transformers, this paper uses a Monte Carlo model to represent the normal/fault state of the transformer in actual operation. It is also assumed that the available power from the grid considering the installed capacity of the distribution transformer obeys a uniform distribution, which is consistent with Zeng et al. (2020a). Additionally, it is assumed that the charging pile of the GPL is equipped with a bilateral charger and the GPL operator can automatically and remotely obtain all the necessary information of the PEV user (Yilmaz and Krein, 2013). Furthermore, it has been assumed that the GPL is owned and operated by a private entity, which is independent of the power grid. The GPL owner has independent economic revenues and makes profits from both providing recharging service to PEV users and providing flexibility (capacity support) to the grid.
To express the operating characteristics of the GPL, this paper proposes a comprehensive modeling framework, as described below.
Modeling of Bilateral Chargers
The available capacity of a GPL depends on the hardware of its charging equipment. During operation, if there is no mechanical failure, a single bilateral charger can provide any required output power within its rated discharge capacity; otherwise, its output power is 0.
Therefore, considering the faulty operation status of the bilateral charger and the number of installations in the GPL, the maximum power output that the PEV GPL can provide in period t can be expressed as:
where , ΩCP and are the maximum rated power of the GPL at time t, the collection of all bilateral chargers of the GPL, and the rated discharge rate of the bilateral charger. Additionally, is a 0/1 variable that represents the availability of the k-th bilateral charger at time t. During operation, if the charger is working under the normal state, the value of β would be assigned to unity; otherwise, it would be set to zero. In practice, since “whether the charging pile is working in the normal or failure state” is a random event, hence the value of β is an uncertain variable. In the evaluation, the value of β is determined by using a sampling simulation procedure presented in Section “Evaluation Algorithm.”
Modeling of PEV Behaviors
In this study, we characterize the behaviors of PEV users through three characteristics, as shown in Figure 1, namely, traffic uptake, energy demand, and customer willingness. The traffic uptake includes the arrival time and departure time. The energy demand includes the initial Soc and target Soc. The customer willingness refers to the incentive rate. These three parts are mutually independent and can be superimposed, and together they define the characteristics of PEV behaviors.
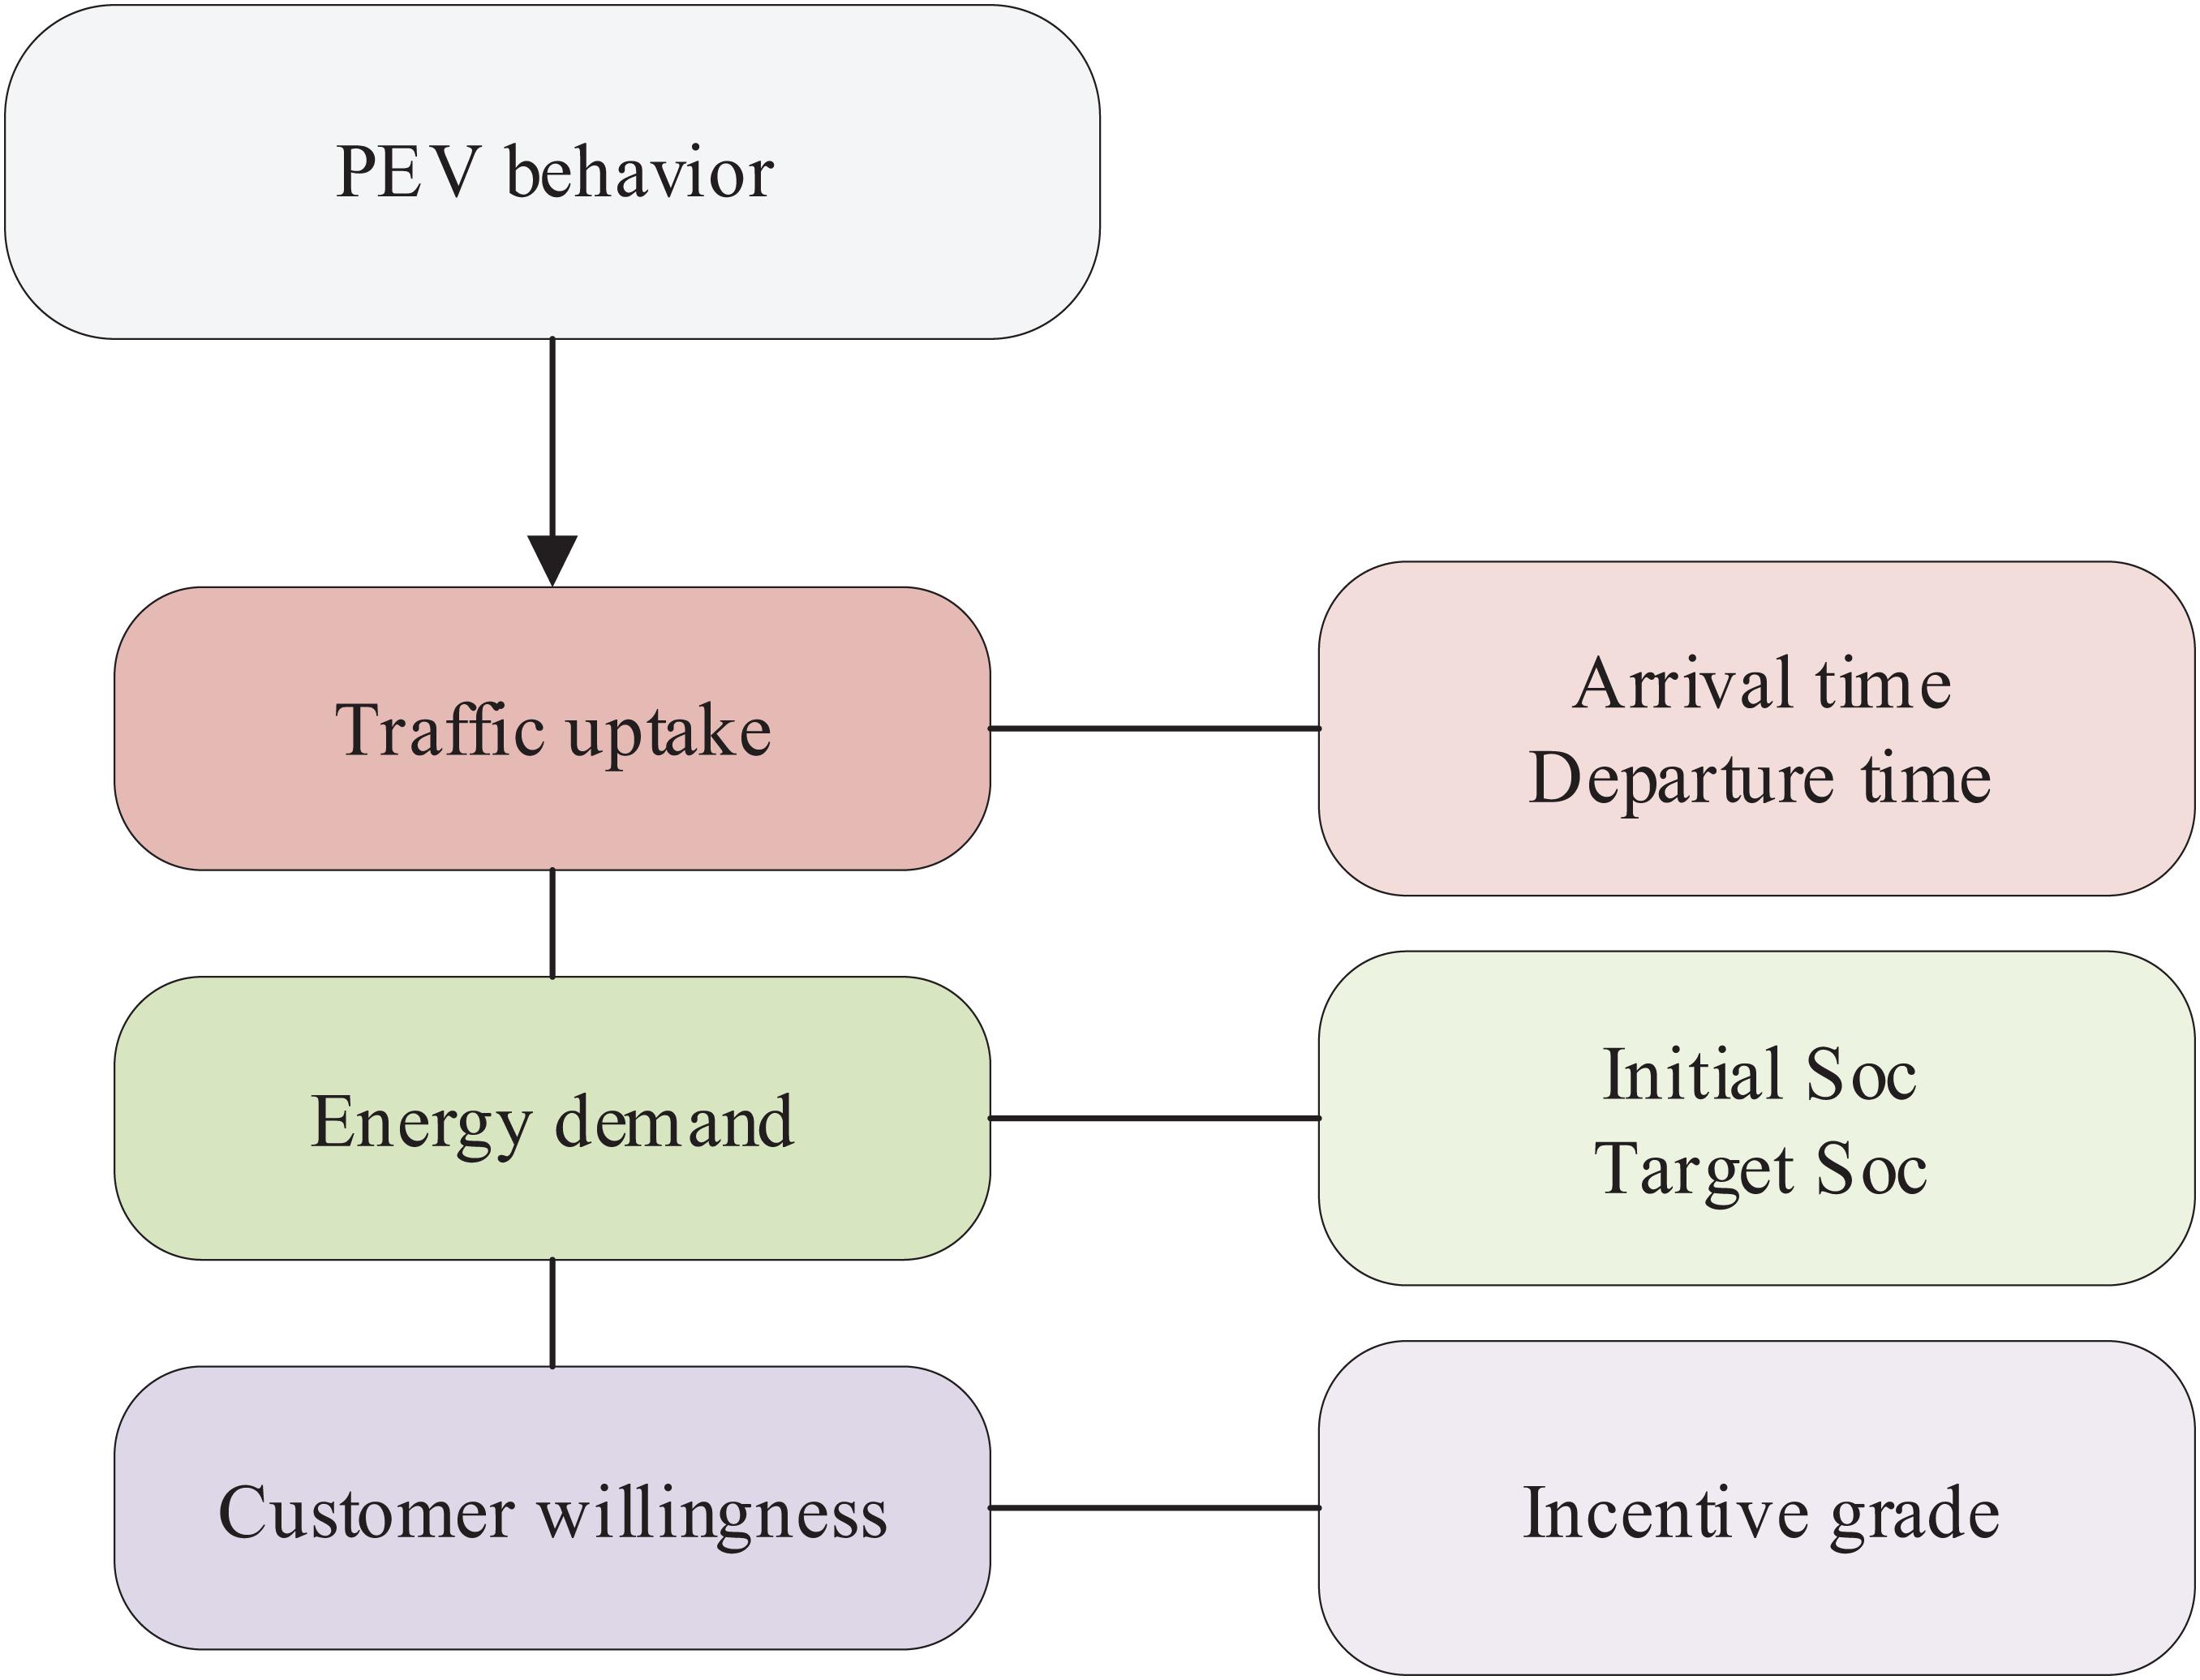
Figure 1. Illustration of PEV behavior model.
To model the uncertainties of PEV behavior, truncated Gaussian distributions are widely employed for arrival and departure times and the arrival Soc (Shafie-Khah et al., 2015). This paper uses a Gaussian distribution to simulate the arrival departure times of electric vehicles and the Soc of arrival (Shafie-Khah et al., 2015). The relevant data are in Table 1.
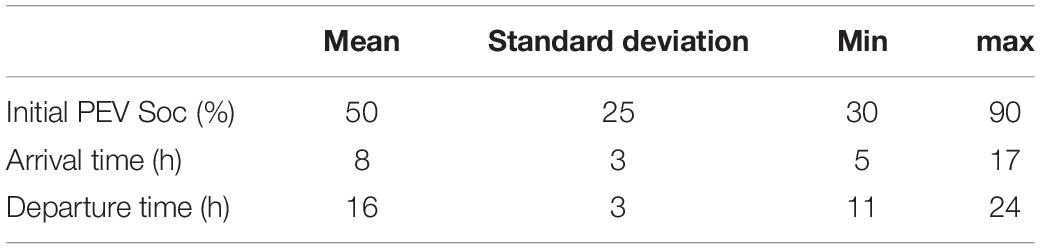
Table 1. Data of electric vehicles.
Initial Soc
The initial Soc of the PEVs when individuals arrive at the GPLs can be described by the following PDF (Shafie-Khah et al., 2015):
where , μSoc and σSoc, SocPEV,min and SocPEV,max are the battery power (%) when the n-th electric vehicle reaches the GPL, the mean and variance of the random variables of the initial Soc of the PEV, and the lower and upper limit of the value area, respectively.
Arrival Time
The time needed for the PEV users to reach the GPL can be represented by the following PDF (Shafie-Khah et al., 2015):
where , μAr, σAr, tAr,min and tAr,max are the arrival time of the n-th PEV, the mean and variance of the random variables of the initial arrival time of the PEVs, and the lower and upper limits of the area of .
Departure Time
The time when a PEV user leaves the GPL can be represented by the following PDF (Shafie-Khah et al., 2015):
where , μDe, σDe, tDe,min, tDe,max and Max{tDe,min,tAr} are the time when the first PEV leaves, the mean and variance of the random variables of the initial arrival time of the PEVs, the lower and upper limits of the range of , and the maximum of the time at which the PEV arrives at the GPL and the time it leaves.
Participation Rate of PEV Users
Plug-in electric vehicle users have two ways to provide backup for the power grid: load reduction and V2G. The willingness of a PEV user will directly affect the user’s participation, and the user’s decision to participate in V2G is related to the GPL’s incentive grade. We can simply assume that the GPL charges a certain service fee. When the incentive grade is higher, users will have a greater willingness to participate in V2G. According to the elastic relationship between electric vehicle user participation and price compensation, the participation of electric vehicle users in the V2G market in a single electricity sales scenario is a concave function of the power company’s compensation price. Finally, as the compensation increases, the user participation rate gradually approaches.
In this study, due to the lack of statistical data on PEV customer preferences, we conducted a field survey. We sent 300 questionnaires to selected Beijing PEV owners to investigate the users’ willingness to participate in load shedding and V2G under different incentive levels. Taking a single price for the electricity sold by the grid as an example, the compensation prices are ¥1.0, 1.25, 1.5, 1.75, and 2.0 per kWh. We further processed the questionnaire to determine its accuracy. The 150 questionnaires were first analyzed, and then the sample size was gradually increased in intervals of 25; then, the error between the participation degrees after 25 questionnaires and the previous statistical results was determined. The difference between the last a pair of result for questionnaire data is less than 1%, so it is concluded that these statistics are credible. The statistical error results of the data are shown in Table 2:
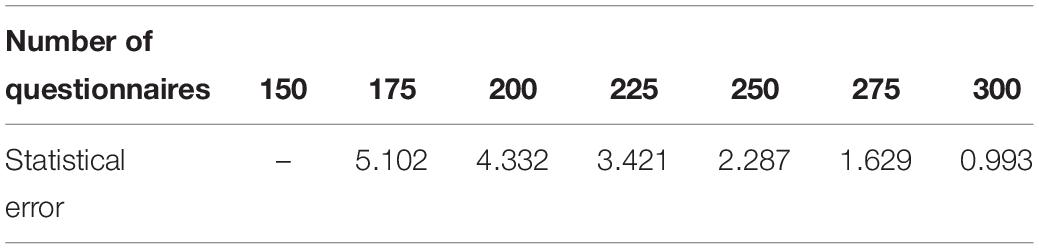
Table 2. Statistical error of the questionnaire.
Figure 2 shows the relationship between user participation willingness and the compensation price, including load reduction willingness and V2G willingness. The abscissa in the figure represents the unit electricity compensation price when the grid purchases electricity from users. As seen from the figure, as the compensation continues to increase, user participation continues to increase. Considering that battery discharge has a great impact on users, V2G needs a high price incentive.
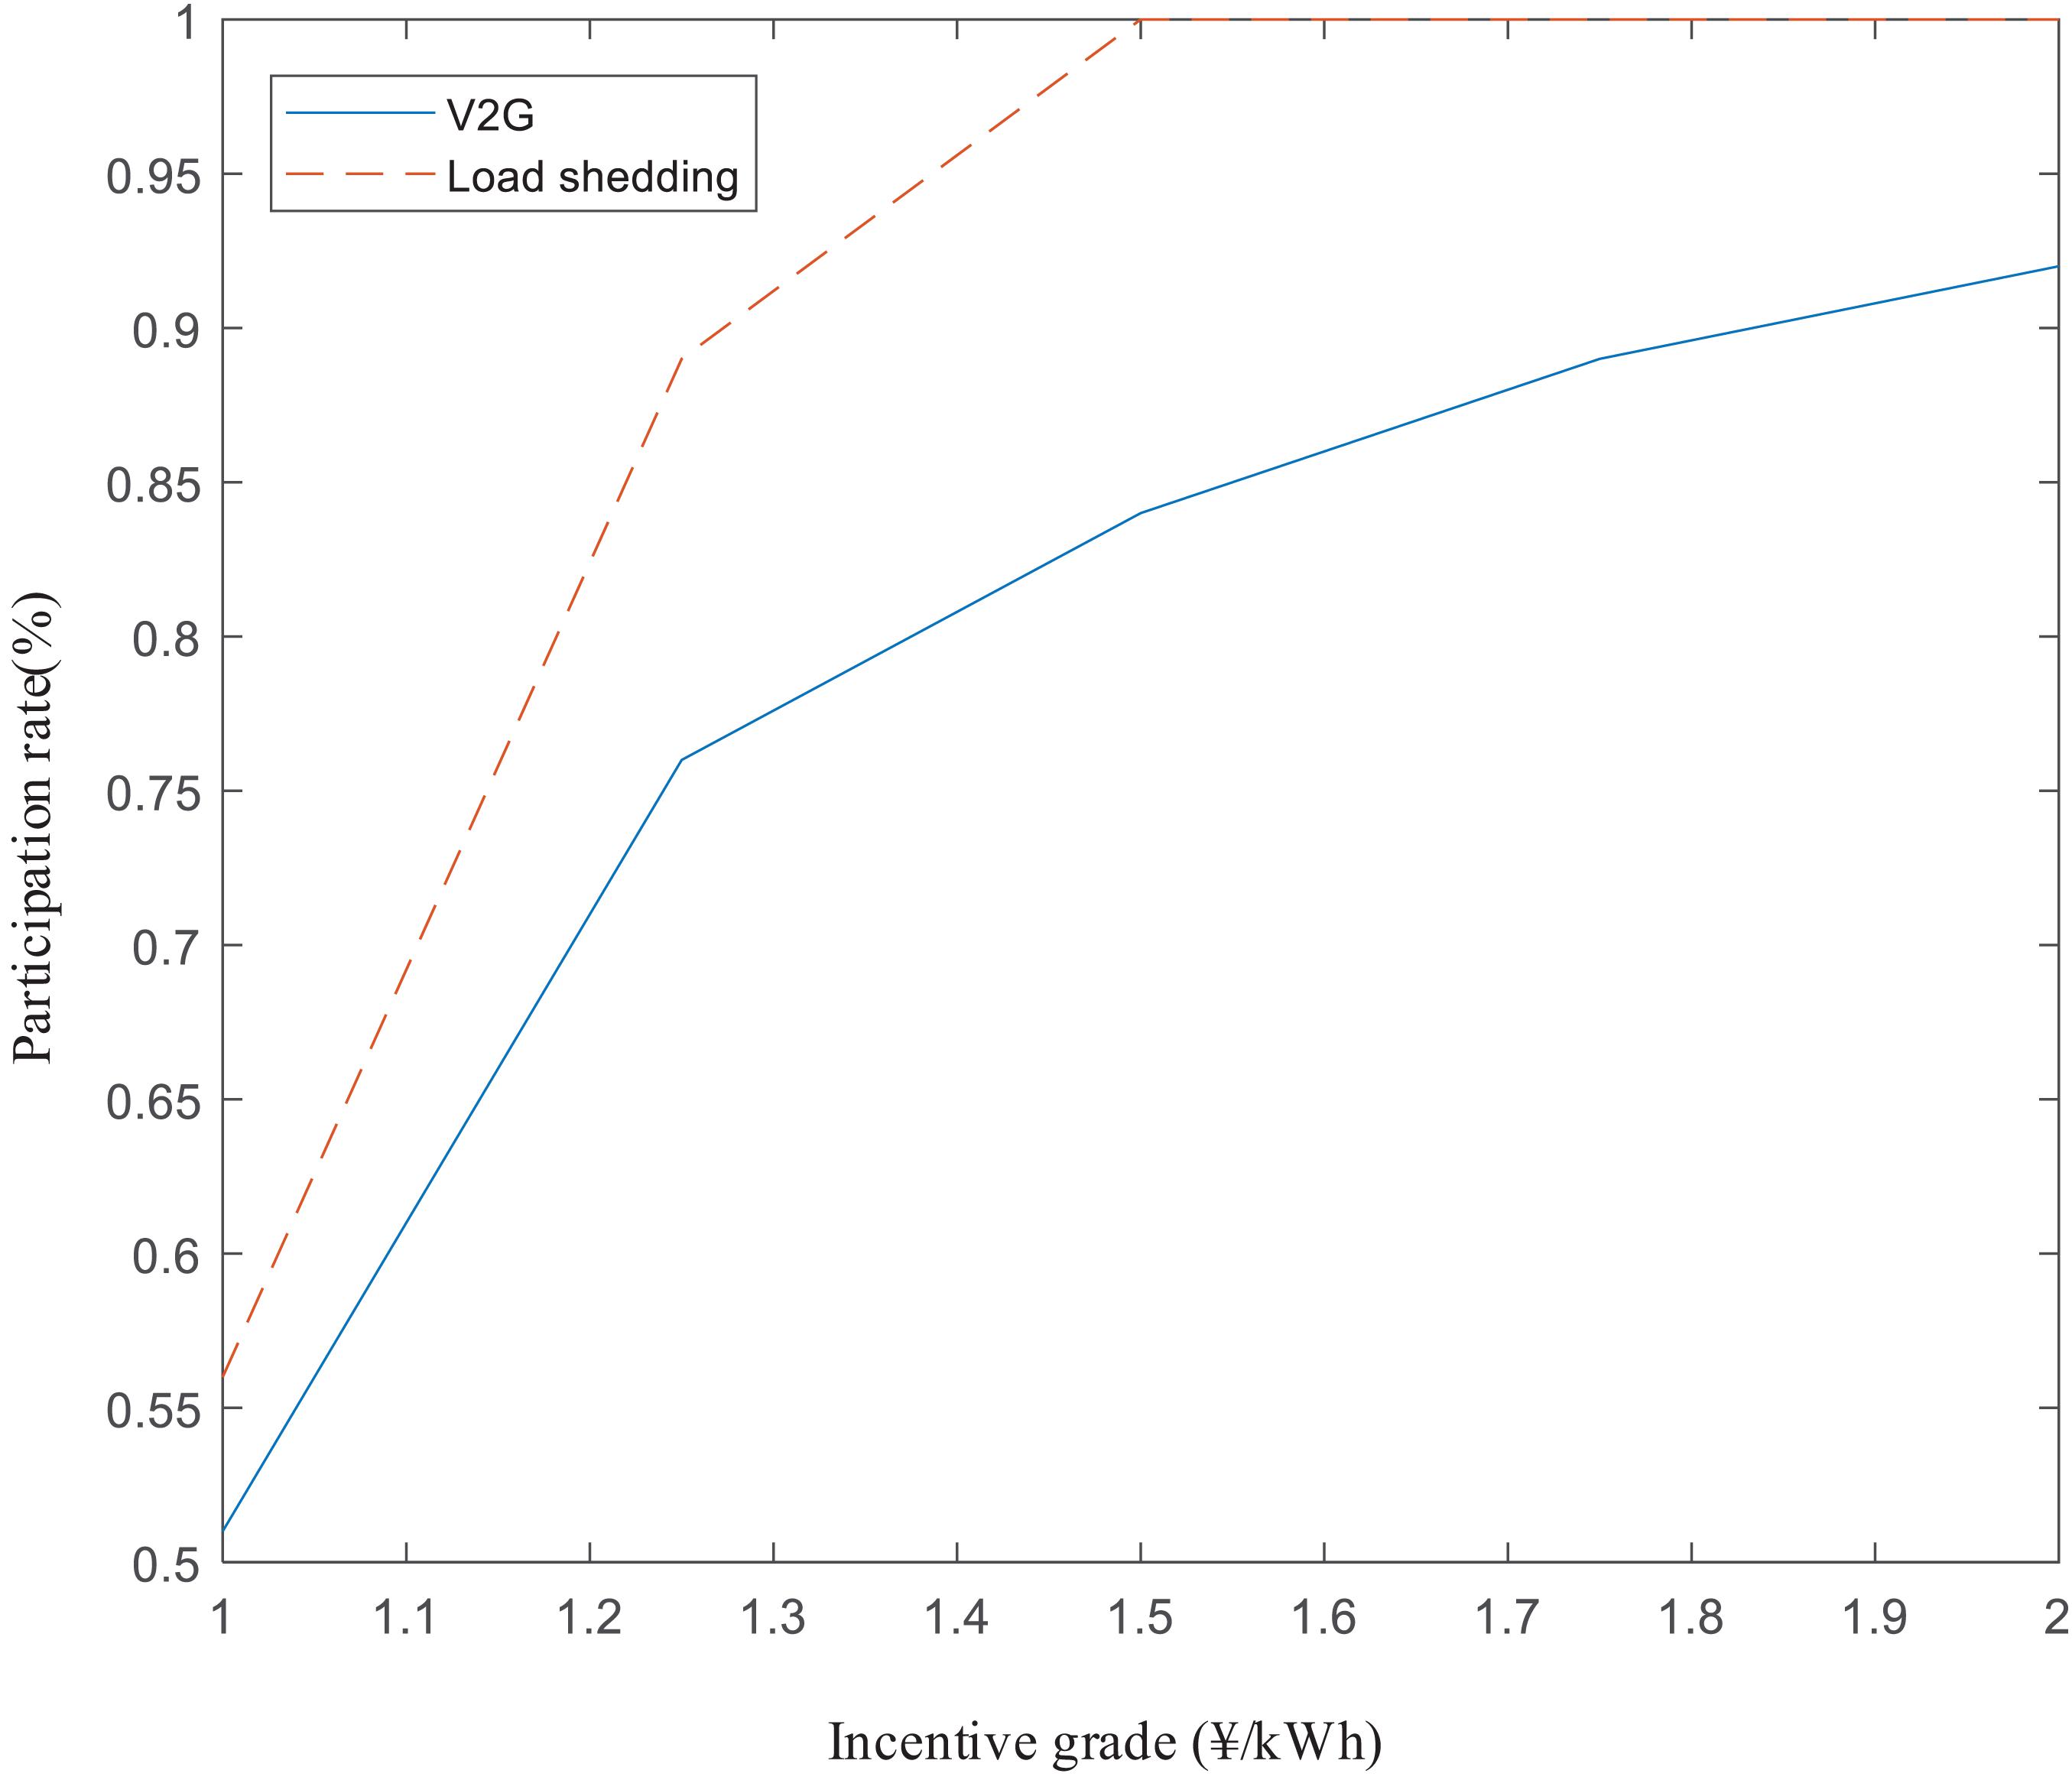
Figure 2. Participation rates vs. incentive rates.
In actual situations, different incentive grades produce different degrees of participation, so this article will analyze and compare different situations below.
Calculation of a GPL’s Capacity for V2G Participation
According to the above model, at time t, the available capacity of the GPL is expressed as follows:
where is the total available capacity of the GPL and is a 0/1 variable indicating whether the n-th electric vehicle participates in V2G during period t. If it does, 1; otherwise, 0. Eqs. (3.5) shows that the available capacity of the GPL is the total capacity of the PEVs participating in the V2G project.
In practice, the value of depends on the Soc of the PEV battery (Soc > 90%), the participation of PEV users, and the operating strategy of the GPL operator. Therefore, it can be written in a decomposed form as follows:
where and are 0/1 variables that indicate whether the PEV participates in the V2G project and whether the GPL operator implements the V2G project, respectively. The method used to determine and is introduced below.
According to Eq. (3.5), for PEV users, vehicle participation in V2G has the following two prerequisites: (1) The PEV is in the GPL and the Soc of the PEV battery > 90%; (2) The individual agrees to participate in the V2G project. Therefore, the calculation of in Eqs. (3.6) is as follows: through Monte Carlo simulation of the willing behavior of a PEV user under the determined participation degree, the generated user’s willingness is .
In this study, the Monte Carlo simulation method is used to simulate the willing behavior of a PEV user under the determined participation degree. The generated user willingness is in terms of and , which are all 0/1 variables that indicate whether the Soc of the n-th PEV battery is > 90% and whether the PEV user is willing to participate in V2G, respectively. In addition, is obtained by the following formula:
where and are the sample values obtained from Eqs. (3.3) and (3.4), respectively, and is the time needed to charge the kth car to the target Soc.
On the other hand, the available capacity of the GPL also depends on the operator’s operating plan, which is represented by the variable in Eq. (3.10). It is judged whether the GPL needs to participate in V2G at time t, and the judgment standard is the electricity price signal given by the grid. In the regular operation of the power grid, the GPL exists as a load unit to charge the electric vehicle to the target state (Soc = 90%). When the grid fails, the GPL will be given a higher electricity price in order to attract the GPL to participate in the V2G. The GPL is used as an energy storage device to support grid electricity. Therefore, while improving the reliability of the power grid, the investment cost and the operation and maintenance cost of the power grid for energy storage equipment are avoided due to the role of the GPL as virtual energy storage, thereby increasing the economy of the power grid.
Based on the operating strategy of the GPL operator, in Eq. (3.6) can be expressed as:
where ωV2G and ωPay are the electricity price when the GPL participates in V2G and the marginal price of deciding V2G whether the GPL participates. Equation (3.10) shows that from the perspective of the PEV GPL operator, the GPL will participate in V2G only if the price of electricity purchased by the grid from the GPL is larger than ωPay.
In summary, combining Eqs. (3.5) - (3.10), the total available capacity of the GPL for participating in V2G at each time can be obtained.
Economic Analysis
Without increasing the installed capacity of power generation, the current urban energy system mainly improves its flexibility and reliability by configuring energy storage equipment. The cost of energy storage equipment is mainly composed of investment and maintenance costs. Compared with energy storage equipment, when a GPL is used as virtual energy storage through participation in V2G, although there are corresponding scheduling costs, there are no investment, operation or maintenance costs. Therefore, theoretically speaking, it is more economical to increase the system reliability through GPL participation in V2G than to build new energy storage equipment. In this section, the investment, operation, and maintenance costs of energy storage equipment minus the cost of calling GPLs to participate in V2G dispatch are used as economic indicators to evaluate the economic benefits of GPLs. Lithium batteries are more suitable than other batteries for installation in urban centers due to their small size and simple operation. Therefore, this article uses lithium batteries as energy storage devices to analyze economic indicators. Since the service life of lithium batteries is 10 years, the cost of the energy storage equipment must be shared every year according to its investment, operation, and maintenance costs (Zaisen, 2018).
Therefore, the total economic function of the power grid is:
where SP,E represents the energy storage investment cost, Sm represents the energy storage operating cost, and EV2G represents the cost of the power grid when parking lots participate in V2G.
The energy storage investment cost allocated each year can be expressed as follows:
where CP is the power cost of the energy storage device, PSt is the power of the energy storage device, CE is the capacity cost of the energy storage device, and ESt is the capacity of the energy storage device. CP 2000 ¥/kW, and CE 1500 ¥/kWh (Zaisen, 2018).
According to engineering requirements, different battery device types are selected. Due to different production processes and the production of raw materials, there is a large difference in the costs of energy storage device capacity.
The annual operating cost of the energy storage system is mainly determined by the scale of the energy storage system, and it is expressed as follows:
where Cm represents the annual operation and maintenance cost per unit capacity. In this study, we assume that Cm 0.05 ¥/kWh (Zaisen, 2018).
The cost that the grid needs to pay when parking lots participate in V2G is as follows:
where is the incentive reward offered for GPL owners; is the V2G power provided by GPLs in time-period t, and EV2G is the energy in one year during operation for which the grid needs to pay subsidies to the GPL owner.
Evaluation Algorithm
In this section, the algorithm used for evaluating the benefits/costs of utilizing GPLs as virtual energy storage to promote the sustainability of distribution systems is described based on the metrics in Section “Capacity Value Metrics” and the system models described in Section “Modeling of GPLs and Economic Analysis.”
By analyzing and comparing the UPS reliability level depending on whether the GPL participates in V2G, the capacity value of the GPL can be estimated. This study uses a comprehensive evaluation algorithm based on the sequential Monte Carlo simulation method. The following presents a detailed description about the main steps of our evaluation algorithm. The flowchart is shown in Figure 3.
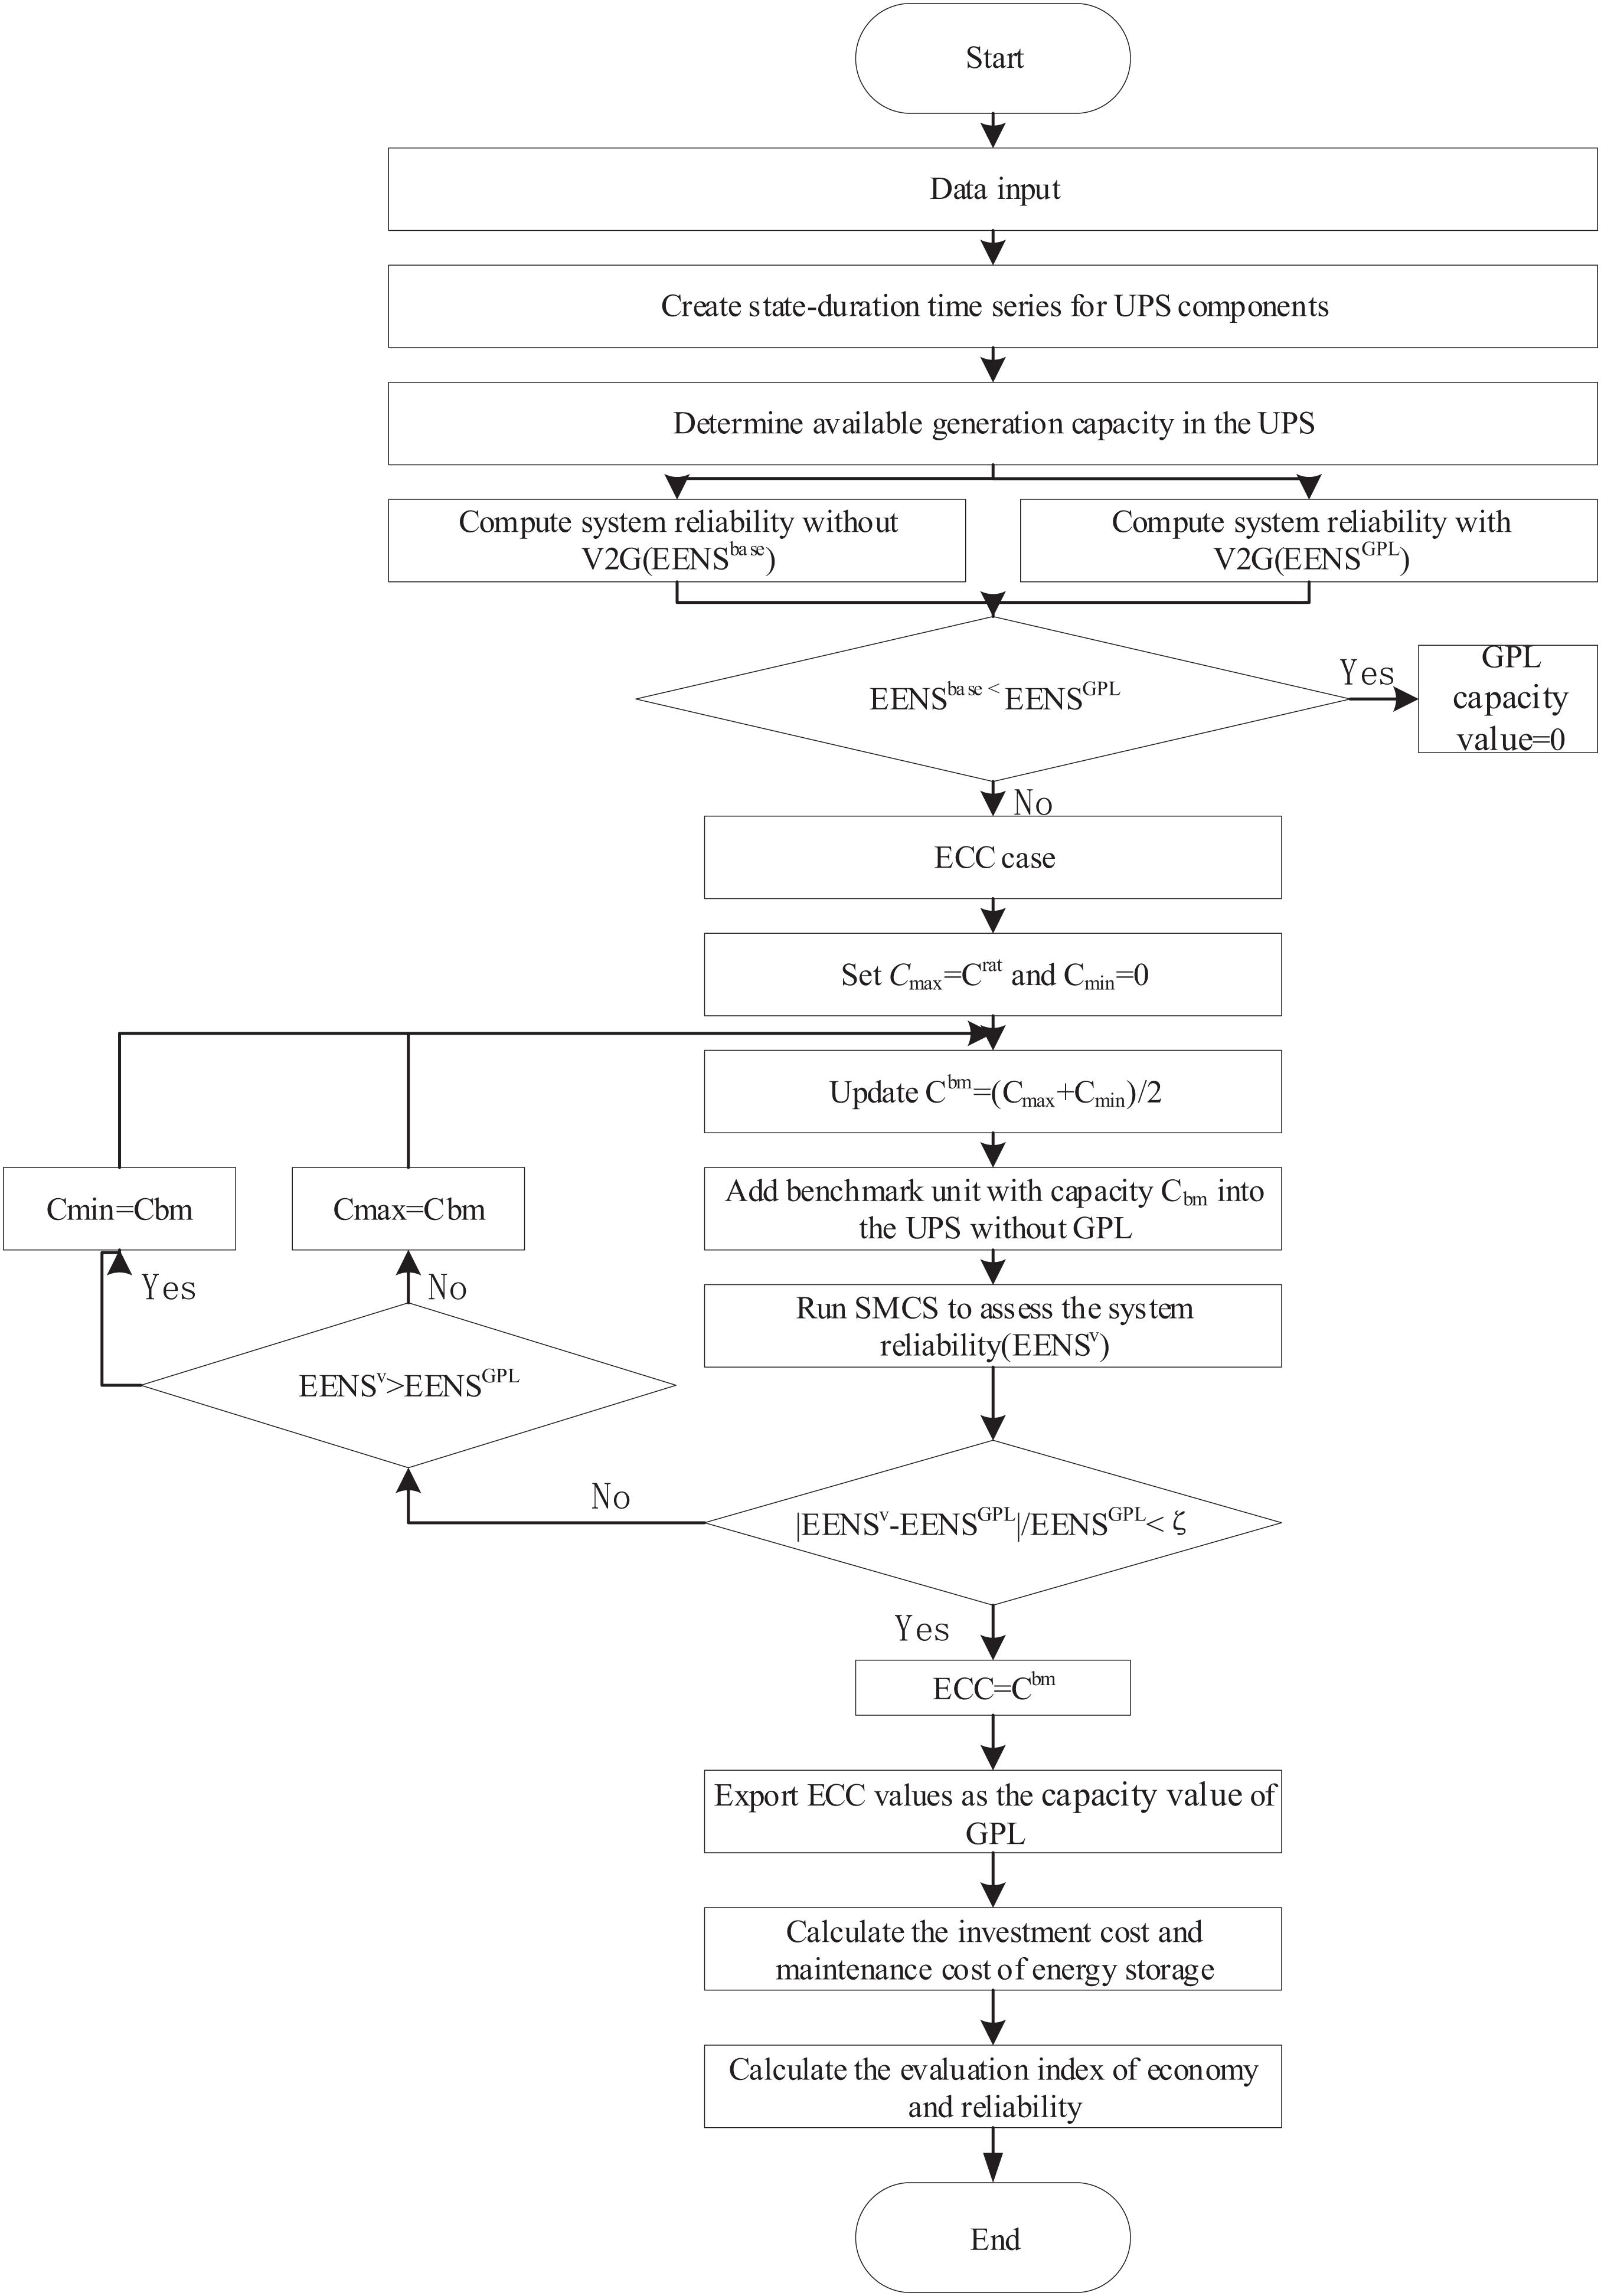
Figure 3. Flowchart of the proposed evaluation algorithm.
Step 1: According to the forced outage rate of each element in the distribution system, sample the state duration sequence of the system components by using the Monte Carlo simulation method.
Step 2: Generate the time series of the renewable energy supply according to its PDF with the inverse transform method (Billinton and Allan, 1996), if applicable.
Step 3: According to the status data obtained from the above steps, determine the power output of the generator set and transformer in each time period.
Step 4: Obtain the available capacity of the GPL according to Eqs. (3.5) – (3.10).
Step 5: According to the traditional reliability calculation method (Billinton and Allan, 1996), calculate the reliability index of the smart distribution network when the GPL does not participate in the V2G; the result obtained is used as the benchmark EENSbase.
Step 6: According to the following substeps, perform sequential Monte Carlo sampling on the smart distribution network with GPLs participating in V2G to obtain the reliability index of the system:
6-1: According to Eqs. (3.2) - (3.4), randomly extract the behavior patterns of each PEV user from the means of the vector .
6-2: Determine the total available power generation () and system load demand () for each period t based on:
where represents the regular load demand of the i-th node in period t; is a 0/1 variable indicating whether the n-th charging pile is in the charging state during period t. According to the service selection method for the PEV users, the value of can be determined by the following formula:
6-3: By calculating the power flow, determine whether the distribution network fails to meet the constraints during t (i.e., there is load loss).
6-4: If no constraint violation is found, it means that the system is operating normally, so the energy-not-supplied (ENS) is zero; otherwise, the smart distribution network is in an emergency state. Therefore, the analysis will be based on optimal power flow to obtain the ENS indicators.
, where represents the unmet load demand of the i-th node in the corresponding period t.
6-5: Repeat steps 5-3–5-4 for each time period t.
6-6: Update and export the system reliability index result as , where N′ represents the number of simulation years.
6-7: Repeat the sequential Monte Carlo method until the convergence condition σ(EENS)/[E(EENS)]≤0.05 is met, where E(EENS) and σ(EENS) represent the average expected value and standard deviation of the EENS value in the simulation year, respectively.
6-8: Record the EENS calculation in this scenario as EENSGPL.
Step 7: Compare the obtained values of EENSB and EENSGPL. If EENSB < EENSGPL, set the capacity value of the GPL to zero; otherwise, perform the following steps:
7-1: Define Cmax and Cmin, and set Cmax = CRa and Cmin = 0, where CRa is a positive value chosen artificially.
7-2: Add the generator set of the reference unit to the system without GPLs, where the installed capacity is CE=(Cmax + Cmin)/2.
7-3: Perform the sequential Monte Carlo method to evaluate the EENS index of the smart distribution network and record it as EENSV.
7-4: According to the obtained EENSV and EENSGPL values, adjust the unit capacity of the reference unit in the distribution network. Specifically, if EENSV=EENSGPL, then Cmin=CE, and Cmax keeps its value from the previous iteration; otherwise, set Cmax=CE and keep Cmin equal to its value in the previous iteration.
7-5: Update the result of CE to CE=(Cmax + Cmin)/2 and recalculate the EENS Value (EENSV).
7-6: Check whether the following convergence criterion is met: |EENSV−EENSB|/EENSB ≤ζ (this article sets ζ to 1%). If so, skip to step 8; otherwise, return to step 7-2.
Step 8: Set ECC = CE to terminate the algorithm.
Step 9: According to Eqs. (4.1) - (4.4), calculate the economic index of the GPL based on the capacity value.
Case Study
System Under Study
The capacity value evaluation framework of this paper is analyzed for the existing power supply system in Beijing. The network structure is shown in Figure 4. This system has a typical radial topology that is representative and universal in China. However, it should be noted that although our discussions are mainly based on this specific case, the findings of this research can be highly generalized and can be adapted to other UPSs that may have different topologies (such as mesh networks) and distributions.
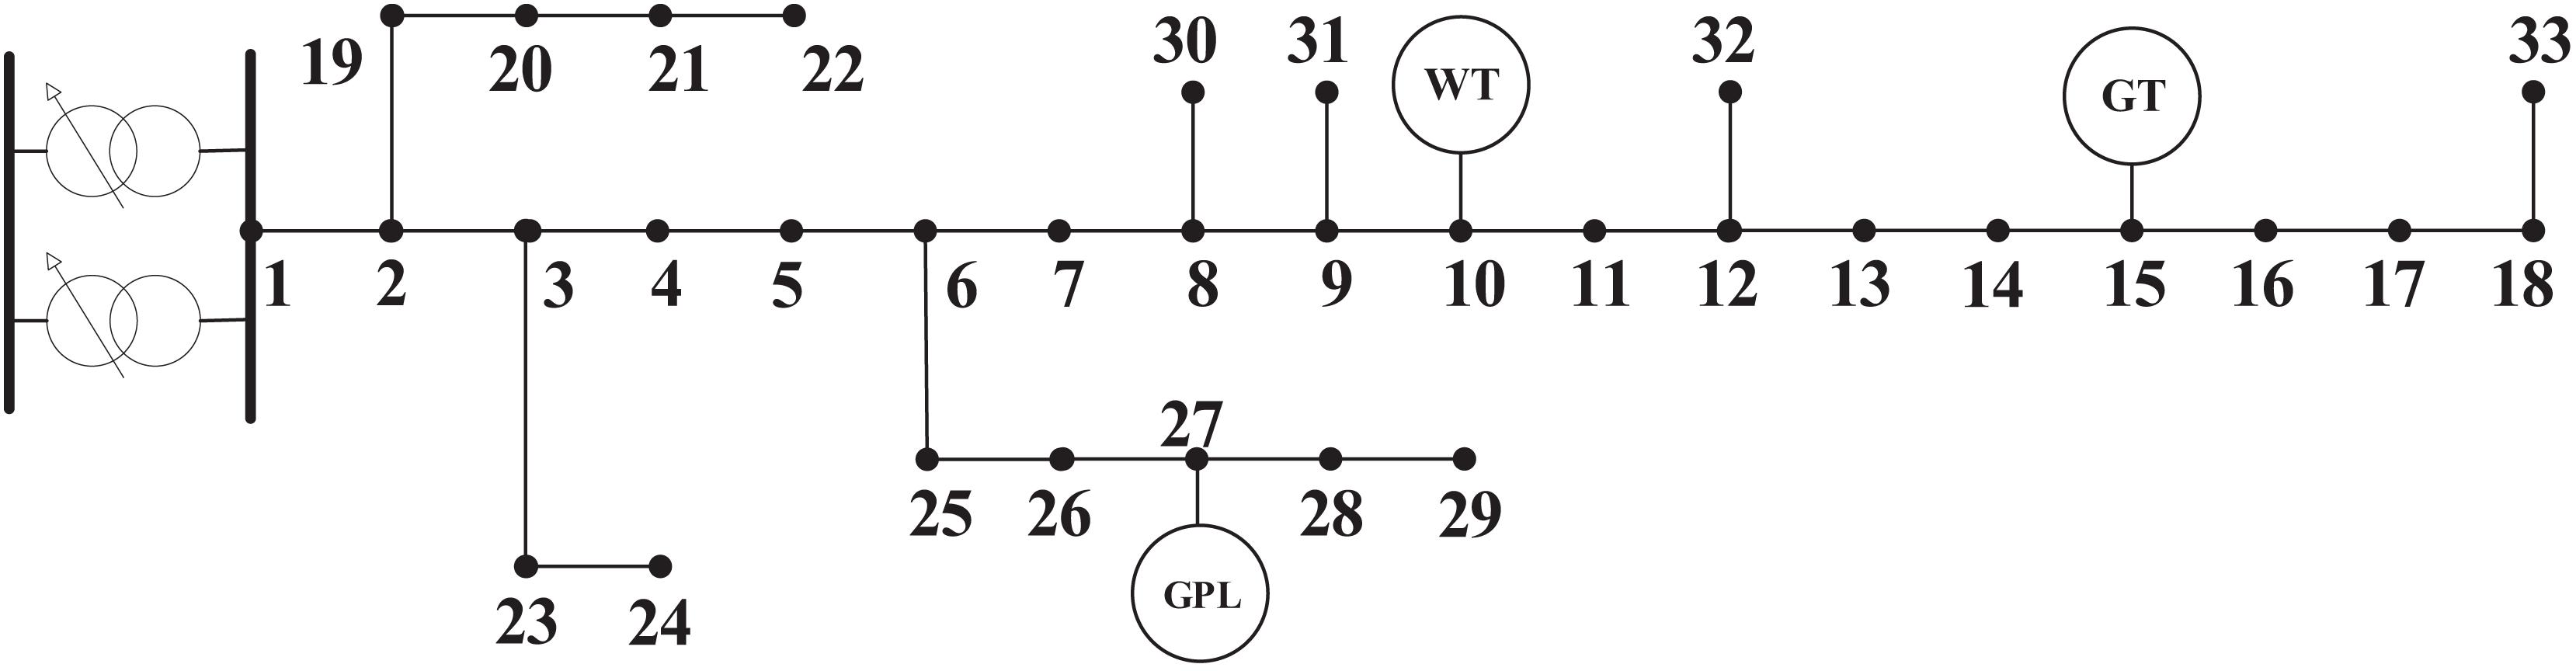
Figure 4. Test system.
The concerned system is connected to the outside through a 10 MVA 35 kV/10 kV substation and consists of 32 feeders and 33 load buses with a rated voltage of 10 kV. Node-1 is the balancing node, and node-15 is allocated 2 MW gas turbines. Node-10 is allocated 1.5 MW wind turbines. Node-27 is the location for the discussed GPL. The GPL contains 300 bilateral chargers with a rated capacity (Ai-Power Co Ltd, 2019). In this study, it is assumed that the wind speed in the system follows a Weibull distribution (Beijing Statistical Yearbook, 2011-2015). Additionally, the power supply available from the external grid follows a uniform distribution (Zeng et al., 2020a). The ramping constraints of the substation (Zeng et al., 2021b) are neglected. In addition, the chronological load curve used in this numerical study is determined based on the long-term statistics of a simple distribution system in Beijing, as shown in Figure 5.
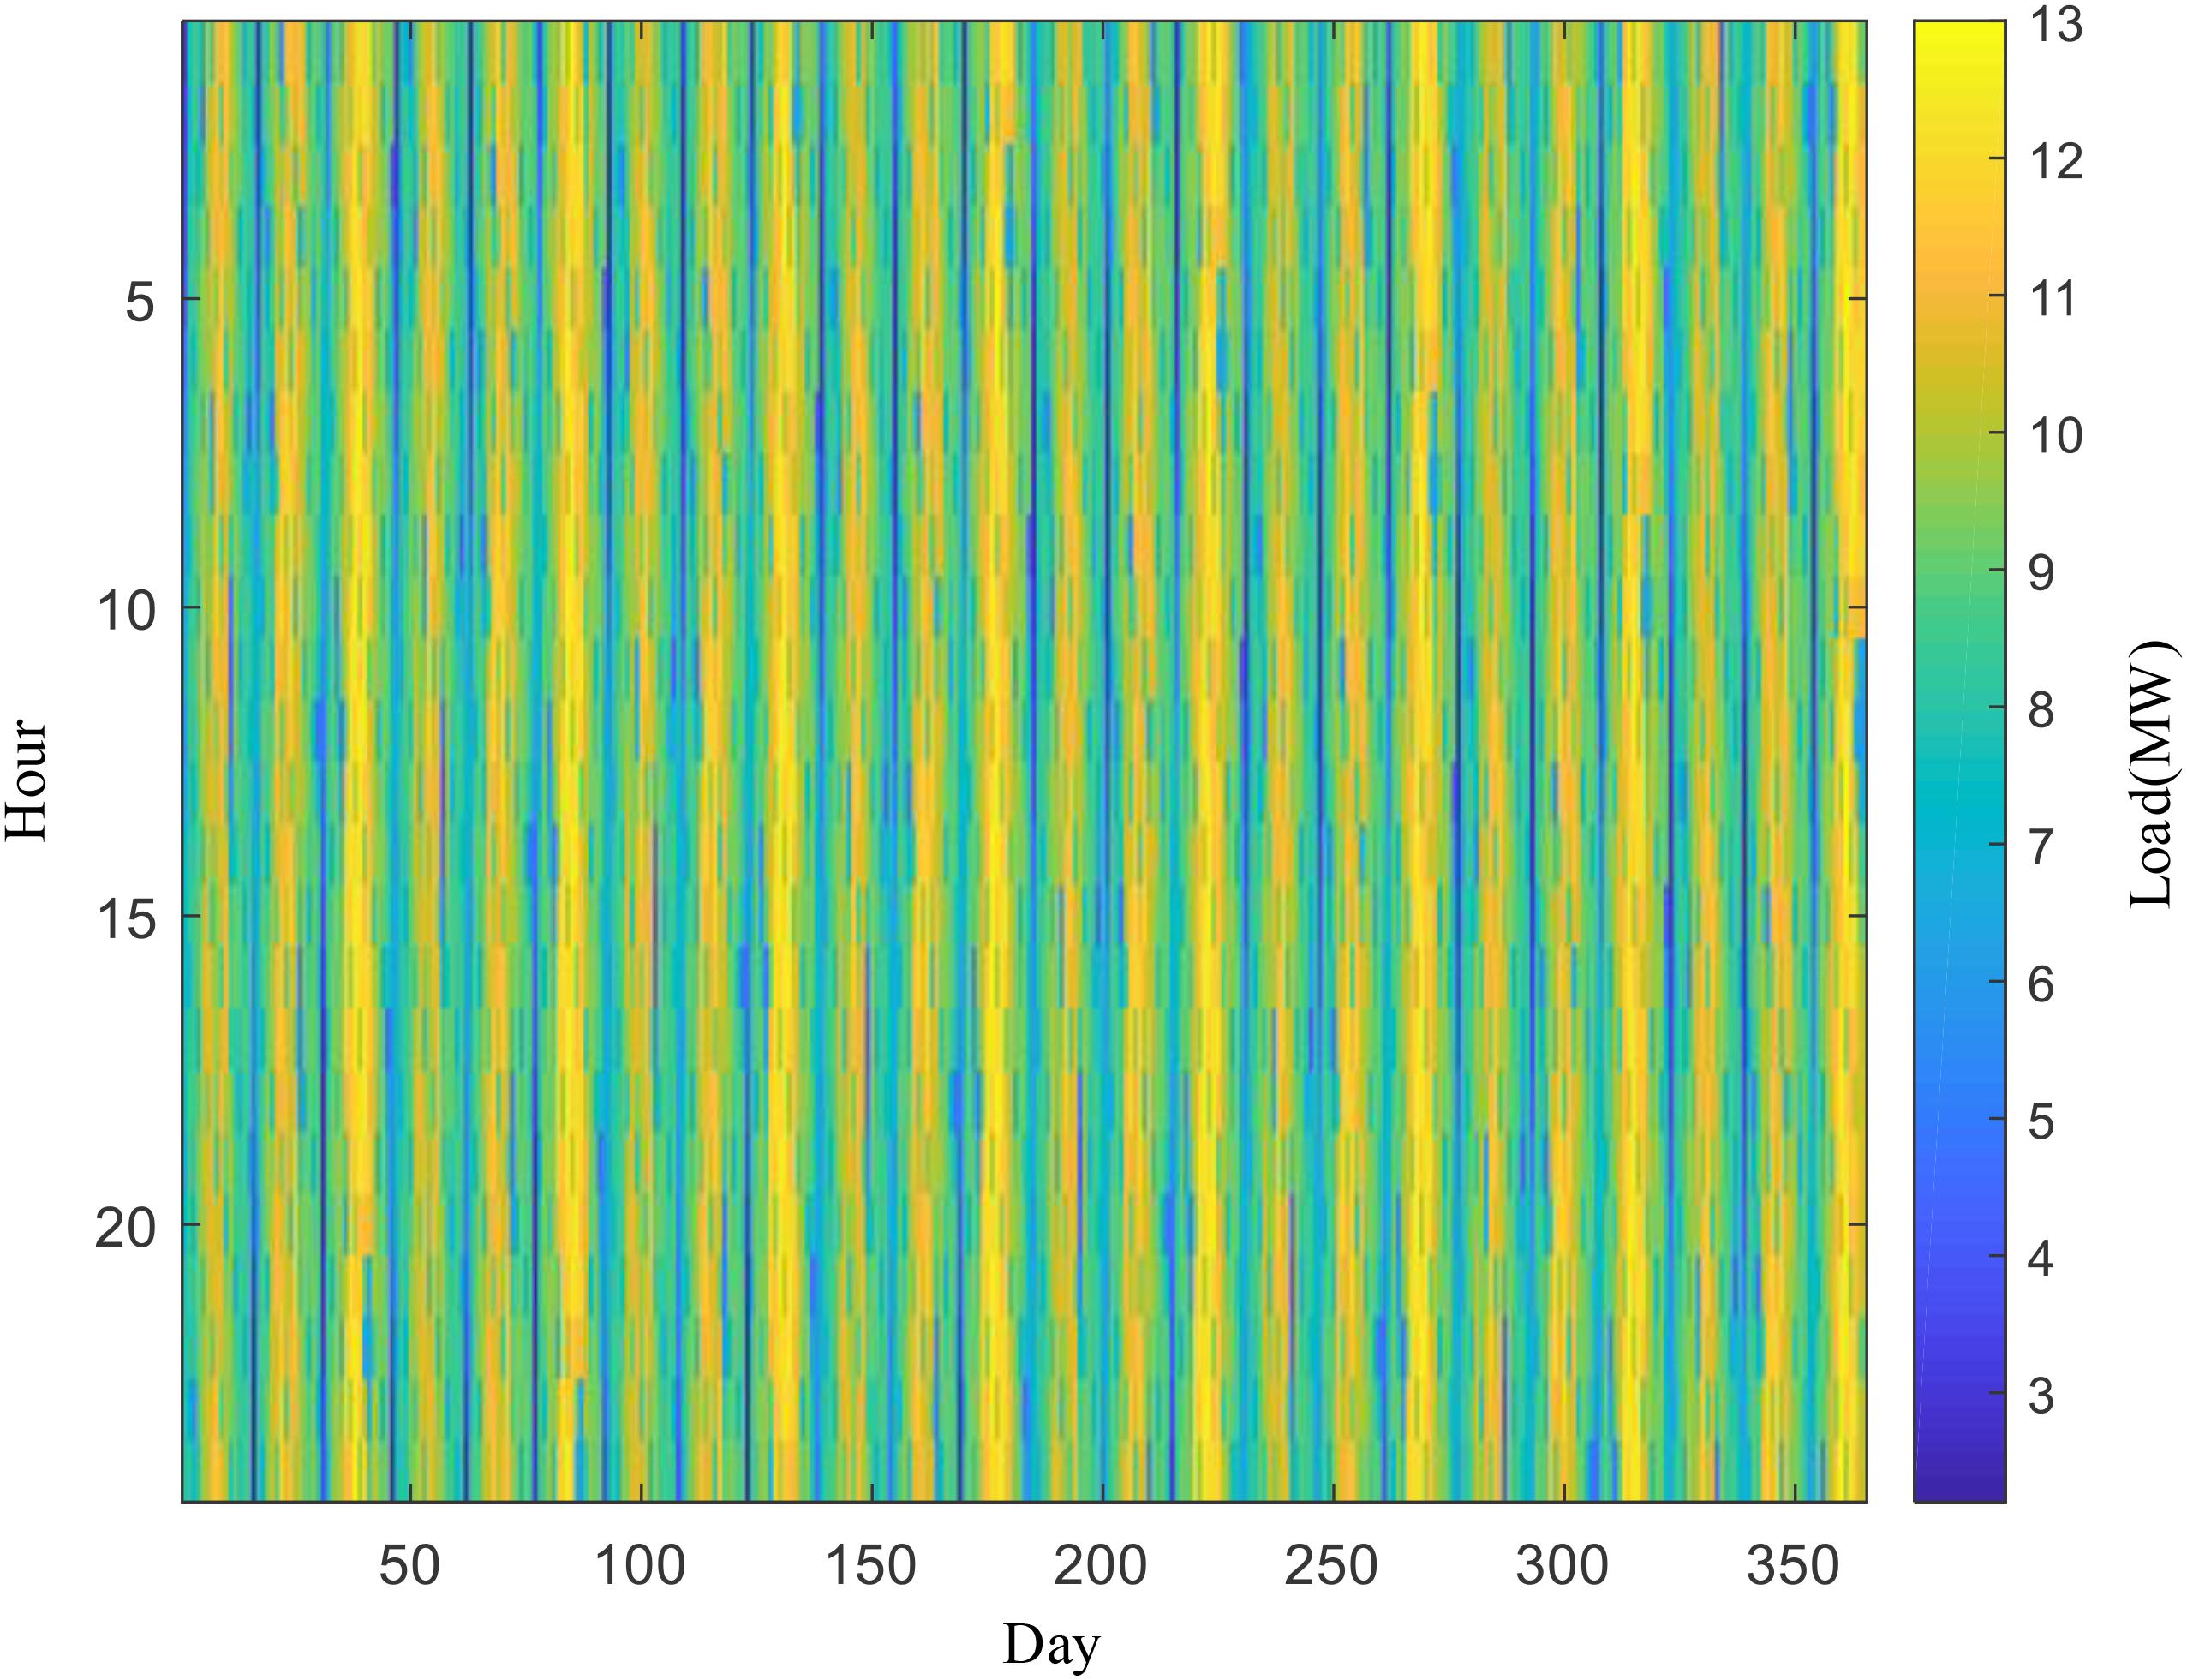
Figure 5. Chronological load profile.
In addition, the reliability parameters of the system components are summarized in Table 3.
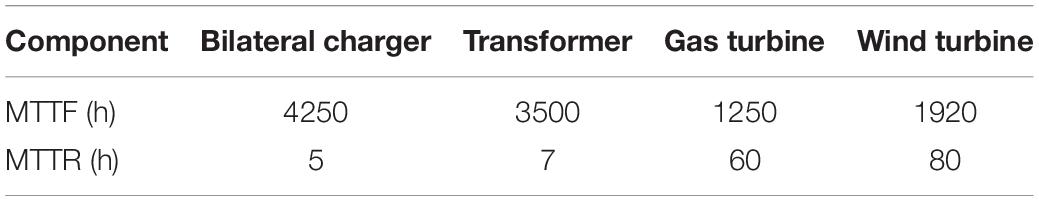
Table 3. Reliability data of the system components.
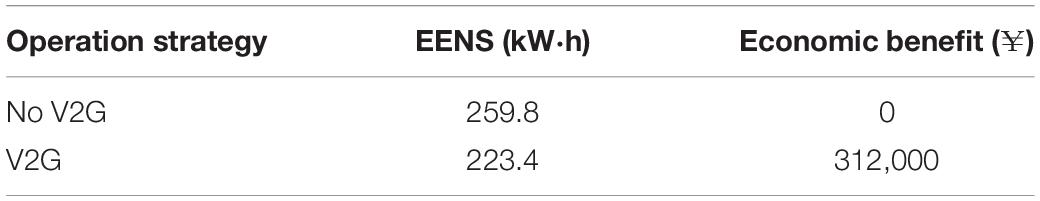
Table 4. Comparison of the reliability and economy of the GPL.
For simplicity, it is assumed that all the PEVs in the system correspond to the BAIC-EC200 PEV, which has a rated battery capacity of 20.5 kWh (Beijing Automotive Group Co Ltd., 2019). Therefore, the parameter EEV in Eq. (3.9) is set to 20.5 kWh.
Results
To determine the economics of the GPL capacity value and its impact mechanism, a series of comparative analyses were carried out. These analyses are introduced in the next subsections.
Impact of V2G Program
This subsection compares the impact of V2G on the reliability and economy of the power grid depending on whether the GPL participates. For this purpose, we assume that the discharge rate of the bilateral charger is 3.5 kW, the Soc threshold for the initiation of V2G operation is 90%, and the incentive payment for V2G participation is ¥1.50/kWh. On this basis, we compare the reliability and economic performance of the grid when the GPL participates in the V2G programme and when it does not participate.
The result is shown in Table 4 the EENS drops from 259.8 to 223.4 when the GPL participates in V2G, indicating that the GPL can increase the reliability of the power system and therefore has a beneficial impact on the power system. When the GPL participates in V2G, it can provide the power grid with an economic benefit of ¥312,000.
Influence of Bilateral Charger Discharge Rate
In this section, the primary object of analysis is the impact of the bilateral charger’s discharge power on the GPL’s capacity value. Because GPLs are equipped with different types of bilateral chargers, they may have different effects. Considering that the discharge capacity of most existing bilateral charger models on the market is the same (Ai-Power Co Ltd, 2019), we assume that the discharge rate PDC of the bilateral charger varies from 2 kW to 5 kW. In addition, in this test, the incentive grade is set as ¥1.50/kWh. The other parameter settings are assumed to be the same as in the previous study. Table 5 shows the relationship between the capacity value of the GPL based on the ECC measurement and the discharge rate.
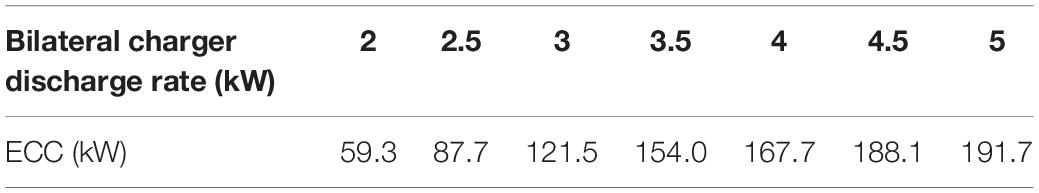
Table 5. Capacity value of GPL under different discharge rates.
The results show that the technical specifications of bilateral charger equipment have a strong correlation with the capacity value of the GPL. When the GPL is installed with a bilateral charger with a higher discharge efficiency, it can provide greater capacity support for the power grid, reducing the time of power supply system failure. However, it is not necessary that a higher discharge rate of the bilateral chargers always leads to improved system performance. Due to the limitation of the battery capacity of PEVs, the benefits of utilizing GPLs as virtual energy storage tend to become saturated with the continuous increase of the discharging rate.
Influence of Operation Strategy
In the above tests, it was assumed that a PEV in a GPL can be used for V2G only after the Soc of its battery has been charged to 90%. However, in real-world implementations, the GPL operator determines the operation rule of the GPL. In other words, the GPL operator may decide when and how to implement the V2G according to his or her own interests. To investigate how the selection of the operation strategy influences the contribution of GPLs, further study is conducted in this section.
For this purpose, we define several scenarios by setting different values of 80, 82, 85, 87, and 90% to represent the V2G operation strategy of the GPL based on different starting Soc thresholds. Note that these scenarios are selected arbitrarily and are used here only for illustration and comparison purposes. In practice, the GPL operator should carefully determine the V2G operation scheme by comprehensively considering various issues, e.g., the target Soc of the PEVs, batter degradation, hardware compatibility, etc. However, detailed discussions of this topic are beyond the scope of this study.
In this test, we set the incentive grade as ¥1.50/kWh, and the other parameter settings remain the same as in the previous study in Section “Impact of V2G Program.” The ECC of the GPL is evaluated under each of the considered scenarios, and Table 6 illustrates the corresponding results derived.
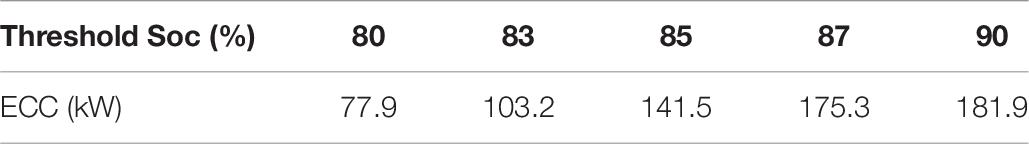
Table 6. Capacity value of the GPL under various threshold Soc values.
The results show that choosing different V2G control strategies causes the capacity value of GPL exploitation to differ considerably. The maximum capacity value occurs when the Soc threshold is 90%, and the minimum capacity value occurs when this value is 80%. This shows that the capacity value that the GPL can generate is closely related to its adopted V2G control strategies. Specifically, the larger the Soc threshold used by the GPL is, the larger the expected capacity value. This is in line with our expectations. In actual situations, the possibility of a failure in the power supply system is far lower than that of regular operation. Hence, the power supply system works in a normal state most of the time. The PEVs in the GPL can be charged when the power supply system is operating in the normal state. A higher Soc setting means that the GPL has plentiful energy available for grid support purposes. More energy can participate in V2G when the power supply system fails, thereby improving the reliability benefits of GPL exploitation.
Analysis of Economic Implications
In this study, an incentive scheme was used to motivate PEV users to participate in the V2G programme. However, in practice, the inappropriate selection of the incentive scheme degrades the economics of system operation. Therefore, this section conducts a further analysis to investigate the impact of external stimuli, i.e., incentive signals on PEV participation as well as the economics of GPL exploitation. To do so, in this test, we consider the reward rates paid for V2G participants to be 1.0, 1.25, 1.5, 1.75, and 2.0 ¥/kWh. According to the behavior model of PEV users, different incentive grades result in different participation levels of PEVs in V2G, which can be concluded from Figure 2. Then, a comparison can be made for the resulting capacity value of the GPLs and their economic costs under different incentive grades. To clearly show the relationship between the reliability value and economic costs produced by GPL exploitation, the economic cost data are presented in terms of the per kW value, which is denoted as EG. The results are illustrated in Figure 6.
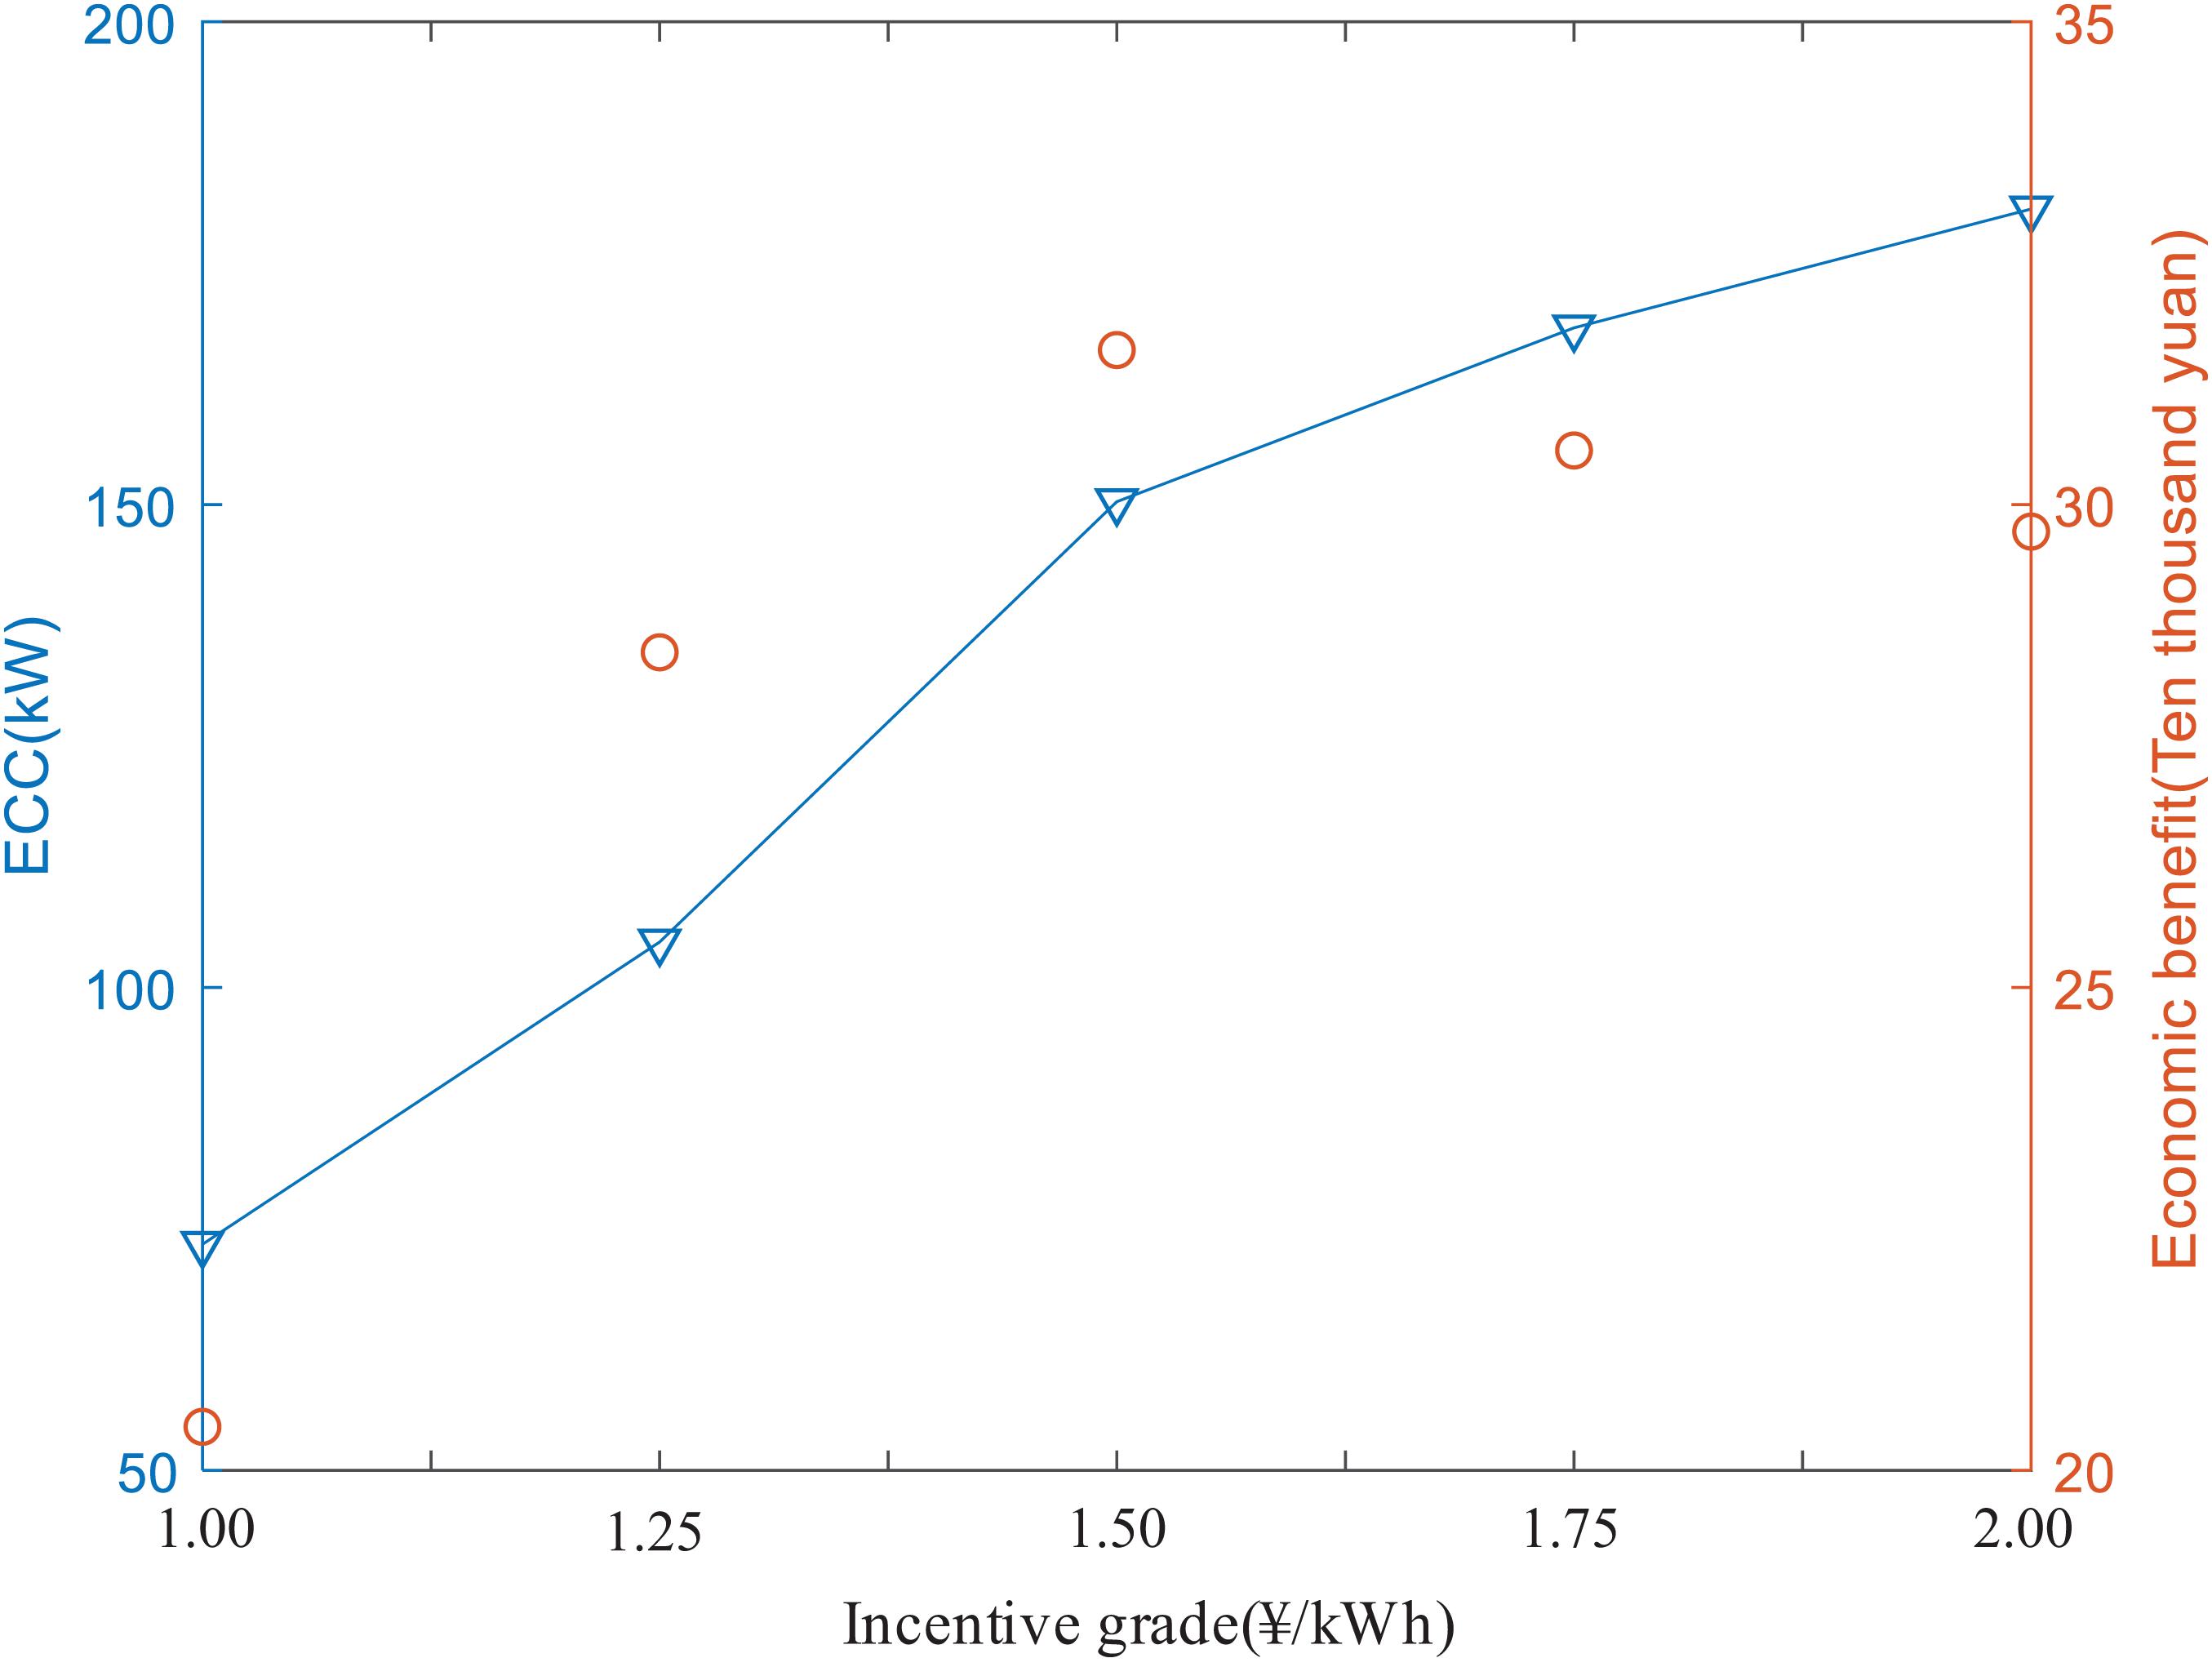
Figure 6. Capacity value of GPLs and its economic benefit under different incentive grades.
As shown above, when the imposed incentive reward is increased, the ECC of the GPL grows sustainably; however, the economic cost of the system tends to first increase and then decrease. This implies that the increase in the incentive grade could encourage PEV users to participate in the V2G programme first; however, with the continuous growth of this rate, its marginal contribution would decrease, which results in the growth rate of the ECC becoming less significant. Additionally, we can observe the economic implications of GPL exploitation from Figure 6. Specifically, the grid utility needs to bear a higher economic cost to invoke V2G with the increase in the incentive grades. The cost-benefit efficiency is highest when the incentive grade reaches ¥1.5/kWh. This indicates that the design of an incentive scheme has a significant impact on the economic efficiency for GPL exploitation. Although imposing a higher reward could help to achieve a greater capacity value from the GPL, in the real world, this is not necessarily sensible and efficient from an economic perspective. As such, the grid utility or decision-makers need to pay close attention to the design of such incentive grades when evaluating the potential contribution of GPLs to the sustainability of power systems in order to take advantage of GPL benefits under an acceptable economic budget.
Policy Suggestions
It can be clearly seen from the calculation example in Section “Influence of Bilateral Charger Discharge Rate” that using a GPL as a virtual energy storage unit can improve the reliability of the power system and simultaneously improve the economy of the power system. The results in Sections “Influence of Bilateral Charger Discharge Rate and Influence of Operation Strategy” indicate that the GPL’s use of higher-specification charging piles and a larger Soc threshold are conducive to improving reliability. Section “Analysis of Economic Implications” shows that the impact of different incentive grades on user participation and capacity value is one of the most important factors. When the incentive grade reaches ¥1.5/kWh, as it increases, it can bring higher capacity value, but the economic value will decrease accordingly.
Therefore, to improve the sustainability of GPL power supply for future smart cities, it is recommended that the government take the following measures:
(1) It is recommended to incorporate PEV charging infrastructures into urban energy planning as energy storage resources and implement a comprehensive “source-network-load-storage” resource plan to effectively reduce the planned capacity of flexible resources such as electricity storage and natural gas power generation.
(2) It is recommended to improve the peak-valley price formation mechanism, establish a dynamic peak-valley price adjustment mechanism under the premise that the overall sales price level remains unchanged, increase the implementation of the peak-valley price, and use price signals to guide PEV users to participate in peak shaving and valley filling.
(3) It is recommended to improve the auxiliary service compensation mechanism, accelerate the construction of the auxiliary service market, and provide reasonable economic compensation for auxiliary services such as the frequency modulation and backup provided by PEVs in order to encourage PEV users to participate in V2G programs.
Conclusion
The method proposed in this paper is based on an integrated capacity-value and economic analysis procedure, which aims to quantify the potential benefits for exploiting GPLs as virtual energy storage resources to the reliability of power supply and its associated economic costs collectively under the same framework. To accurately describe the characteristics of GPLs during operation, this paper introduces a probabilistic approach to simulate the uncertainty of PEV users’ behaviors and the sequential Monte Carlo method is also used to simulate the operation states of system equipment. The simulation results from the case study show that efficient utilization of GPLs would be helpful to improve the reliability of power supply at a lower economic expense than the conventional physical energy storage option. However, the capacity value of GPLs is highly dependent on the operating characteristics of its constituent facilities. The research results show that a higher charging rate of the bilateral chargers or larger battery capacity will increase the reliability benefits of the GPLs. Finally, in a liberalized market, the participation of PEV users for V2G is strongly influenced by the reward scheme that adopted. Higher incentive rates can encourage PEV users to participate in V2G and make greater contribution to the improvement of power grid performance. However, excessively high incentive rates will improve system reliability but decrease the economy of power system operation. This proves the necessity of conducting a comprehensive reliability-economic analysis for GPL exploitation in real-world implementations. Finally, we put forward a series of policy recommendations based on the results of the case study. Hopefully, the evaluation framework proposed in this study can help public utilities and government administrative departments better understand the potential of GPLs to be utilized and its associated costs on the development of smart cities at the present stage.
Nomenclature
| Acronyms | |
| ECC | Equivalent conventional capacity |
| EENS | Expected energy not supplied |
| G2V | Grid-to-vehicle |
| GPL | Grid-connected parking lot |
| PEV | Plug-in electric vehicle |
| UPS | Urban power system |
| DG | distributed generation |
| Soc | State of charge |
| V2G | Vehicle-to-grid |
| Parameters and Variables | |
| CT | Total generation capacity installation (kW) |
| CE | Capacity of energy storage that added (kW) |
| CPL | Total installed capacity of bilateral chargers (kW) |
| γC | Binary variable indicating whether the user allows PEV to participate in V2G |
| γOP | Binary variable indicating whether GPL operator allows PEV to participate in V2G |
| γV2G | Binary variable indicating PEV participation in V2G |
| nCh | Binary variable indicating PEV charging |
| PAG | GPL available power (kW) |
| PC | Rated charging power of bilateral chargers (kW) |
| PDC | Rated discharging power of bilateral chargers (kW) |
| PDG | Available power of DG equipment (kW) |
| PDGN | DG output power in non-fault state (kW) |
| PT | Available power of transformer (kW) |
| PTN | Transformer output power in non-fault state (kW) |
| PM | Maximum output power of PEV parking lot (kW) |
| SocIni | The initial Soc for PEV (%) |
| SocTar | Soc threshold (%) |
| μSoc | Expected value of initial Soc for PEV (%) |
| σSoc | Variance of the initial Soc of the PEV (%) |
| SocPEV,min | Minimum value of the initial Soc for PEV (%) |
| SocPEV,max | Maximum value of the initial Soc of PEV (%) |
| tAr | PEV arrival time |
| μAr | Expectation of PEV arrival time |
| σAr | Variance of PEV arrival time |
| tAr,min | Minimum PEV arrival time |
| tAr,max | Maximum PEV arrival time |
| tDe | PEV departure time |
| μDe | Expectation of PEV departure time |
| σDe | Variance of PEV departure time |
| tDe,min | Minimum PEV departure time |
| tDe,max | Maximum PEV departure time |
| PTD | Load demand (kW) |
| PTG | Total available generation capacity (kW) |
| tAr | PEV arrival time |
| tDe | PEV departure time |
| tCh | PEV charging time |
| Δt | Time duration of each period in hours |
| αP | Binary variable indicating whether PEV is in GPL |
| βDG/βT/βC | Binary variable indicating whether generator set/transformer/bilateral chargers are available |
| ωV2G | Parking lot participates in V2G electricity selling price |
| ωPay | Whether the parking lot participates in the boundary of V2G electricity selling price |
| SP,E | Energy storage investment cost |
| Sm | Energy storage operating cost |
| EV2G | Cost of the power grid when the parking lot participates in V2G |
| CP | Power cost of the energy storage device |
| PSt | Power of the energy storage device |
| CE | Capacity cost of the energy storage device |
| ESt | Capacity of the energy storage device |
| Cm | Annual operation and maintenance cost per unit capacity |
| EEV | Electric vehicle battery capacity (kWh) |
| Price of V2G called from the parking lot | |
| Power of the parking lot participating in V2G | |
| ηBC | Charging/discharging efficiency of bilateral chargers (%) |
| Indices (Sets) | |
| i(ΩD) | Load busel |
| k (ΩCP) | Bilateral chargers |
| n (ΩEV) | PEV users |
| t | Time |
Data Availability Statement
The original contributions presented in the study are included in the article/supplementary material, further inquiries can be directed to the corresponding author/s.
Author Contributions
BZ, BS, and HM contributed to conception and design of the study. HM organized the database. XW performed the statistical analysis. BS wrote the first draft of the manuscript. BS, HM, and YW wrote sections of the manuscript. LW provided suggestions for amendments. All authors contributed to manuscript revision, read, and approved the submitted version.
Funding
This study is supported by the State Key Laboratory of Alternate Electrical Power System with Renewable Energy Sources (Grant No. LAPS19018) and the National Social Science Fund of China (Grant No. 19ZDA081).
Conflict of Interest
LW was employed by company Shanxi Electrical Power Company of SGCC.
The remaining authors declare that the research was conducted in the absence of any commercial or financial relationships that could be construed as a potential conflict of interest.
References
Ai-Power Co., Ltd (2019). AC Charging Pile Products. Available online at: http://aipower.com.cn/cn/service/005003.html (accessed May 12, 2019)
Al-Rubaye, S., Al-Dulaimi, A., and Ni, Q. (2019). Power interchange analysis for reliable vehicle-to-grid connectivity. IEEE Commun. Mag. 57, 105–111. doi: 10.1109/MCOM.2019.1800657
Beijing Automotive Group Co., Ltd Vehicle Configuration of BAIC-EC200. Available online at: http://www.bjev.com.cn/models/detile.htm?oid=9&name=ec200 (accessed May 12, 2019)
Beijing Statistical Yearbook (2011-2015). Wind Speed Data. Available online at: http://nj.tjj.beijing.gov.cn/nj/main/2015-tjnj/zk/indexch.htm (accessed October 01, 2020)
Billinton, R., and Allan, R. (1996). Reliability Evaluation of Power Systems. New York, NY: Plenum Press.
Bozic, D., and Pantos, M. (2015). Impact of electric-drive vehicles on power system reliability. Energy 83, 511–520. doi: 10.1016/j.energy.2015.02.055
Dent, C. J., Hernandez-Ortiz, A., Blake, S. R., Miller, D., and Roberts, D. (2015). Defining and evaluating the capacity value of distributed generation. IEEE Trans. Power Syst. 30, 2329–2337. doi: 10.1109/TPWRS.2014.2363142
Ding, M., and Xu, Z. (2017). Empirical model for capacity credit evaluation of utility-scale PV plant. IEEE Trans. Sustain. Energy 8, 94–103. doi: 10.1109/TSTE.2016.2584119
Du, Z., Lin, B., and Guan, C. (2019). Development path of electric vehicles in China under environmental and energy security constraints. Resour. Conserv. Recycl. 143, 17–26. doi: 10.1016/j.resconrec.2018.12.007
Farzin, H., Fotuhi-Firuzabad, M., and Moeini-Aghtaie, M. (2017). Reliability studies of modern distribution systems integrated with renewable generation and parking lots. IEEE Tran. Sustain. Energy 8, 431–440. doi: 10.1109/TSTE.2016.2598365
Farzin, H., and Monadi, M. (2019). Reliability enhancement of active distribution grids via emergency V2G programs: an analytical cost/worth evaluation framework. Sci. Iran. 26, 3635–3645. doi: 10.24200/sci.2019.54158.3624
Guner, S., and Ozdemir, A. (2020). Reliability improvement of distribution system considering EV parking lots. Electr. Power Syst. Res. 185:106353. doi: 10.1016/j.epsr.2020.106353
Heydarian-Forushani, E., Golshan, M. E. H., and Shafie-Khah, M. (2016). Flexible interaction of plug-in electric vehicle parking lots for efficient wind integration. Appl. Energy 179, 338–349. doi: 10.1016/j.apenergy.2016.06.145
Irshad, U. B., Rafique, S., and Town, G. (2020). “Reliability assessment considering intermittent usage of electric vehicles in parking lots,” in Proceedings of the 2020 IEEE 29th International Symposium on Industrial Electronics (ISIE), Delft, 965–970. doi: 10.1109/ISIE45063.2020.9152560
Keane, A., Milligan, M., Dent, C. J., Hasche, B., D’ Annunzio, C., Dragoon, K., et al. (2011). Capacity value of wind power. IEEE Trans. Power Syst. 26, 564–572. doi: 10.1109/TPWRS.2010.2062543
Mohammadi-Hosseininejad, S. M., Fereidunian, A., and Lesani, H. (2018). Reliability improvement considering plug-in hybrid electric vehicles parking-lots ancillary services: a stochastic multi-criteria approach. IET Gener. Trans. Distribut. 12, 824–833. doi: 10.1049/iet-gtd.2017.0657
Momen, H., Abessi, A., and Jadid, S. (2020). Using EVs as distributed energy resources for critical load restoration in resilient power distribution systems. IET Gener. Trans. Distribut. 14, 3750–3761. doi: 10.1049/iet-gtd.2019.1561
Moradijoz, M., Heidari, J., Moghaddam, M. P., and Haghifam, M. R. (2020). Electric vehicle parking lots as a capacity expansion option in distribution systems: a mixed-integer linear programing-based model. IET Electr. Syst. Transp. 10, 13–22. doi: 10.1049/iet-est.2018.5062
Neyestani, N., Damavandi, M. Y., Shafie-Khah, M., Contreras, J., and Catalao, J. P. S. (2015). Allocation of plug-in vehicles’ parking lots in distribution systems considering network-constrained objectives. IEEE Trans. Power Syst. 30, 2643–2656. doi: 10.1109/TPWRS.2014.2359919
Onishi, V. C., Antunes, C. H., and Fernandes Trovao, J. P. (2020). Optimal energy and reserve market management in renewable microgrid-PEVs parking lot systems: V2G, demand response and sustainability costs. Energies 13:1884. doi: 10.3390/en13081884
Shafie-Khah, M., Heydarian-Forushani, E., Osorio, G. J., Gil, F. A. S., Aghaei, J., Barani, M., et al. (2015). Optimal behavior of electric vehicle parking lots as demand response aggregation agents. IEEE Trans. Smart Grid 7, 2654–2665. doi: 10.1109/TSG.2015.2496796
Shaukat, N., Khan, B., Ali, S. M., Mehmood, C. A., Khan, J., Farid, U., et al. (2018). A survey on electric vehicle transportation within smart grid system. Renew. Sustain. Energy Rev. 81, 1329–1349. doi: 10.1016/j.rser.2017.05.092
Silva, B. N., Khan, M., and Han, K. (2018). Towards sustainable smart cities: a review of trends, architectures, components, and open challenges in smart cities. Sustain. Cities Soc. 38, 697–713. doi: 10.1016/j.scs.2018.01.053
Singh, S., Jagota, S., and Singh, M. (2018). Energy management and voltage stabilization in an islanded microgrid through an electric vehicle charging station. Sustain. Cities Soc. 41, 679–694. doi: 10.1016/j.scs.2018.05.055
Xu, N. Z., and Chung, C. Y. (2016). Reliability evaluation of distribution systems including vehicle-to-home and vehicle-to-grid. IEEE Trans. Power Syst. 31, 759–768. doi: 10.1109/TPWRS.2015.2396524
Yilmaz, M., and Krein, P. T. (2013). Review of battery charger topologies, charging power levels, and infrastructure for plug-in electric and hybrid vehicles. IEEE Trans. Power Electron. 28, 2151–2169. doi: 10.1109/TPEL.2012.2212917
Zaisen, Q. (2018). Energy Storage Planning and Economic Research under Different Operating Modes. Ph. D. thesis. Zhengzhou: Zhengzhou University.
Zeng, B., Dong, H., Sioshansi, R., Xu, F., and Zeng, M. (2020a). Bilevel robust optimization of electric vehicle charging stations with distributed energy resources. IEEE Trans. Ind. Appl. 56, 5836–5847. doi: 10.1109/TIA.2020.2984741
Zeng, B., Feng, J., Liu, N., and Liu, Y. (2021a). Co-optimized parking lot placement and incentive design for promoting PEV integration considering decision-dependent uncertainties. IEEE Trans. Indus. Inform. 17, 1863–1872. doi: 10.1109/TII.2020.2993815
Zeng, B., Liu, Y., Xu, F., Liu, Y., Sun, X., and Ye, X. (2021b). Optimal demand response resource exploitation for efficient accommodation of renewable energy sources in multi-energy systems considering correlated uncertainties. J. Clean. Prod. 288:125666. doi: 10.1016/j.jclepro.2020.125666
Zeng, B., Wei, X., Sun, B., Qiu, F., Zhang, J., and Quan, X. (2020a). Assessing capacity credit of demand response in smart distribution grids with behavior-driven modeling framework. Int. J. Electr. Power Energy Syst. 118:105745. doi: 10.1016/j.ijepes.2019.105745
Keywords: grid-connected parking lot, distribution system, sustainability, economy, plug-in electric vehicle, virtual energy storage
Citation: Zeng B, Sun B, Mu H, Wang Y, Wei X and Wang L (2021) Comprehensive Benefit/Cost Analysis of Utilizing PEV Parking Lots as Virtual Energy Storage for the Energy Supply Sustainability of Future Distribution Systems. Front. Energy Res. 9:686890. doi: 10.3389/fenrg.2021.686890
Received: 28 March 2021; Accepted: 19 April 2021;
Published: 18 May 2021.
Edited by:
Tao Huang, Politecnico di Torino, ItalyReviewed by:
Fei Xue, Xi’an Jiaotong-Liverpool University, ChinaOuyang Shaojie, China Southern Power Grid, China
Copyright © 2021 Zeng, Sun, Mu, Wang, Wei and Wang. This is an open-access article distributed under the terms of the Creative Commons Attribution License (CC BY). The use, distribution or reproduction in other forums is permitted, provided the original author(s) and the copyright owner(s) are credited and that the original publication in this journal is cited, in accordance with accepted academic practice. No use, distribution or reproduction is permitted which does not comply with these terms.
*Correspondence: Bo Sun, c3VuYm9uY2VwdUAxNjMuY29t