 Hua Fu
 Yingying Shi2*
94% of researchers rate our articles as excellent or good
Learn more about the work of our research integrity team to safeguard the quality of each article we publish.
Find out more
BRIEF RESEARCH REPORT article
Front. Energy Res., 30 June 2021
Sec. Smart Grids
Volume 9 - 2021 | https://doi.org/10.3389/fenrg.2021.681244
This article is part of the Research TopicNew Solutions for Smart Grids with High-Penetration Distributed Energy ResourcesView all 19 articles
China has a large manufacturing industry and shoulders the responsibility of reducing carbon emissions. Smart grid technologies can integrate multiple renewable energy technologies, which possess significant potential in reducing carbon emissions. To estimate the carbon emission reduction potential of the smart grid in China’s manufacturing industry, this paper applies a temporal logarithmic mean Divisia index (LMDI) method to analyze the driving forces of carbon emission changes in the whole manufacturing industry and 28 sub-industries from 2000 to 2017, respectively. The results reveal that industrial activity and energy intensity are the key factors leading to the increase and mitigation of carbon emissions, respectively. Sub-industries with high emission intensity are crucial for the reduction of carbon emissions in the manufacturing industry. By applying a smart grid, the carbon emissions could be reduced by 27.51% in the optimistic scenario.
Due to its continued economic growth, industrialization, and urbanization, China surpassed the United States as the world’s largest emitter of carbon dioxide in 2007. According to the BP world energy statistics review, China’s carbon emissions in 2016 reached 9.12 billion tons, accounting for 27.3% of global carbon emissions. The extreme climate phenomenon caused by the sharp increase in greenhouse gas has brought great challenges for human survival and development. In 2015, to undertake international responsibilities and obligations, the Chinese government proposed reducing carbon emissions per unit of GDP by 60–65% by 2030 from the 2005 level. As the pillar of China’s economy, industry consumes 70% of the domestic energy and contributes more than 50% of the domestic carbon emissions. To achieve the goal of reducing carbon emissions while maintaining high-quality economic development, the manufacturing industry has made the reduction of carbon emissions its top priority. Considering China’s significant coal consumption, the reduction of carbon emissions in the manufacturing industry is not only related to the industrial structure but also related to the energy structure. This unreasonable energy structure is an important factor that leads to the industry’s high carbon emission intensity.
There is rich literature focusing on carbon emission reduction regarding the manufacturing industry (e.g., Li and Cheng, 2020). It has also been demonstrated that smart-grid technologies are helpful for reducing carbon emissions in power and transportation industries (Fu et al., 2012); however, the potential of smart-grid in terms of reducing carbon emissions in the manufacturing industry is rarely studied. Since a variety of energy resources are converted into electric power for serving manufacturing industries, it is of great practical significance to estimate the carbon emission reduction potential of the smart grid.
In this paper, we use the logarithmic mean Divisia index (LMDI) decomposition method to analyze the influencing factors of carbon emissions in the manufacturing industry and attempt to clarify the impacts of industrial activities and energy structure on the sub-industry’s carbon emissions. Then we estimate the potential of emission reduction by optimizing the energy structure through a smart grid.
Carbon emission is an important aspect of environmental economics and energy economics. As for the relationship between carbon emissions and energy structure, many studies have been carried out from the industry level and regional level, mainly focusing on manufacturing, the power industry, energy structure, coal consumption, coal power, and renewable energy power generation.
Some scholars have analyzed the relationship between China’s energy consumption, especially coal consumption, and carbon emissions from a regional perspective. Sun et al. (2016) used Moran’s I index and a geographical weighted regression model to illustrate the spatial features of provincial carbon emission transfer and its economic spillover effects. They found that 18 provinces reduced coal consumption through carbon emission transfer, indicating that the transfers occurred due to the presence of carbon emissions. Because these regions reduced coal consumption in the production processes, they had cleaner modes of production. Some scholars have studied the differences and reasons of carbon emissions in eastern, central, and Western China (Xu and Lin, 2017). Cai and Guo (2018) identified the driving forces of carbon emissions of 286 Chinese cities, finding that industry composition, development stage, and geographical location are important driving forces to increase the carbon emissions of Chinese cities.
Some scholars have analyzed the impacts of economic activities, energy intensity, and technology on carbon emissions from the perspective of industry. Since the decomposition analysis method can better quantify the potential of carbon emissions reduction, the LMDI method is widely used in research about the region and industry. By using a decomposition analysis of carbon emissions from China’s manufacturing industry, Chinese scholars found that economic output effect and energy intensity effect are the most significant of carbon emissions, and the output effect is far greater than the inhibition effect of energy intensity and energy structure on carbon emissions (Xu et al., 2012; Tan and Lin, 2018). Energy intensity can be further decomposed into technology, intermediate input, and industrial output structure; however, the effect of technological change on carbon emissions is not obvious in recent years (Zhou and Ang, 2008). Lin and Du (2014) used a comprehensive decomposition model to study the impact of technological progress on the decline of China’s energy intensity. In the long run, technological progress will be key to achieving the sustainable growth of energy productivity. Ang et al. (2015) expanded the LMDI decomposition method and studied carbon emissions of the manufacturing industries in 30 provinces of China. Based on this information, domestic scholars further analyzed the influencing factors of carbon emissions in the sub-industries of China’s manufacturing industry (Shi et al., 2019).
Additionally, scholars have carried out research on the emissions reduction effects of a smart grid. Lamiaa and Tarek (2013) studied Egypt to explore the development of a smart grid and its contribution to carbon emissions reduction in the electricity sector. Some scholars have studied how to optimize the smart grid to encourage the use of more renewable energy for power generation (Li et al., 2021). Some scholars have designed emissions reduction schemes for smart grids in six representative EU countries and have found that by adopting new technologies and effective regulatory frameworks, we can realize the emissions reduction potential and achieve the 2020 emissions reduction target (Darby et al., 2013).
Although many scholars are concerned about the carbon emissions emitted by the manufacturing industry and believe that the unreasonable energy consumption structure is an important driving force, the contribution of renewable energy use to carbon emissions reduction is less significant than one might think. In this paper, smart grids and the manufacturing industry’s carbon emissions are combined to bridge the gap in emissions reduction strategies.
According to Kaya’s equation (Kaya, 1989), the carbon emissions of the energy-related manufacturing industry is mainly driven by five forces: carbon emissions coefficient, energy structure, energy intensity, economic activities, and industrial scale. This can be expressed as follows:
On the right hand side of Equation 1, the first component could be interpreted as the CO2 emissions coefficient since the CO2 emissions is deflated by the energy consumed in sub-industry i of the manufacturing industry, where j repents the energy types (j = 1,2,…,18). The second component measures the energy structure since the CO2 emissions is deflated by the of energy type consumed in the sub-industry. The third component could be interpreted as the energy intensity. An increase in energy usage technical efficiency will lead to a larger energy intensity change and therefore more of the change in E/Y. The fourth and fifth components measure output per capita and the number of employees in sub-industry i which represent industry activity and industry scale of the sub-industry, respectively.
Using the notations described above, we can rewrite Equation 1 as
According to the LMDI model given by Ang (2005), the total change of carbon dioxide emissions related to energy between the base year 0 and target year t of China’s manufacturing industry can be divided into five driving forces: carbon emissions coefficient (EC) effect, energy structure (ES) effect, energy intensity (EI) effect, economic activity (EA) effect, and industry population (IP) effect. Now that the change of CO2 emissions from the period 0 to t is as follows:
According to the LMDI model given by Ang (2005), the total change of carbon dioxide emissions related to energy between the base year 0 and target year t of China’s manufacturing industry can be divided into five driving forces: EC effect, ES effect, EI effect, EA effect, and IP effect. The specific calculation is as follows:
where
According to the industrial classification of national economic activities (GB/T 4754-2011), the manufacturing industry is divided into 31 sub sectors. Due to the data discontinuity of C42, C43, and C37, this study covers 28 sub-industries of the manufacturing industry. The output value and employment population of manufacturing sub-industries are from China Industrial Statistics Yearbook (2001–2019). The output value is calculated using the constant price in 2000. Energy consumption and carbon dioxide emissions data of the manufacturing industry is from carbon emissions inventory and energy inventory of CEADs. According to the revised China’s carbon emissions factors published in Nature by Liu et al. (2015), the list was compiled with China’s energy statistical yearbook data and widely used by scholars at home and abroad.
In recent years, with the growth of manufacturing output value, the energy consumption and carbon emissions of manufacturing industry are also increasing. In 2000, 28 sub-industries in the manufacturing industry consumed 6.05 million tons of standard coal, which increased to 1977 million tons of standard coal in 2017, an increase of 2.3 times in 18 years. In the same period, CO2 emissions increased from 1365.1 tons to 4608.3 tons, an increase of 2.4 times. Thus, there is a positive correlation between energy consumption and CO2 emissions. Although electricity is the second largest energy source for the manufacturing industry, the ratio of electricity to energy consumption remained low at less than 20%.
From 2000 to 2017, the carbon emissions and energy consumption of the manufacturing industry can be roughly divided into four stages. In the first stage (2000–2005), growth rate of energy consumption and CO2 emissions increased sharply from less than 9% to about 20% while the proportion of electricity in energy consumption decreased. In the second stage (2005–2010), the growth rates were basically controlled within 10%, although they once declined to 4% in 2008. The proportion of electricity continued to shrink. In the third stage (2010–2014), the growth rates were both within 10%, and the ratio of electricity began to increase. In the last stage (2014–2017), the growth rates were both negative, and the proportion of electricity reached 23.8% in 2017.
The 18 types of energy in the energy emissions list fit into six categories: raw coal, coal products, oil, natural gas, and electric and thermal energy. As demonstrated in Figure 1, coal has always been the main source of energy consumed by the manufacturing industry and the largest source of carbon emissions; however, since 2010, the proportion of coal-related carbon emissions has dropped to less than half. Figure 1 indicates that carbon emissions from raw coal reached a peak in 2004 (37%) and then gradually declined, and carbon emissions from coal products have gradually increased from 27 to 37%. It is obvious that electrical power is the second largest source of carbon emissions in the manufacturing industry. Electricity-related carbon emissions accounted for 17–24% of the total emissions from the manufacturing industry between 2000 and 2017, reaching a peak of 24% in 2017. The proportion of oil-related carbon emissions declined after 2000 and then increased again after 2013. The scale of natural gas used by the manufacturing industry is low compared to proportion of other energies used and tends to rise as a whole.
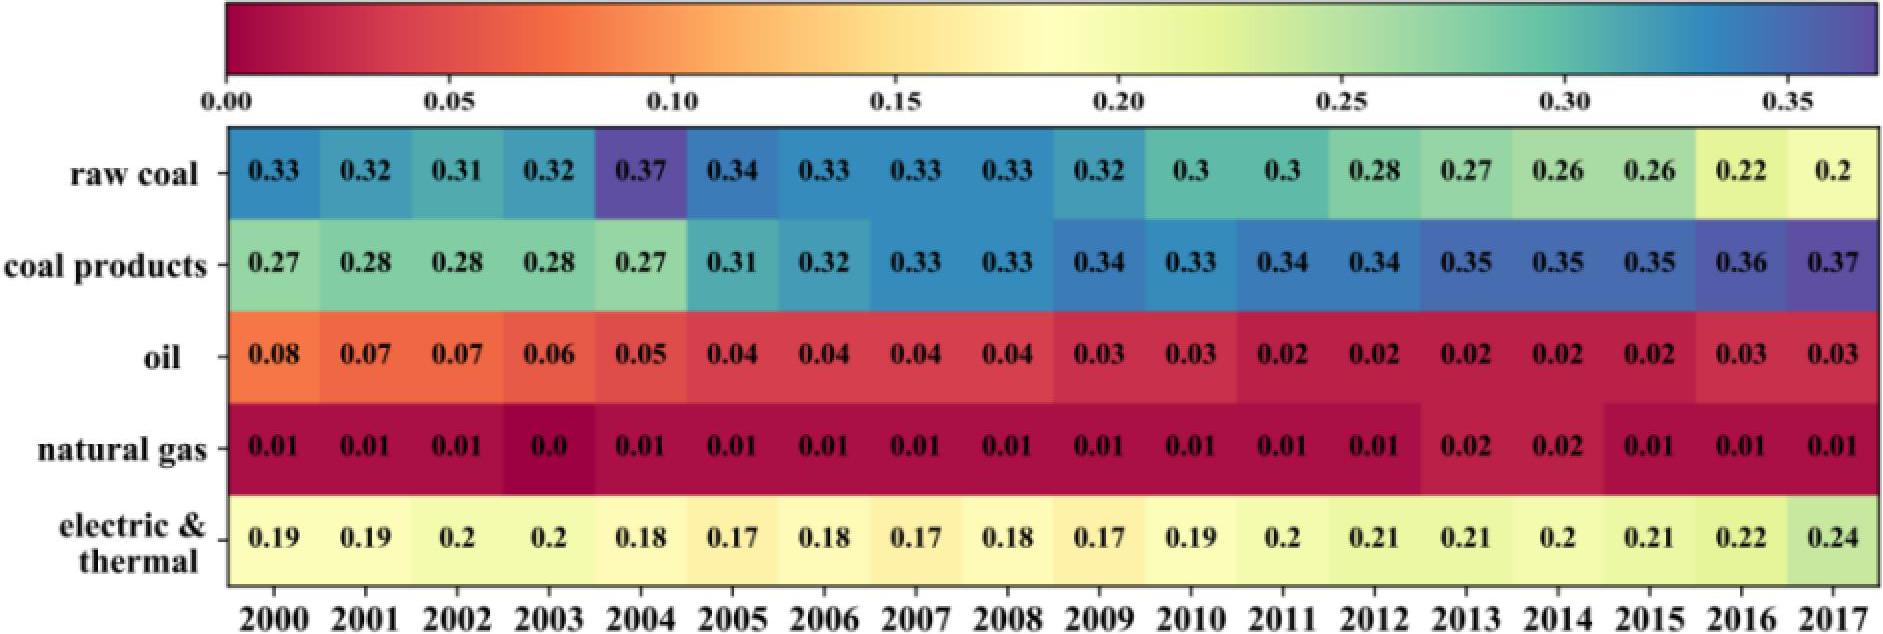
Figure 1. Energy consumption of manufacturing industry in 2000–2017.
China’s energy resource structure is different from developed countries, as it uses a larger amount of coal and lower amounts of low carbon energy resources. In the view of the average level of the world, the proportion of oil, natural gas, and coal is much more equal, that is 34, 24, and 27% respectively. Fossil energy use in America and Europe is dominated by oil and natural gas, while the proportion of coal is only 14 and 13% respectively. However, coal is the most important resource in the electric power industry of China, while the share of nuclear energy, photo-voltaic, wind power, and other non-fossil energy is pretty low.
The CO2 emissions’ intensity of 28 manufacturing sub-industries shows great diversity in 2017. The industry with the highest CO2 emissions intensity is C31 (447 tons/10000CNY), while the industry with the lowest CO2 emissions intensity is C39 (0.04 tons/10000CNY). It is apparent that there are significant differences in CO2 emissions across the 28 sub-industries. Therefore, according to the CO2 emissions intensity, we divide 28 sub-industries into three categories: high emissions intensity industry (HEIs), medium emissions intensity industry (MEIs), and low emissions intensity industry (LEIs). HEIs include C31, C30, C25, C26, and C32. The CO2 emissions of these five industries alone account for 82% of the total emissions of 28 industries. MEIs mainly include C22, C17, C28, and other traditional industries with high energy consumption. LEIs are mainly light industry, i.e., C39 and other high-tech industries. The average emissions intensity of HEIs is 1.99 tons/10000CNY, 5.9 times of MEIs (0.34 tons/10000CNY), and 20.6 times of LEIs (0.1 tons/10000CNY). Therefore, HEIs are the focus of our following research.
In this section, we use the LDMI decomposition model to analyze the main drivers of manufacturing CO2 emission changes in 2000–2017. According to the trend of CO2 emissions from 2000 to 2017, we have conducted research in four stages, namely, 2000–2005, 2005–2010, 2010–2014, and 2014–2017.
During 2000–2017, the CO2 emissions of China’s manufacturing industry increased from 1.617 billion tons to 5.032 billion tons, with an increase of 211%. Figure 2 shows that EA effect and EI effect are the main driving forces for the increase and decrease of CO2 emissions, respectively. Industrialization and urbanization are inferred to for the driving factor behind the expansion of the manufacturing industry and related CO2 emissions since 2000. In terms of CO2 emission reduction, the energy intensity decreased rapidly during 2000–2017. EI effect led to a reduction of 582.83 billion tons of CO2 emissions, accounting for 170.7% of the reduction of CO2 emissions in the manufacturing industry. IP effect accounts for 12.8% of the change of CO2 emissions in the manufacturing industry. The CO2 emissions coefficient of fossil energy is basically constant, and the change mainly comes from the technological progress and the improvement of production efficiency of electric heating production. In the four stages, CO2 emissions increased much more rapidly than in the following years. Among the five influencing factors, EA effect is the most important force behind CO2 emissions.
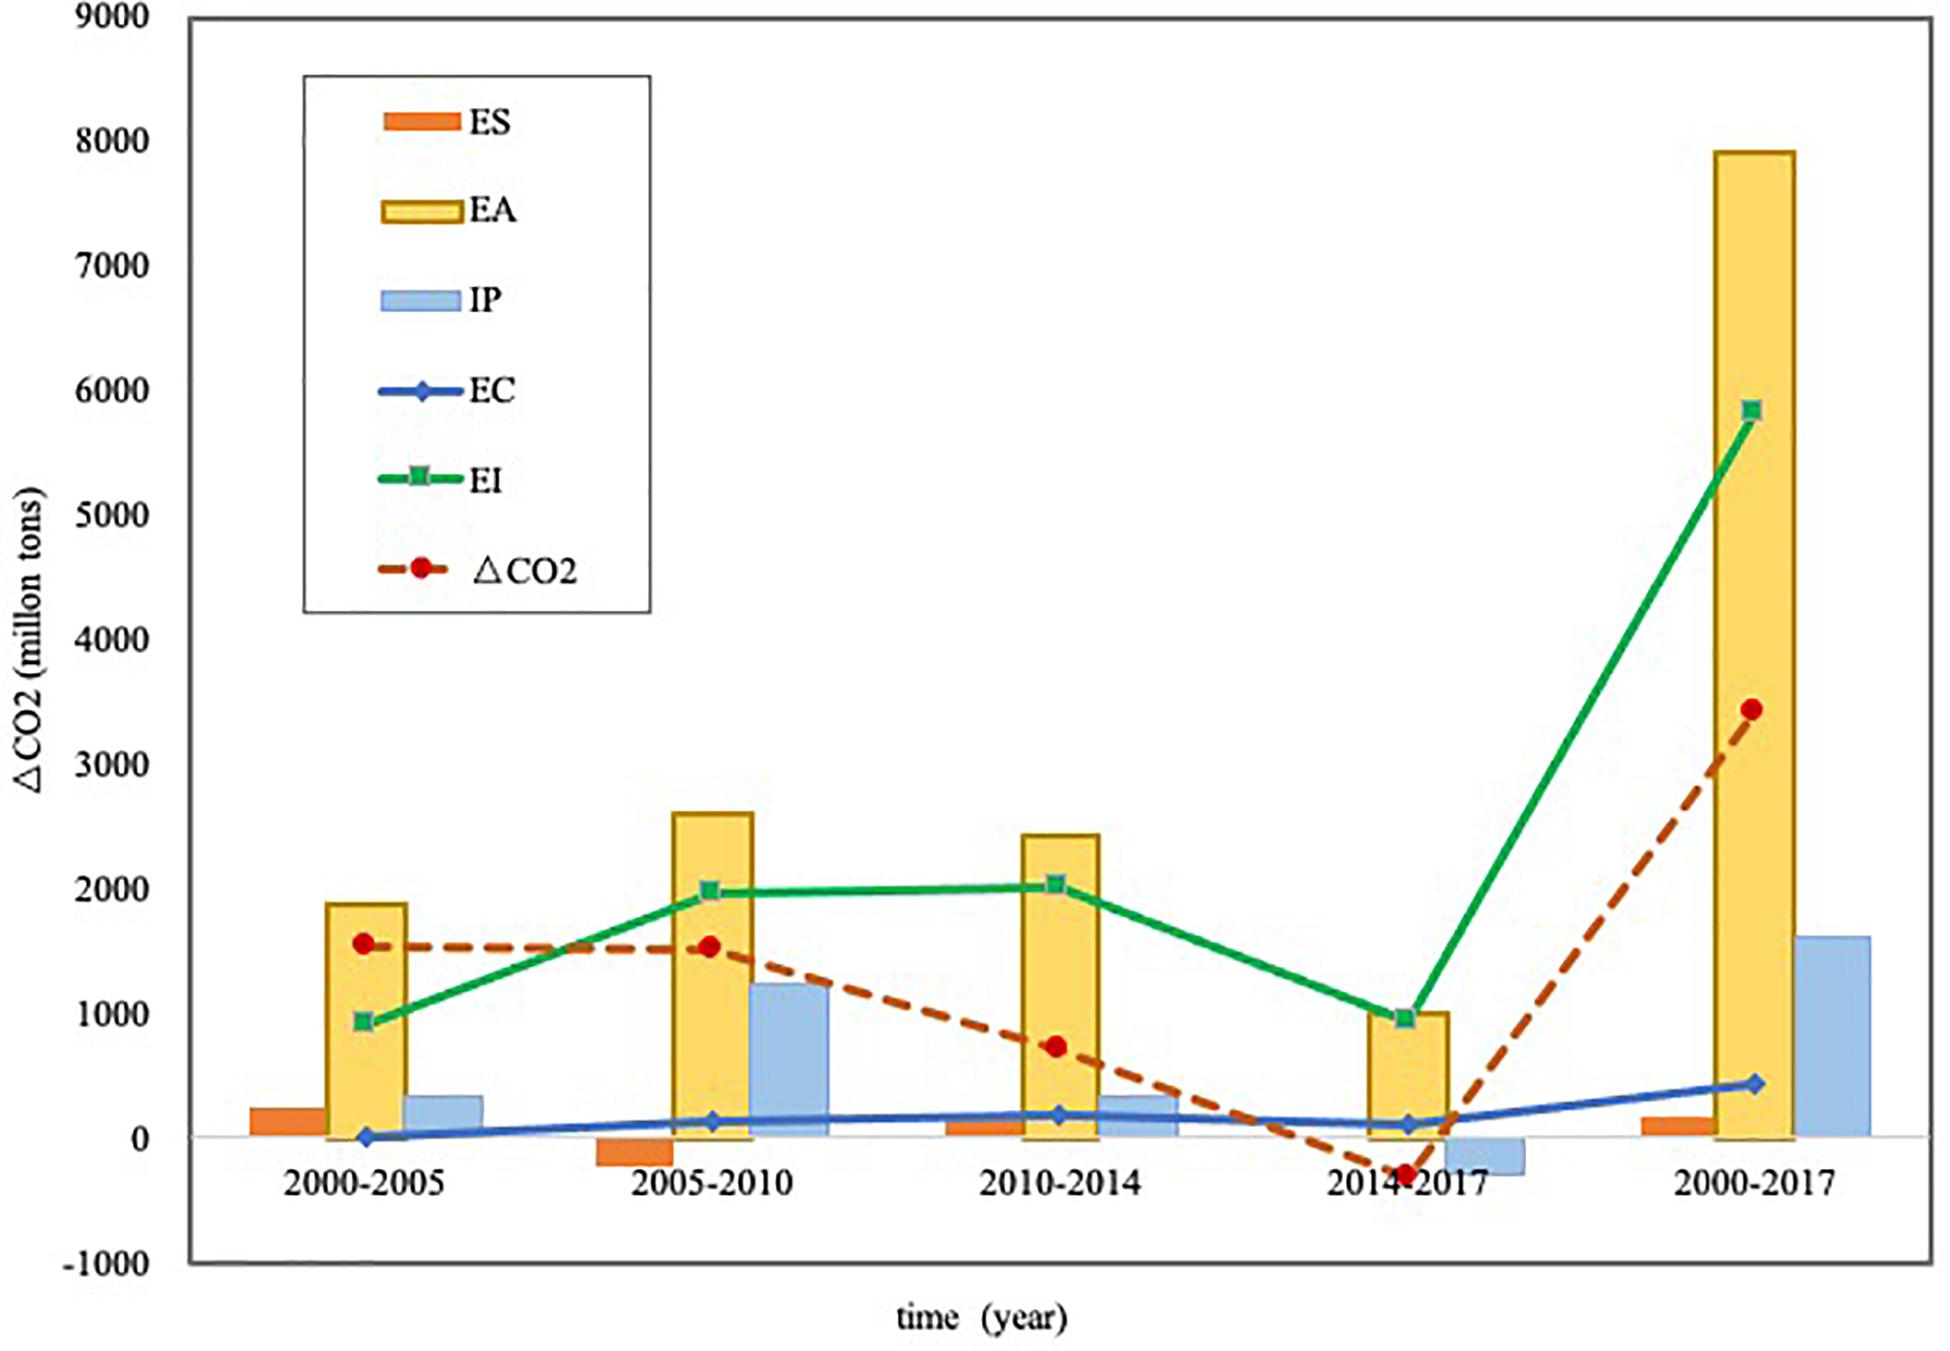
Figure 2. Decomposition result of carbon emission changes in manufacturing industry.
This section decomposes the 28 sub-industries of the manufacturing industry to study their energy-related carbon emissions and explore the main forces driving carbon emissions changes in sub-industries. Although the cumulative contribution of the influencing factors of carbon emissions in each sub-industry varied significantly between 2000 and 2017, the decomposition results from the 28 sub-industries show that the EA effect is the main force increasing carbon emissions, while the EI effect is the main contributor to carbon emissions reduction. As analyzed in the previous section 5.1, HEIs contribute a lot to carbon emissions, hence they are the focus of our following research.
For HEIs, as the rate of urbanization continues to accelerate in China, the demand for raw materials for infrastructure construction keeps increasing in 2000–2017, leading to the rapid development of HEIs and the increase of carbon emissions. As shown in Figure 3, the EC effect had a positive impact on the carbon emissions of HEIs from 2000 to 2017. The ES effect had a negative impact on the carbon emissions of C31 and a positive impact on other HEIs, but the impact was not significant. The EI effect is mainly driven by technological progress and remains relatively limited compared with the EA effect in 2000–2017. The EI effect of C31 reached −2417 million tons, followed by C30, C26, C25, and C32, which accounted for −161, −261.1, −127.9, −175.5, and −14.8 of the total changes in carbon emissions, respectively. The cumulative contribution of the EA effect in C31 is the largest of the 28 sub-industries, accounting for 226.6% of carbon emissions changes. Compared to the impact caused by EA effect, the expansion of the IP effect resulted in 738 million tons of carbon emissions from C31, followed by C30, C26, C25, and C32, which contributed 49.2, 49.9, 33, 44, and 13.3%, respectively.
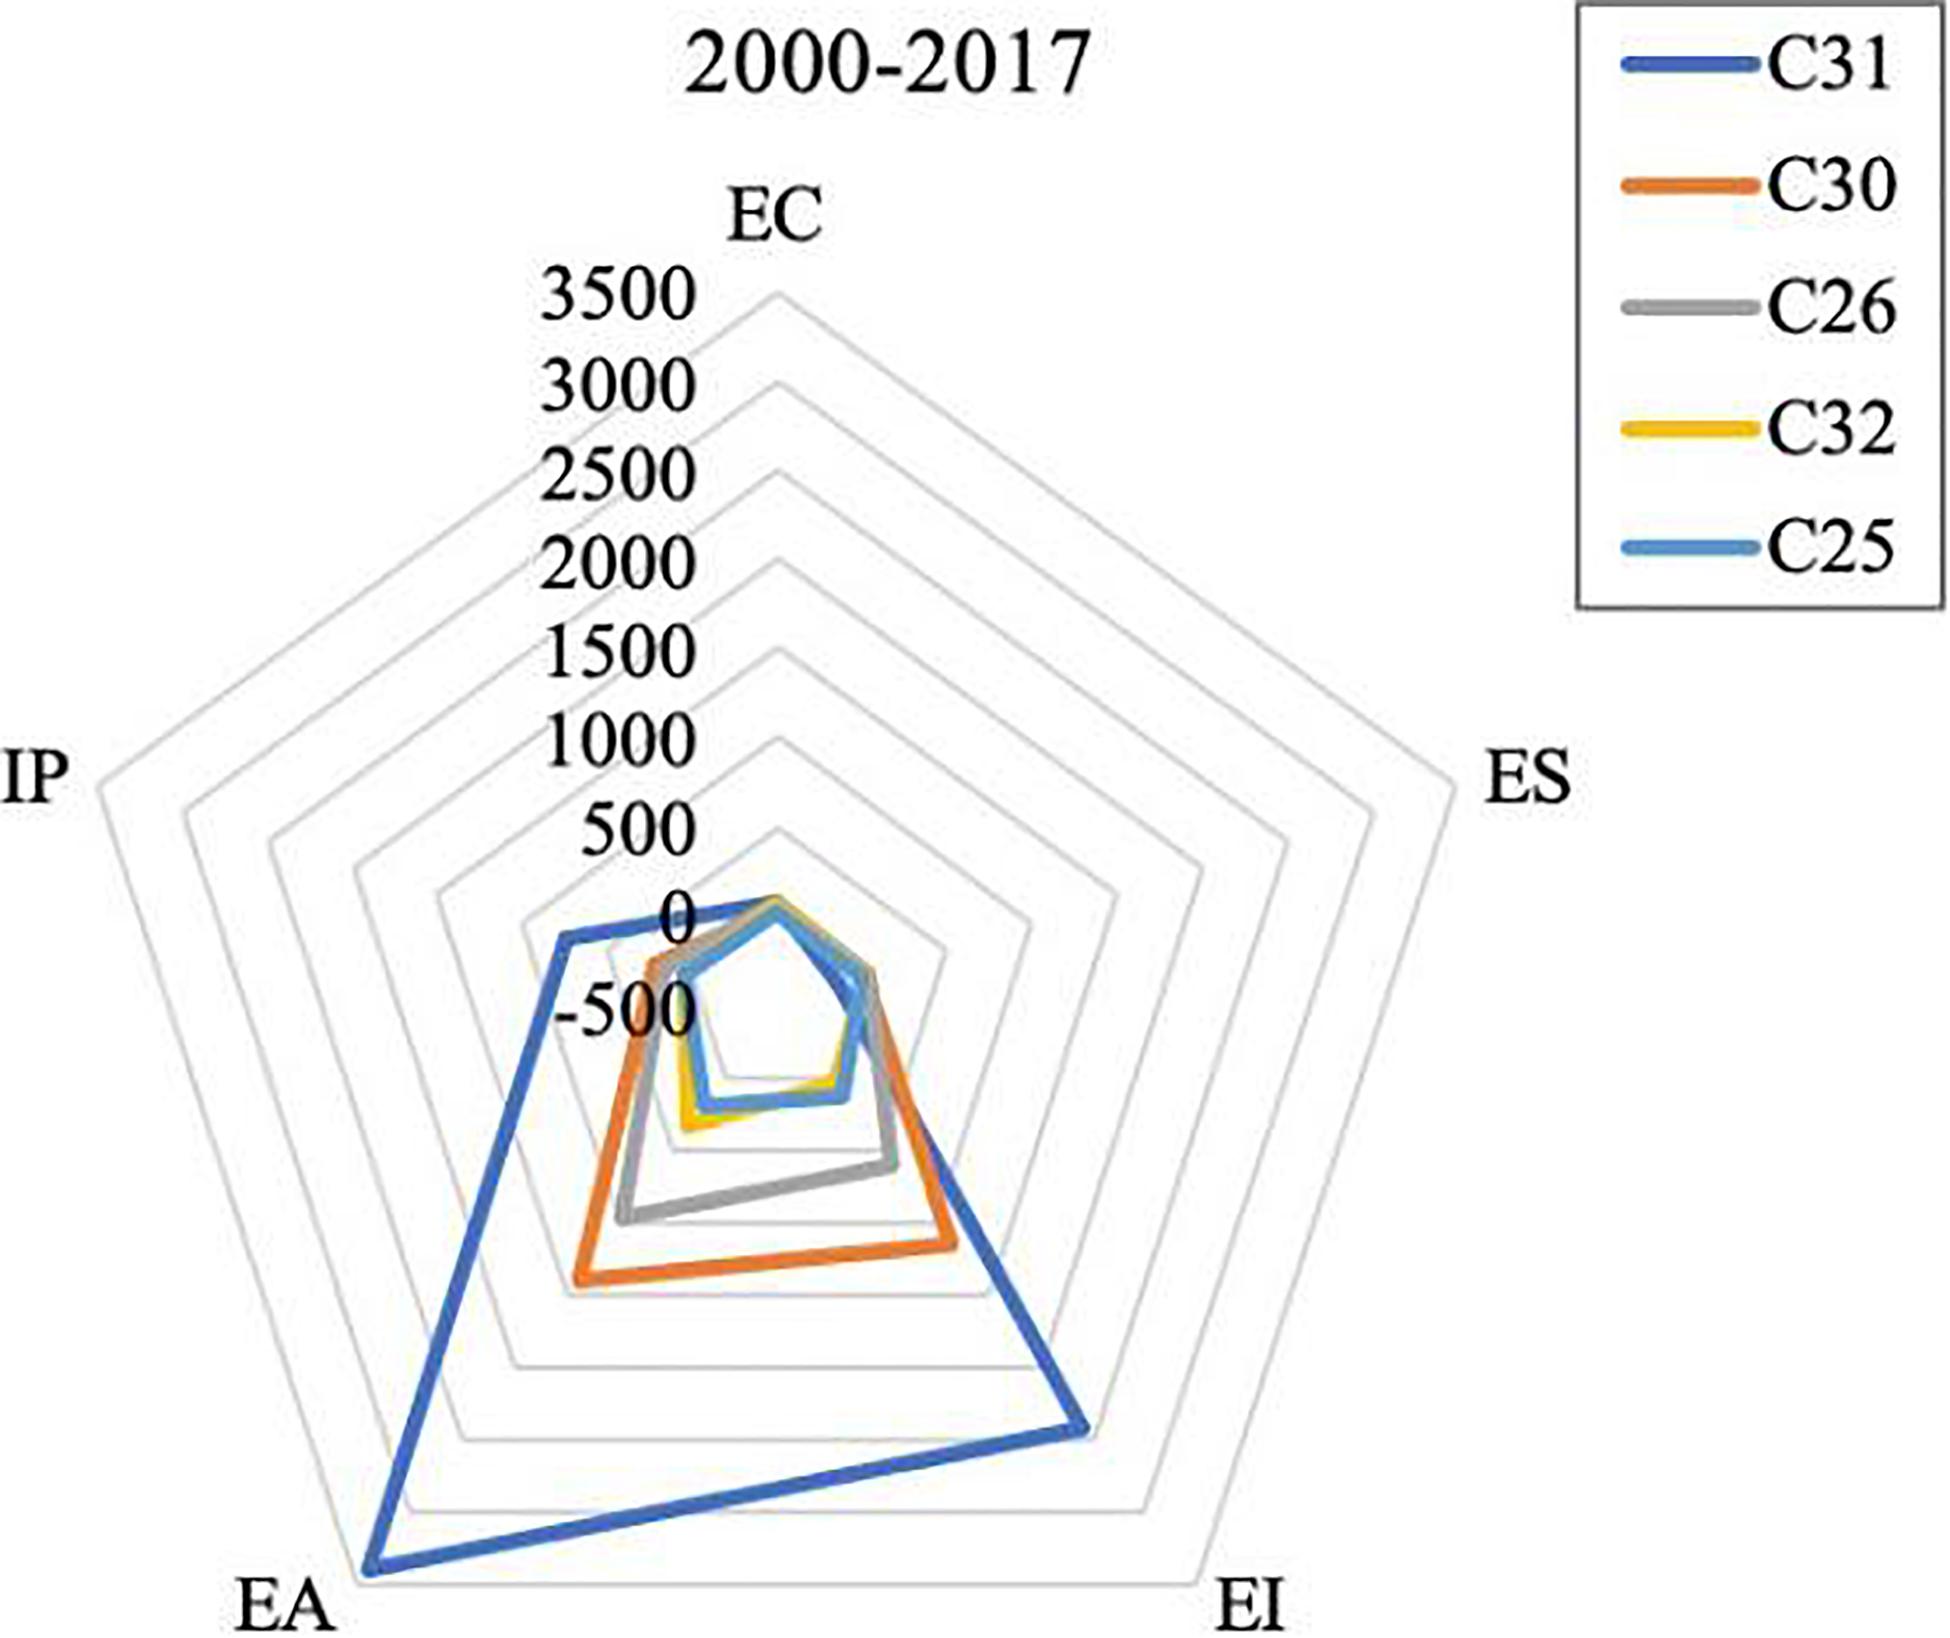
Figure 3. Decomposition result of carbon emission changes in sub-industry.
The EC effect is closely related to the energy consumption structure. By using smart power to produce clean energy, the proportion of thermal power generation can be significantly reduced. According to China’s carbon emissions reduction commitment, the country will strive to achieve carbon neutrality in 2050. The report “2050 World and China Energy Outlook” issued by CNPC research institute points out that China’s energy structure will continue to develop toward clean and low-carbon, clean energy will gradually replace coal after 2030, and the proportion of coal will drop to 47.1 and 32.4%, respectively, in 2030 and 2050. Therefore, based on the energy consumption structure and the carbon emissions produced in 2017 with the calculation formula (9) and (10), we set three scenarios: conservative estimation, normal estimation, and optimistic estimation. In the first scenarios, the raw coal power generation will be reduced by 30% on an existing basis; in the second and third, coal-fired power will be reduced by 50% and 70%, as shown in Table 1.
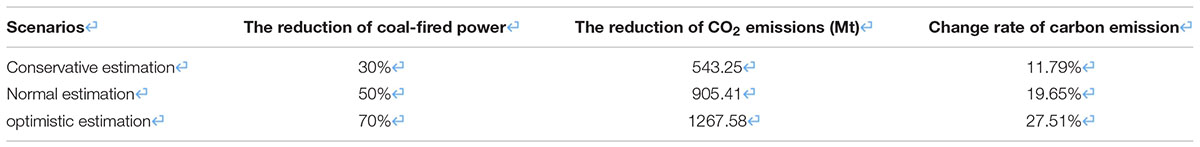
Table 1. Potential of Carbon Emission Reduction of Smart Grid in 2017.
The use of a smart grid can help achieve a better emissions reduction effect. It is conservatively estimated that by applying a smart grid, the carbon emissions will be reduced by 543.25 Mt, which is 12% compared with the carbon emission of 4608.28 Mt in 2017. Under normal and optimistic conditions, carbon emissions will be reduced by 905.41 and 1267.58 Mt, which accounts for 19.65 and 27.51% in the manufacturing industry of 2017. Therefore, using a smart grid has great potential for carbon emissions reduction.
In 2000–2017, the energy structure in which coal was dominant was the main reason for the increase of CO2 emissions. In 2017, CO2 emissions of HEIs accounted for 82% of total CO2 emissions of the manufacturing industry, which are also major coal consuming industries. Economic activity (EA) effect and energy intensity (EI) effect are the main driving forces for the increase and decrease of CO2 emissions in China’s manufacturing industry respectively. Energy structure (ES) effect and industrial population (IP) effect promote the increase of CO2 emissions, while CO2 emissions coefficient (EC) effect alleviates CO2 emissions. As our goal is to maintain green and sustainable development, a feasible way to reduce carbon emissions is to reduce energy intensity and optimize energy structure, rather than reduce economic activities.
Firstly, restrict the development of high energy-consuming industries to reduce carbon emission intensity. It is necessary to implement more stringent threshold access and environmental impact assessment policies for high energy consumption enterprises and to restrict the expansion of the non-metallic mineral products industry and other high emission industries. It is also important to promote high energy consumption industries to continuously improve energy utilization efficiency.
Secondly, make efforts to optimize the energy structure. Gradually reduce the proportion of coal consumption in energy consumption, and control coal, oil, and natural gas in fossil energy consumption to an appropriate level. We should encourage the use of renewable energy sources, such as hydro-power and wind power, and appropriately encourage the development of nuclear power.
Finally, we should develop and use smart grid technology. By using smart grids, we can provide a strong power grid foundation and technical support for power transportation, enhance the strength of power grids, and access large-scale clean and renewable energy. This would then reduce the proportion of electric power, optimize the energy structure, and reduce carbon emissions.
The original contributions presented in the study are included in the article/supplementary material, further inquiries can be directed to the corresponding author/s.
HF is the post-Ph.D. scholar who is mainly responsible for data processing and analysis, using decomposition model for decomposition analysis and thesis writing. YS proposes the research topic and helps with the methodology. YZ contributes to the analysis framework design, data visualization and analysis, and manuscript revision. All authors have read and agreed to publish the current version of the manuscript.
The authors declare that the research was conducted in the absence of any commercial or financial relationships that could be construed as a potential conflict of interest.
The authors would like to thank the experts who attended the IEIS 2020 meeting for their valuable opinions on this manuscript. The draft of this paper was preprinted in the Springer Science and Business Media LLC, 2021 (Fu et al., 2021).
Ang, B. (2005). The LMDI approach to decomposition analysis: a practical guide. Energy Policy 33, 867–871. doi: 10.1016/j.enpol.2003.10.010
Ang, B. W., Xu, X. Y., and Su, B. (2015). Multi-country comparisons of energy performance: the index decomposition analysis approach. Energy Econ. 47, 68–76. doi: 10.1016/j.eneco.2014.10.011
Cai, B., and Guo, H. (2018). Local strategies for China’s carbon mitigation: an investigation of Chinese city-level CO2 emissions. J. Clean. Prod. 178, 890–902. doi: 10.1016/j.jclepro.2018.01.054
Darby, S., Strömbäck, J., and Wilks, M. (2013). Potential carbon impacts of smart grid development in six European countries. Energy Effic. 6, 725–739. doi: 10.1007/s12053-013-9208-8
Fu, H., Shi, Y., and Liu, J. (2021). “Research on the driving forces of carbon emissions in China’s manufacturing industry: a multi-sector decomposition analysis,” in IEIS 2020 Proceedings of the 7th International Conference on Industrial Economics Systems and Industrial Security Engineering, eds M. Li, G. Bohács, G. Hua, D. Gong, and X. Shang (Singapore, FL: Springer Singapore), 35–46.
Fu, L., Zhao, H., and Guo, S. (2012). An analysis on the low-carbon benefits of smart grid of China. Physics Procedia 24, 328–336. doi: 10.1016/j.phpro.2012.02.049
Kaya, Y. C. (1989). Impact of Carbon Dioxide Emission on GNP Growth: Interpretation of Proposed Scenarios, Presentation to the Energy and Industry Subgroup, Response Strategies Working Group. Paris: IPCC.
Lamiaa, A., and Tarek, E. (2013). Reducing carbon dioxide emissions from electricity sector using smart electric grid applications. J. Eng. 2013, 845–853. doi: 10.1155/2013/845051
Li, J., and Cheng, Z. (2020). Study on total-factor carbon emission efficiency of China’s manufacturing industry when considering technology heterogeneity. J. Clean. Prod. 260:121021. doi: 10.1016/j.jclepro.2020.121021
Li, Y., Wang, C., Li, G., and Chen, C. (2021). Optimal scheduling of integrated demand response-enabled integrated energy systems with uncertain renewable generations: a Stackelberg game approach. Energy Convers. Manag. 235:113996. doi: 10.1016/j.enconman.2021.113996
Lin, B., and Du, K. (2014). Understanding the change of energy intensity in China: a comprehensive decomposition framework. World Econ. 4, 69–87.
Liu, Z., Guan, D., Wei, W., Davis, S. J., Ciais, P., Bai, J., et al. (2015). Reduced carbon emission estimates from fossil fuel combustion and cement production in china. Nature 524, 335H–338H. doi: 10.1038/nature14677
Shi, Y., Han, B., Zafar, M. W., and Wei, Z. (2019). Uncovering the driving forces of carbon dioxide emissions in Chinese manufacturing industry: an intersectoral analysis. Environ. Sci. Pollut. Res. 26, 31434–31448. doi: 10.1007/s11356-019-06303-7
Sun, L., Wang, Q., Zhou, P., and Cheng, F. (2016). Effects of carbon emission transfer on economic spillover and carbon emission reduction in China. J. Clean. Prod. 112, 1432–1442. doi: 10.1016/j.jclepro.2014.12.083
Tan, R., and Lin, B. (2018). What factors lead to the decline of energy intensity in China’s energy intensive industries? Energy Econ. 71, 213–221. doi: 10.1016/j.eneco.2018.02.019
Xu, J., Fleiter, T., Eichhammer, W., and Fan, Y. (2012). Energy consumption and CO2 emissions in China’s cement industry: a perspective from LMDI decomposition analysis. Energy Pol. 50, 821–832. doi: 10.1016/j.enpol.2012.08.038
Xu, R., and Lin, B. (2017). Why are there large regional differences in carbon emissions? Evidence from China’s manufacturing industry. J. Clean Prod. 140, 1330–1343. doi: 10.1016/j.jclepro.2016.10.019
Keywords: smart grid, distributed energy resources, CO2 emission, manufacturing industry, electricity, LMDI
Citation: Fu H, Shi Y and Zeng Y (2021) Estimating Smart Grid’s Carbon Emission Reduction Potential in China’s Manufacturing Industry Based on Decomposition Analysis. Front. Energy Res. 9:681244. doi: 10.3389/fenrg.2021.681244
Received: 16 March 2021; Accepted: 19 April 2021;
Published: 30 June 2021.
Edited by:
Liang Chen, Nanjing University of Information Science and Technology, ChinaReviewed by:
Xiaoying Wang, University of Calgary, CanadaCopyright © 2021 Fu, Shi and Zeng. This is an open-access article distributed under the terms of the Creative Commons Attribution License (CC BY). The use, distribution or reproduction in other forums is permitted, provided the original author(s) and the copyright owner(s) are credited and that the original publication in this journal is cited, in accordance with accepted academic practice. No use, distribution or reproduction is permitted which does not comply with these terms.
*Correspondence: Yingying Shi, c2hpeWluZ3lpbmcwNkAxMjYuY29t
Disclaimer: All claims expressed in this article are solely those of the authors and do not necessarily represent those of their affiliated organizations, or those of the publisher, the editors and the reviewers. Any product that may be evaluated in this article or claim that may be made by its manufacturer is not guaranteed or endorsed by the publisher.
Research integrity at Frontiers
Learn more about the work of our research integrity team to safeguard the quality of each article we publish.