
94% of researchers rate our articles as excellent or good
Learn more about the work of our research integrity team to safeguard the quality of each article we publish.
Find out more
ORIGINAL RESEARCH article
Front. Energy Res. , 02 June 2021
Sec. Nuclear Energy
Volume 9 - 2021 | https://doi.org/10.3389/fenrg.2021.677865
This article is part of the Research Topic Reactor Fuels, Materials and Systems under Extreme Environments View all 29 articles
 Yisheng Hao1
 Junyi Chen1
 Hao Luo1Xiaoyu Guo1
 Minyun Liu1,2
 Shanfang Huang1*Kan Wang1
 Houjun Gong2Yang Li2Yuwen Hu2Chuan Lu3
As an important strategy to mitigate severe accidents, the in-vessel retention (IVR) technique has been applied to the new generation of pressurized water reactor (PWR). However, under IVR conditions, the decay heat distribution in the molten pool is very uncertain because of the complexity of the molten pool and the calculation method limitations. To explore the calculation method and distribution of the decay heat of lower head molten pool under IVR conditions, the decay heat calculation method is developed based on Reactor Monte Carlo Code (RMC). The verification results show that the relative error of calculation result is generally within ± 0.25%. In addition, geometric modeling for lower head molten pools has been carried out, and distribution of the decay heat in two-layer and three-layer structures has also been accurately calculated. The calculation results indicate that the decay heat power spatial distribution is relatively uniform in the two-layer molten pool structure. The decay heat power at the center of the lower head decreases from 0.71°
In-Vessel Retention (IVR) technology is an important strategy for serious accident mitigation. It arrests relocated molten core materials in the vessel during the severe accident and has been singled out as an appealing accident management approach to many reactors(Theofanous, 1989; Su, 2016). The specific process of IVR technology is as follows. During the severe accident in PWR, the core melts if it cannot be effectively cooled. The melting core relocates to the lower head of the pressure vessel and then forms a liquid molten pool with a variety of pool configurations. Since the IVR strategy confines all the fission products in the vessel, complex ex-vessel severe accident phenomena can be avoided.
At present, a commonly used method to achieve IVR is by carrying out External-Reactor-Vessel-Cooling (ERVC) strategy to remove the in-vessel decay heat and ensure the vessel integrity by fully depressurizing Reactor Coolant System (RCS) and flooding the cavity to the designed elevation. When ERVC occurs, the single-phase convective heat transfer and boiling heat transfer outside the pressure vessel will carry away most of the decay heat of the molten pool and ensure the integrity of the pressure vessel. The schematic diagram of the IVR + ERVC combination strategy is shown in Figure 1.
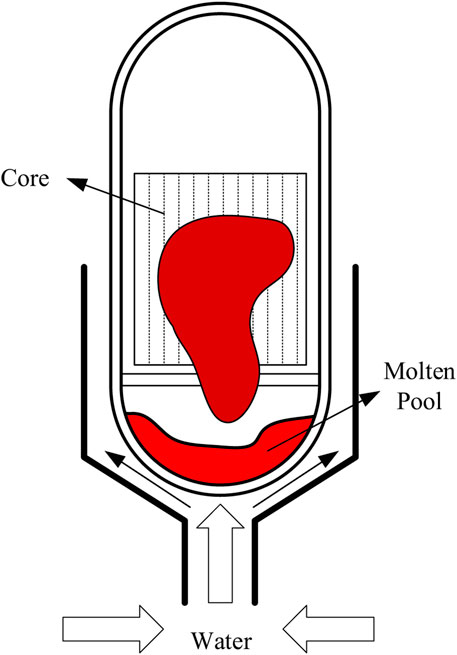
FIGURE 1. Schematic Diagram of In-vessel Retention (IVR) Technology.
In Figure 1, the heat transfer imposed by the in-vessel molten pool is a vital part of IVR success, considering the difficulty of significantly altering ex-vessel CHF. However, the boiling crisis will occur when the current heat flux is higher than the CHF, which will lead to the rapid rise of the temperature on the lower head and even cause pressure vessel failure. Therefore, the IVR safety strategy requires that the decay heat of the molten pool must be taken away via a cooled vessel wall. To learn a modest safety margin of IVR strategy, the physical phenomena like heat transfer characteristics relevant to IVR must be studied systematically and methodically to ensure the heat flux imposed by the molten pool is below the CHF of a water-cooled vessel wall, which is known as thermal criteria.
Given the heat transfer characteristics of the lower head, many studies have been conducted in the past decades, such as COPO(Kymäläinen et al., 1994; Helle et al., 1999), BALI(Bonnet, 1999), SIMECO(Stepanyan et al., 2004; Sehgal et al., 2004), ACOPO(Theofanous et al., 1997), RASPLAV(Theofanous et al., 1997; Asmolov, 2000; Asmolov, 1999), COPRA(Zhang et al., 2019) , LIVE-L4(Miassoedov et al., 2007) , etc. The concept of realizing IVR through ERVC was first proposed by Condon in 1982(Wichner et al., 1983). Ronge's Sultan experiment(Rouge, 1997), Chu et al.'s CYBL experiment(Chu et al., 1997), Cheung et al.'s SBLB experiment(Cheung et al., 1997), and Theofaneous et al.'s ULPU experiment(Theofanous et al., 1994; Theofanous et al., 1994) gives more investigations on ERVC technology. Currently, the internationally famous experiments are listed in Table 1.
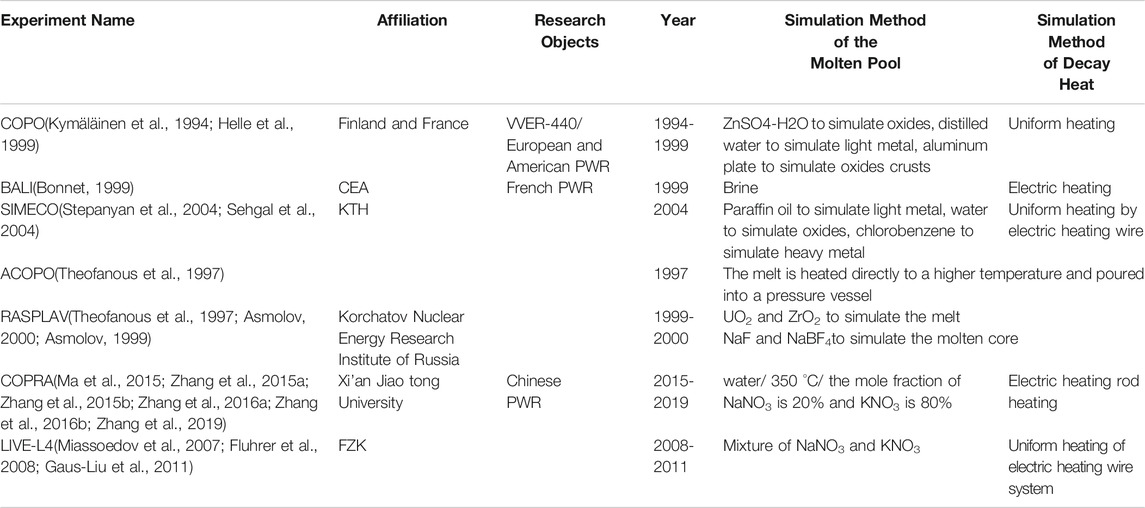
TABLE 1. Experimental Study on Heat Transfer Characteristics of Molten Pool under IVR Condition.
From Table 1, the previous study of the IVR has several basic deficiencies. First, the experiments often used water or liquid mixture as a substitute for the molten pool and used electric heated wires or rods to carry out uniform heating. The simulations cannot reflect the actual physical process in the lower head. Secondly, there is no calculation or estimation of the decay heat generation and its temporal and spatial distribution in the lower head. Therefore, the above experiments have not comprehensively proposed an analysis methodology that is sufficient enough to quantify molten pool characteristics and support subsequent heat transfer analysis.
In terms of calculation methods, due to the complexity of the physical and chemical characteristics of the molten pool, it is almost impossible to calculate the decay heat through the theoretical analysis method, making the estimation of the inner heat load of the lower head greatly uncertain. Besides, the existing methods for calculating the decay heat are also limited, and the existing programs for calculating the decay heat are often unable to deal with the problem of calculating the large-scale burnup in engineering. For that reason, there are few studies on the heat distribution of decay heat generation in the lower head after core-melting. Therefore, the evaluation of the IVR strategy lacks unified results.
At present, the commonly used decay heat calculation standard is ANSI / ANS-5.1 (ANSI/ANS, 2005) issued by the United States, and the relevant domestic standards (e.g., NB / T 200056-2001(Nuclear Industry Standardization Institute China Institute of Atomic Energy, 2011) ) are also based on their calculation methods. In the latest ANSI / ANS-5.1 2005 edition, the decay heat calculation formula is as follows.
In the formula, The reactor shuts down after running for
Although the decay heat calculation standard provides an available calculation method for calculating the decay heat in the molten pool, the spatial distribution and decay power of each element are usually unknown in the calculation of the decay heat in the IVR. And in this calculation standard, a large number of approximate and simplified methods (e.g., the transuranic element only considers the
To solve the above problems, based on the Depth program coupled with Monte Carlo code RMC, this paper has developed the decay heat calculation function. The program has realized the function of large-scale grid element decay heat calculation and can output a variety of decay heat information. It can be used for lots of scenarios like reactor shutdown, molten pool calculation. In this paper, the BEAVRS benchmark(Horelik et al., 2017) is taken to validate the decay heat generation of molten pool in the lower head with time and space by using the above calculation program.
The reactor shutdowns after running for
However, this formula can only be used to roughly estimate the decay heat power at certain times after the reactor shutdowns, and it is completely impossible to accurately calculate the decay heat distribution of the molten pool in the lower head
This work developes the new feasible method to analyze the decay heat generation of the molten pool in the circumstance of severe accident with Monte Carlo code RMC based on the BEVARS benchmark. RMC is used for molten pool configurations modeling and criticality calculation and the decay heat generation is also obtained using the DEPTH program. Furthermore, a comparison has been made between this work and previous results to validates the method.
At present, the commonly used decay heat calculation program is represented by the ORIGEN-S program developed by ORNL Laboratory(Hermann and Westfall, 2011) . The ORIGEN-S program couples an external third-party interface to the Monte Carlo program (such as MCNP) and completes data transmission by reading the output file while generating input files. However, as this coupling method cannot go deep into the bottom of the Monte Carlo transport module for method improvement and efficiency optimization, there is a general lack of computing power for large-scale burnup problems. When there are more burnup zones, it is impossible to accurately calculate the burnup information of the whole molten pool.
The DEPTH program(She, 2013) was developed by the REAL team of Tsinghua University. Based on the Monte Carlo program RMC (She et al., 2010; Wang et al., 2011), the internally coupled burnup calculation and decay heat calculation functions were realized. The large-scale burnup calculation ability (such as the automatic expansion of the repetitive structure burnup zone, the large-scale parallel efficiency optimization of the Monte Carlo, and the parallel calculation of the ignition burnup) could be used to calculate the whole PWR burnup and other examples.
Because of the common decay heat calculation requirements in reactor shutdown and molten pool scenarios, this paper proposes the corresponding decay heat calculation method based on the DEPTH program coupled with the Monte Carlo code RMC, which enriches the functional modules of the RMC program. Besides, as the RMC program being the completely independent intellectual property rights of the domestic Monte Carlo program, the development of the decay heat calculation module is of great significance to break the monopoly of foreign computing software.
The flow chart of decay heat calculation in the DEPTH program is as Figure 2.
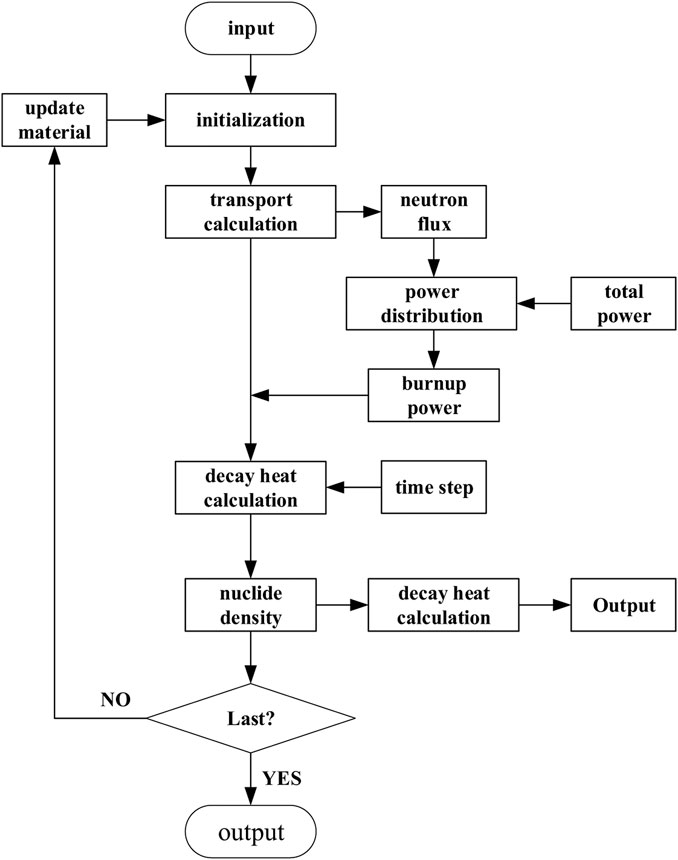
FIGURE 2. Flow Chart of Decay Heat Calculation Program.
In the DEPTH program, first of all, the transport calculation is needed to obtain the neutron flux in the lower head, and the power distribution is carried out according to the total power to obtain the power of each burnup zone. Then, in each time step, the burnup is calculated for the decay reaction to obtain the nuclide density in the burnup zones. Finally, the decay heat in the burnup zones is calculated with the formula below:
where
Compared with the existing methods, the method proposed in this paper has the following innovative points: 1. Compared with the existing ORIGEN-S program, it realized the parallel decay heat calculation of the large-scale burn-up area, and achieved the precise distribution result of the decay heat release inside of the lower head by calculation; 2. The decay heat release was calculated by Monte Carlo method, which is more accurate than the empirical formula methods that are commonly used.
When a severe accident happens, the core is completely exposed and melted, and then the melt penetrates the core bottom plate. Finally, various elements are redistributed in the lower head of the pressure vessel, and a molten pool is formed. Figure 3 shows the calculation flow chart of the decay heat of the molten pool in this paper. The specific process is shown as follows:
(1) Calculation of total density of core nuclides. The total nuclide density of all fission products in the core is obtained through the calculation of the whole core burnup. In this paper, the total burnup of commercial nuclear power reactors described in the BEAVRS benchmark is calculated by using the Monte Carlo program RMC and the TianHe II supercomputing platform. The total nuclide density of fission products in the core is obtained. The calculation time of the reactor is 85°days, and the thermal power of the reactor core is 3411MW, which is divided into 520,000 burnup zones. In addition, calculating the total nuclide density of control rods and other core structural parts refer to the BEAVRS benchmark manual.
(2) Extract important nuclide density. The DEPTH program can output the density information of 1487 nuclides in the burnup chain. However, previous studies have shown that about 50 nuclides can envelope more than 95% of the decay heat contribution after shutdown(Li et al., 2014) . Therefore, in this paper, only the 50 nuclides that contribute greatly to the decay heat, as well as the main heavy isotopes and fission products in the main burnup chain are considered. And the zirconium-water reaction was not considered in this paper.
(3) Calculation of the specific volumes of three layers is based on several assumptions. In this paper, it is assumed that the oxidation degree of the zirconium claddings is 0.5, the molten pool is well-mixed the moment it falls into the lower head, and the densities of each component in the molten pool are consistent. Based on the phase diagram and researches on previous studies, the mass of the main components in each layer is obtained, and herein the volumes and thickness are also determined(Liu et al., 2019) (Liu et al., 2019) .
(4) Calculation of nuclide density in each layer of the molten pool. In this paper, it is assumed that the atomic number of each nuclide in the lower head at the initial time is equal to the value of the core burnup calculation of the end time. Because the decay heat generated will decrease with time, so this assumption can simulate the maximum decay heat power released by the molten pool of the lower head, which is helpful to improve the margin of IVR strategy safety analysis.
(5) Modeling molten pool in the lower head. According to the structure and size of each layer in the molten pool of the lower head of the reactor, the molten pool of the lower head is modeled in the Monte Carlo code RMC based on the important nuclide density calculated in the previous step. Then, dividing the molten pool into an approximate number of burnup zones along the radius direction, height direction and circumference direction, in order to accurately calculate the decay heat generated in the molten pool.
(6) Calculation of decay heat of the molten pool. The DEPTH program was used to calculate the decay heat power distribution in the molten pool.
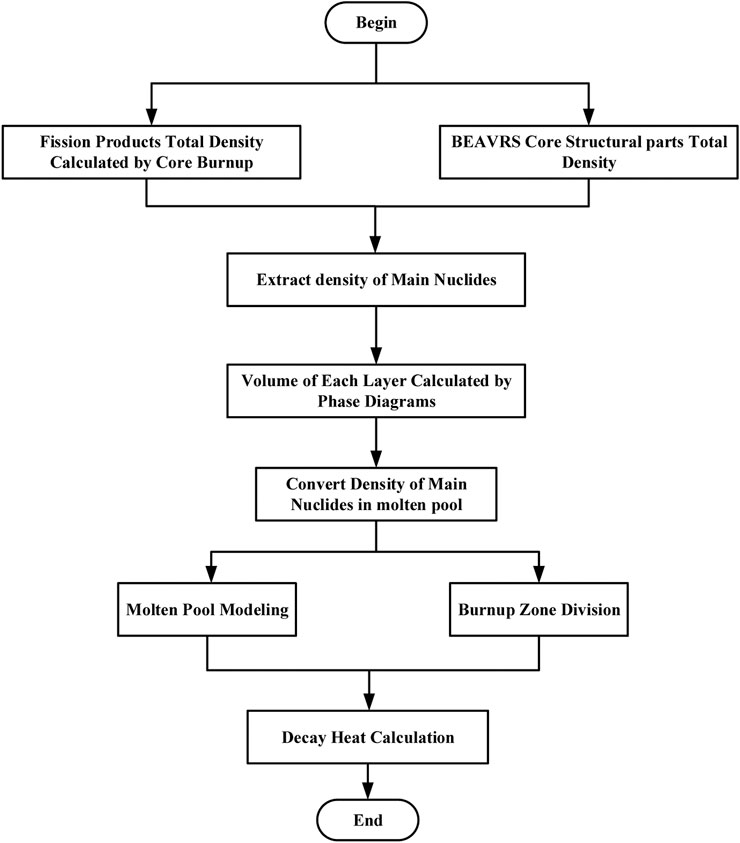
FIGURE 3. Decay Heat Calculation Process in this work.
In the previous IVR safety strategy analysis, it is generally believed that the structure of the molten pool in the lower head is a two-layer model(Theofanous et al., 1996) . That is, the light metal layer is located above the oxide layer. However, the MASCA project carried out by Russian research center of Kurchatov institute has revealed that the physical-chemical interactions in the molten may cause participation of metallic uranium and zirconium initially located in the oxide phase. The change of density of stratification will lead to sinking of heavy metal layer. Previous experiments have found that, a great amount of uranium element is extracted by unoxidized zirconium form oxidic phase to metallic phase. With the increment in density of metallic phase, it sinks and be located below the oxide phase, thus forming a three-layer corium pool (Kim and Olander, 1988; Hayward and George, 1996). So the above-mentioned two-layer molten pool model cannot completely envelope the possibility of occurrence(Parker et al., 1990) and INEEL proposed a more enveloping three-layer melt configuration based on the two-layer one(Gu et al., 2017) (Tsurikov et al., 2007) . In this configuration, the heat flux distribution is different from that of the two-layer molten pool structure, resulting in changes in the safety margin for the IVR scheme. So, the two configurations need to be analyzed separately. Figure 4 shows two kinds of molten pool structures.
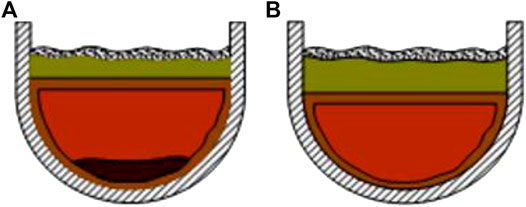
FIGURE 4. Diagram of Two Molten Pool Structure. (A) Two-layer Molten Pool (B) Three-layer Molten Pool.
As shown in Figure 4A, in the three-layer molten pool model, the components of the oxide layer and the light metal layer are the same as those in the two-layer molten pool model. The difference is that the elements in the partial oxide layer and the metal layer will enter the bottom of the oxide layer after the reaction, forming a heavy metal mixture layer.
As shown in Figure 4B, in the two-layer molten pool model, the pool can be divided into the bottom oxide layer and the top light metal layer. The light metal layer consists of stainless steel and unoxidized zirconium, and the oxide layer consists of uranium and zirconium oxides.
For the two-layer and three-layer structures of the molten pool, this paper uses the geometric module of the RMC program to carry out the three-dimensional modeling. It divides the burnup zones of the light metal layer, oxide layer, and heavy metal layer in the two-layer and three-layer structures of the molten pool to accurately calculate the decay heat power distribution inside the molten pool of the lower head.
According to the above hierarchical model of the molten pool, the components and heights of each layer need to be obtained first. In the molten pool, the main components are the core fuel and the melts of structural components in the core, which form the U-Zr-O multivariate system after the core melts. Assuming that the density of each component is constant in the melting process and the molten pool is instantaneously uniform, the components of each layer can be obtained by multivariate phase diagram analysis (Chevalier et al., 2004), and then the volume of each layer can be calculated by the density of each component.
The heights of each layer can be obtained by a multivariate phase diagram as shown in Table 1. And the material components and typical nuclides of each layer are shown in Table 2. This stratification is based on the following assumptions:
1. The main components of the light metal layer are Zr and stainless-steel SS;
2. The main components of the oxide layer are UO2 and ZrO2;
3. The main components of the heavy metal layer are U and Zr;
4. The Ag-In-Cd elements and fission products in the control rod are uniformly distributed in the oxide layer and the heavy metal layer.
TABLE 2. Material Mass Calculation of Core Structure in BEAVRS.
In this paper, the three-dimensional modeling of the two-layer and three-layer molten pool structures (Figure 4) is carried out by using the RMC program, and the light metal layer, heavy metal layer, and oxide layer in the molten pool structure are divided into burnup zones, to accurately calculate the decay heat power distribution inside the molten pool. The components of each layer and typical nuclides are shown in Table 3, 4:
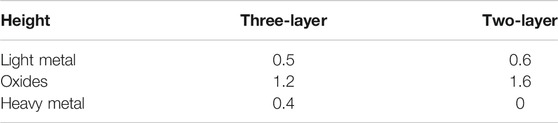
TABLE 3. Molten Pool Stratification Height
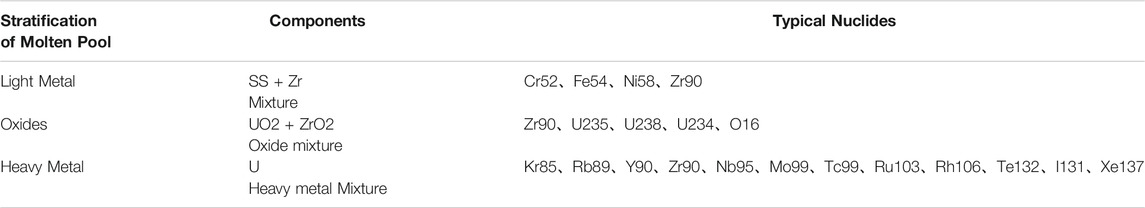
TABLE 4. Composition and Typical Nuclides of Three-layer Molten Pool Materials
To accurately calculate the decay heat generated in the molten pool, it is necessary to finely divide the molten pool into an approximate number of burnup zones. In this paper, the molten pool of the lower head is first stratified with each 10°cm along the Z-axis height direction. So, for the three-layer pool, the light metal layer is divided into five layers; The oxide layer is divided into 12 layers; The heavy metal layer is divided into four layers. Each layer is divided into 11 layers along the radius direction and 18 layers along the circumference direction. Finally, the light metal layer is divided into 990 burnup zones; the oxide layer is divided into 2016 burnup zones; The heavy metal layer is divided into 288 burnup zones, and the complete partition and filling of the light metal layer, oxide layer, and heavy metal layer in the three-layer molten pool model are then realized.
For the two-layer molten pool, the light metal layer is divided into six layers; The oxide layer is divided into 16 layers. Each layer is divided into 11 layers along the radius direction and 18 layers along the circumference direction. Finally, the light metal layer is divided into 1288 burnup zones; The oxide layer is divided into 2304 burnup zones. The complete partition and filling of the oxide layer and heavy metal layer in the two-layer molten pool model are then realized.
By calculating the decay heat generated in each burnup zones in the molten pool, the complete spatial distribution of the decay heat release in the lower head can be obtained. Figure 5 is the side views and overlooking view of the molten pool model.
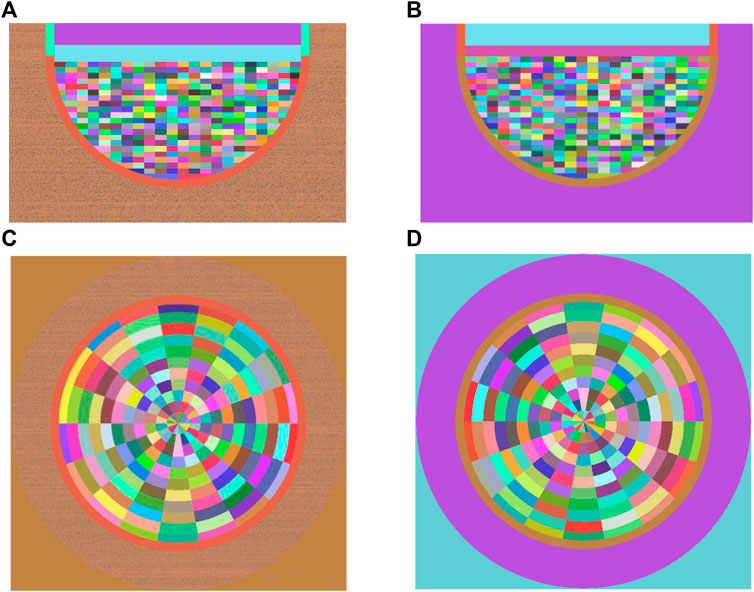
FIGURE 5. Sectional View of Burnup Zones of Molten Pool Model. (A) Side View of Three-layer Molten Pool (B) Side View of Two-layer Molten Pool. (C) Top View of Three-layer Molten Pool (D) Top View of Two-layer Molten Pool.
To validate the decay heat calculation function, the researchers used DEPTH and ORIGEN-2 to calculate the nuclear density and decay heat of all the main products of 237Np after 106°years’ decay(She, 2013) . To facilitate the comparison of calculation results, both programs applied the decay database of ORIGEN-2.
Table 5 shows the comparison of the decay calculation results of 237Np by DEPTH and ORIGEN-2. The relative error of the calculated decay heat of DEPTH and ORIGEN-2 fluctuates within ± 0.25%. The maximum relative error in the entire decay chain is - 1.14%, which was produced by the last nuclide 209Bi in the decay chain.
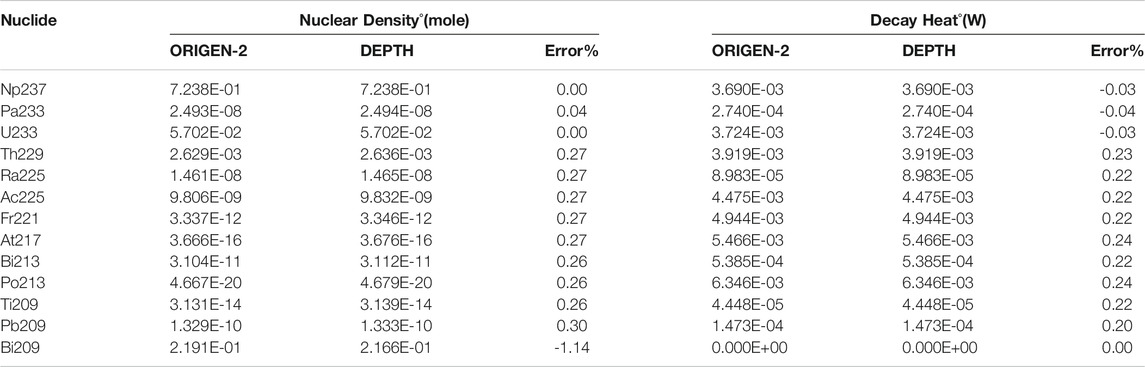
TABLE 5. Calculation Results of 237Np Pure Decay Process(She, 2013)
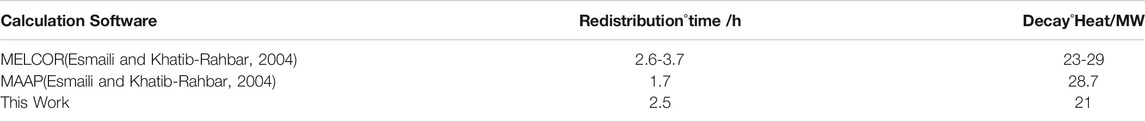
TABLE 6. Redistribution Time and Melt Decay Heat Calculation Results
The decay heat power of the melt within 5°days is calculated. The decay process is divided into 30 burnup steps. About 1,320 core hours are used for each calculation. The fission source iteration method is adopted for the critical calculation, specifically, 200,000 for neutrons in each generation, 20 for inactive generations, 120 for the total generations, and the initial fission source is the point source at the center of the lower head. The total power in the molten pools is calculated by the decay heat power empirical formula (2) after the reactor shutdowns. As the power change shown in Figure 6, the accuracy of the total power assumption is ensured.
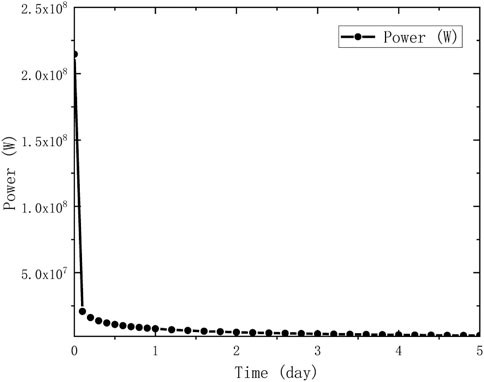
FIGURE 6. Theoretical Calculation Result of Decay Heat Power After Shutdown.
For the lower head with a three-layer molten pool structure, the light metal layer is divided into 990 burnup zones; the oxide layer is divided into 2,016 burnup zones; the heavy metal layer is divided into 288 burnup zones; for the lower head with two-layer molten pool structure, the light metal layer is divided into 1,288 burnup zones; the oxide layer is divided into 2,304 burnup zones.
Previous researchers usually choose analysis programs such as IVRSA and MAAP to analyze and calculate the IVR characteristics of reactors under severe conditions to obtain the corresponding parameters. For example, Zavisca et al. used MELCOR, MAAP, etc. to analyze and calculate the serious accidents caused successfully by a pressure vessel’s external submergence(Yuan et al., 2003; Zavisca et al., 2003); Esmaili et al. used the same method to calculate the initial IVR parameters of the AP1000 nuclear power plant in the severe accident(Esmaili and Khatib-Rahbar, 2004) . The decay heat parameters calculated by the predecessors and obtained herein were listed below. It can be observed that the calculation results of the decay heat are roughly the same when the redistribution time is similar, which verifies the validity of decay heat calculation results of the molten pools in this research.
For time distribution of the melt in lower heads, Figure 7 exhibits the change of the decay heat power generated by each layer in the two-layer molten pool structure and the three-layer molten pool structure after 30 burnup steps within 0d-5d.
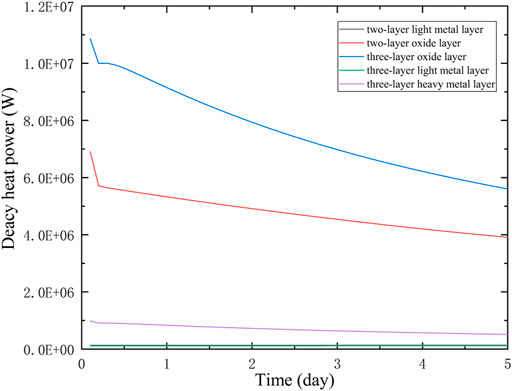
FIGURE 7. Decay Heat Power of the Light Metal Layer, Oxide Layer, and Heavy Metal Layer in Two Molten Pool Structures in 0d-5d.
It can be seen from Figure 7: (1) In the two-layer molten pool structure, the decay heat generated in the light metal layer, the oxide layer and the heavy metal layer all decrease with time. It decreases the most on the first day, and then the trend becomes more and more gentle, which meets the decline trend of the decay heat power after shutdown. (2) The decay heat power of the oxide layer is about 10-15 times that of the heavy metal layer, while the decay heat power of the light metal layer is only about one-thousandth of that of the heavy metal layer and the oxide layer. Therefore, in the evaluation of the IVR safety strategy, more attention should be paid to the heat flux density at the position of the oxide layer and the heavy metal layer.
Regarding the spatial distribution of the melt decay heat in lower heads, due to the symmetry of lower heads, it can visually observe the distribution of the decay heat power density of the entire lower heads with the cross-sectional side view. The decay heat power density shown in the Figure 8 is obtained by the following formula:
there,
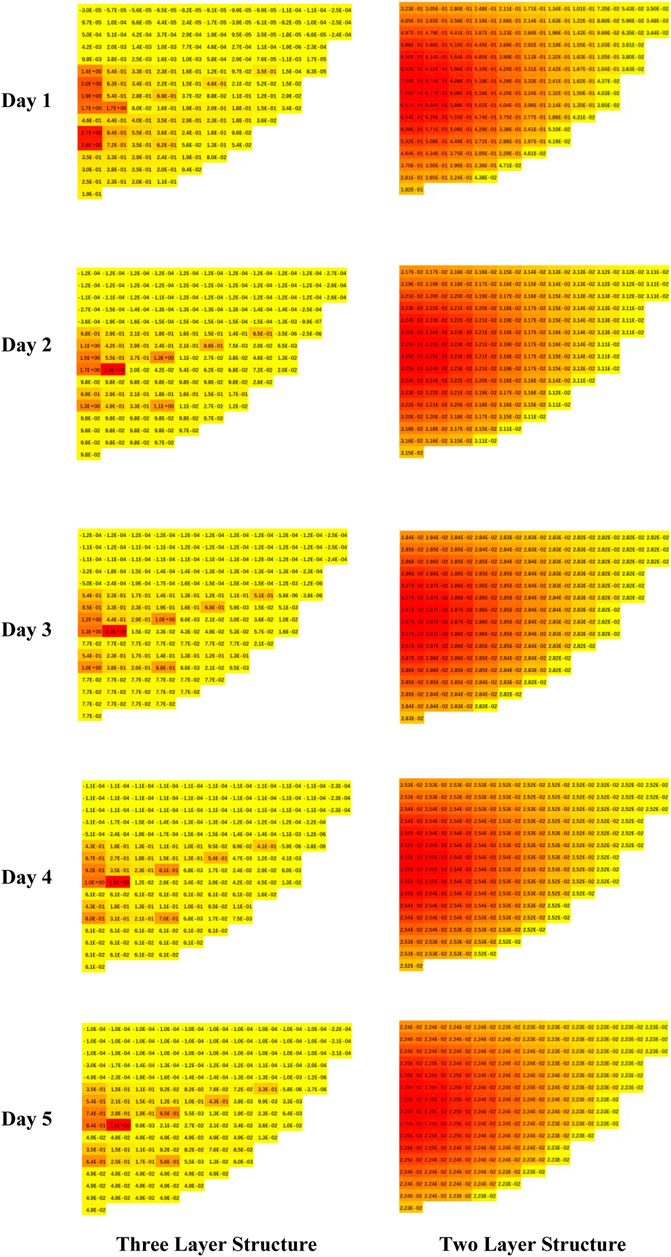
FIGURE 8. Decay Heat Power Density of Molten Pools of Lower Heads in 1d-5d.
Figure shows a half cross-sectional side view of the decay heat power density of the melt in lower heads of the oxide layer and heavy metal layer at
It can be seen from Figure 8 that the spatial distribution of the decay heat power of the oxide layer is relatively uniform and at the same order of magnitude in the two-layer molten pool structure. It is because oxides such as uranium dioxide and zirconium dioxide are uniformly distributed in the oxide layer in the two-layer structure, forming a stable configuration. Notably, because the initial fission source is the point source at the center of the lower head, the maximum value of the decay heat power density in the lower head appears at the center of the lower head, and the value gradually decreases as it approaches the wall of the lower head. In terms of time distribution, the decay heat power at the center drops rapidly from 0.71 to 0.033 within 1d; it slowly decreases to 0.023 and gradually reaches a steady state within 2-5d; while the decay heat power at the inner wall surface is relatively stable with little fluctuation, from 0.051 to 0.022 within 1d-5d.
In the three-layer molten pool structure, the spatial distribution of the decay heat power of the oxide layer and the heavy metal layer is very uneven, and the maximum value of the decay heat power is increased by about 4 orders of magnitude compared with the minimum value over the same time frame. This is because a complex chemical reaction occurred between molten uranium dioxide and molten zirconium under severe accident conditions, resulting in the precipitation of heavy metal uranium that caused a very uneven distribution of elements inside the lower head. In addition, since the initial point source is located in the middle of the molten pool. Therefore, in the three-layer molten pool structure, the decay heat is mainly concentrated at the bottom of the oxide layer and the upper part of the heavy metal layer. At the same position of the heavy metal layer, the decay heat power of the three-layer structure is 2-3 times that of the two-layer structure; on the upper part of the oxide layer, the decay heat power of the three-layer structure is 2-3 orders of magnitude lower than that of the two-layer structure. It is noted that the maximum decay heat power density in the lower head appears in the middle and lower parts of the oxide layer. In terms of time distribution, the maximum decay heat power density decreases from 2.9°
All along, the calculation and estimation of the decay heat in molten pools under IVR conditions are controversial due to the limitations of calculation tools and the complexity of physical processes in molten pools. To solve the above problems, the decay heat calculation module is developed based on DEPTH coupled with RMC, and its functional verification is carried out. Then, the program developed in this paper is taken to calculate the distribution of the decay heat in the two molten pool structures, and the following conclusions can be drawn:
1. The decay heat calculation results meet the physically decline change trend after shutdown. By comparing with the results calculated by previous programs such as MELCOR and MAAP, the validity of calculation results of is verified.
2. In the two-layer molten pool structure, due to the uniform distribution of nuclides, the spatial distribution of the decay heat power of the oxide layer is relatively uniform. At the center of the lower head, the decay heat power slowly falls from 0.71°
3. The maximum decay heat power appears at the top of the heavy metal layer and the lower part of the oxide layer or corresponding positions in two structures. Therefore, it should lay emphasis on the heat transfer characteristics and design margin of these two locations in actual engineering calculations.
The original contributions presented in the study are included in the article/Supplementary Material, further inquiries can be directed to the corresponding author.
YHa:Data analysis, Methodology, Validation, Formal analysis, Visualization Software, Writing Original Draft, recording image data JC: Data analysis, Methodology, recording image data , Writing Original Draft, Formal analysis,Validation HL: Conceptualization, Methodology, Software, Investigation XG: Validation, Formal analysis, Visualization Review & Editing ML: Resources, Writing - Review & Editing, Supervision, Data Curation SH: Conceptualization, Resources, Writing–Review & Editing, Supervision, research Project administration and Funding acquisition KW: Resources, Writing–Review & Editing, Supervision HG: Resources, Writing–Review & Editing, Supervision YL: Resources, Writing–Review & Editing, Supervision YHu: Resources, Writing–Review & Editing, Supervision
This paper is supported by the National Natural Science Foundation of China (Grant No. 11705188, A050504).
The authors declare that the research was conducted in the absence of any commercial or financial relationships that could be construed as a potential conflict of interest.
ANSI/ANS (2005). ANSI/ANS-5.1—2005 American National Standard Decay Heat Power in Light water[S]. US: ANSI/ANS.
Asmolov, V. G. (2000). Behavior of the Corium Melt Pool in LWR Lower Head with External cooling[J]. RASPLAV Final Report.
Cheung, F. B., Haddad, K. H., and Liu, Y. C. (1997). Critical Heat Flux (CHF) Phenomenon on a Downward Facing Curved surface[R]. United States: Nuclear Regulatory Commission, Washington, DC (United States). Div. of Systems Technology; Pennsylvania State Univ., University Park, PA (United States). Dept. of Mechanical Engineering. doi:10.2172/491560
Chevalier, P.-Y., Fischer, E., and Cheynet, B. (2004). Progress in the Thermodynamic Modelling of the O-U-Zr Ternary System. Calphad 28 (1), 15–40. doi:10.1016/j.calphad.2004.03.005
Chu, T. Y., Bainbridge, B. L., Simpson, R. B., and Bentz, J. H. (1997). Ex-vessel Boiling Experiments: Laboratory-And Reactor-Scale Testing of the Flooded Cavity Concept for In-Vessel Core Retention Part I: Observation of Quenching of Downward-Facing Surfaces[J]. Nucl. Eng. Des. 169 (1-3), 77–88. doi:10.1016/s0029-5493(96)01278-2
Esmaili, H., and Khatib-Rahbar, M. (2004). Analysis of In-Vessel Retention and Ex-Vessel Fuel Coolant Interaction for AP1000[J]. NUREG/CR. 6849 ERTNRC O4. 2OI.
Fluhrer, B., Miassoedov, A., Cron, T., Foit, J., Gaus-Liu, X., Schmidt-Stiefel, S., et al. (2008). The LIVE-L1 and LIVE-L3 Experiments on Melt Behaviour in RPV Lower Head[J]. FZKA 7419, 3–13. doi:10.5445/IR/270072823
Gaus-Liu, X., Mjasoedov, A., Cron, T., Foit, J. J., Fluhrer, B., Schmidt-Stiefel, S., et al. (2011). Test and Simulation Results of LIVE-L4+ LIVE-L5L[M]. KIT Scientific publishing.
Gu, P., Shi, G., Cao, K., and Wang, J. (2017). Research on IVR-Relevant Phenomena of Material Thermodynamic Interaction and Corium Pool Configuration[C]. 2017 25th International Conference on Nuclear Engineering. American Society of Mechanical Engineers Digital Collection. doi:10.1115/icone25-66969
Hayward, P. J., and George, I. M. (1996). Dissolution of UO2 in Molten Zircaloy-4 Part 4: Phase Evolution during Dissolution and Cooling of 2000 to 2500°C Specimens. J. Nucl. Mater. 232 (1), 13–22. doi:10.1016/0022-3115(96)00197-3
Helle, M., Kymäläinen, O., and Tuomisto, H. (1999). in Proceedings of the Ninth International Topical Meeting on Nuclear Reactor Thermal-Hydraulics (San Francisco, USA: NURETH-9).Experimental COPO II Data on Natural Convection in Homogenous and Stratified pools[C]
Hermann, O. W., and Westfall, R. M. (2011). ORIGEN-S: SCALE System Module to Calculate Fuel Depletion, Actinide Transmutation, Fission Product Buildup and Decay, and Associated Radiation Source Terms, Sect. F7 of SCALE: A Modular Code System for Performing Standardized Computer Analyses for Licensing Evaluation Version 6.1. ORNL/TM-2005/39, Oak Ridge National Laboratory
Horelik, N., Herman, B., Ellis, M., and Smith, K. (2017). Benchmark for Evaluation and Validation of Reactor Simulation (BEAVRS) [R] Version 2.0.1. Massachusetts Institute of Technology: MIT Computational Reactor Physics Group
Kim, K. T., and Olander, D. R. (1988). Dissolution of Uranium Dioxide by Molten Zircaloy. J. Nucl. Mater. 154 (1), 102–115. doi:10.1016/0022-3115(88)90123-7
Kymäläinen, O., Tuomisto, H., and Hongisto, O. (1994). Heat Flux Distribution from a Volumetrically Heated Pool with High Rayleigh Number[J]. Nucl. Eng. Des. 149 (1-3), 401–408. doi:10.1016/0029-5493(94)90305-0
Li, K., Yu, Y. H., and Chen, Z. H. (2014). Significant Isotopes Selection of Core Inventory Based on Decay Heat [J]. At. Energ. Sci. Tech. 48 (06), 1055–1060. doi:10.7538/yzk.2014.48.06.1055
Liu, L. L., Yu, H. X., Chen, L., Deng, J., Deng, C. R., Zhang, M., et al. (2019a). A Method for Predicting the Structure of Corium Pool in Lower Plenum of Reactor Vessel. Prog. Nucl. Energ. 112, 233–240. doi:10.1016/j.pnucene.2019.01.005
Liu, L., Yu, H., Deng, J., Chen, L., Deng, C., Xiang, Q., et al. (2019b). Analysis of the Configurations and Heat Transfer of Corium Pool in RPV Lower Plenum. Ann. Nucl. Energ. 124, 172–178. doi:10.1016/j.anucene.2018.10.002
Ma, R. B., Zhang, L. T., Zhang, L., Guo, G. Q., and Zou, W. Z. (2015). “Experimental and Numerical Study on Corium Pool Heat Transfer Characteristics with High Rayleigh Numbers (In Chinese) [A]. The Nuclear Power Branch of the Chinese Nuclear Society,” in Proceedings of the Symposium on "Practically Eliminating the Release of Large Number of Radioactive Materials from Nuclear Power Plants" [C] (Nuclear Power Branch of Chinese Nuclear Society: Chinese Nuclear Society), 9.
Miassoedov, A., Cron, T., Foit, J., Schmidt-Stiefel, S., Wenz, T., Ivanov, I., et al. (2007). “Icone15-10227 Results of the Live-L1 Experiment on Melt Behaviour in Rpv Lower Head Performed within the Lacomera Project at the Forschungszentrum Karlsruhe[C],” in The Proceedings of the International Conference on Nuclear Engineering (ICONE) 2007.15 (The Japan Society of Mechanical Engineers, 2007: _ICONE1510-_ICONE1510).
Nuclear Industry Standardization Institute, China Institute of Atomic Energy (2011). NB/T 20056—2011 Calculation of the Decay Heat Power of Light Water Reactor Nuclear Fuel (In Chinese) [S]. Beijing: National Energy Administration.
Parker, G. W., Ott, L. J., and Hodge, S. A. (1990). Small Scale BWR Core Debris Eutectics Formation and Melting experiment. Nucl. Eng. Des. 121 (3), 341–347. doi:10.1016/0029-5493(90)90016-q
Rouge, S. (1997). SULTAN Test Facility for Large-Scale Vessel Coolability in Natural Convection at Low Pressure[J]. Nucl. Eng. Des. 169 (1-3), 185–195. doi:10.1016/s0029-5493(96)01277-0
Sehgal, B. R., Park, H. S., Giri, A., Karbojian, A., Jasiulevicius, A., Hansson, R. C., et al. (2004). Phenomenological Studies on Melt-Structure-Water Interactions (MSWI) during Postulated Severe Accidents[R]. Swedish Nuclear Power Inspectorate.
She, D. (2013). Research on the Burnup and Source Convergence with the Reactor Monte Carlo Code RMC [D]. Beijing: Department of Engineering Physics, Tsinghua University.
She, D., Xu, Q., and Wang, K. (2010). “RMC1.0 – Development of Monte Carlo Code for Reactor Analysis,” in Proceedings of 18th International Conference on Nuclear Engineering (ICONE 18)..
Stepanyan, A., Nayak, A. K., and Sehgal, B. (2004). “Experimental Investigations of Natural Convection in a Three Layer Stratified Pool with Internal Heat Generation[C],” in 2004 International Topical Meeting on Operating Nuclear Facility Safety (Washington, DC: ONFS), 169–176.
Su, G. H. (2016). Severe Accident Phenomenology of Light Water Reactors (In Chinese) [M]. Beijing: National Defense Industry Press, 174–175.
Theofanous, T. G., Liu, C., Addition, S., Angelini, S., Kymäläinen, O., and Salmassi, T. (1996). In-Vessel Cool-Ability and Retention of a Core Melt[M]. DOE/ID 10460. doi:10.2172/491623
Theofanous, T. G., Liu, C., and Additon, S. (1997b). In-vessel Coolability and Retention of a Core Melt[J]. Nucl. Eng. Des. 169 (1-3), 1–48. doi:10.1016/s0029-5493(97)00009-5
Theofanous, T. G., Liu, C., Angelini, S., Kymaelaeinen, O., Tuomisto, H., and Additon, S. (1994b). Experience from the First Two Integrated Approaches to In-Vessel Retention through External cooling[R].
Theofanous, T. G., Maguire, M., Angelini, S., and Salmassi, T. (1997a). The First Results from the ACOPO Experiment[J]. Nucl. Eng. Des. 169 (1-3), 49–57. doi:10.1016/s0029-5493(97)00023-x
Theofanous, T. G. (1989). Some Considerations on Severe Accidents at Loviisa[J]. IVO Proprietary Rep., Theofanous & Co. doi:10.2172/5387472
Theofanous, T. G., Syri, S., Salmassi, T., Kymäläinen, O., and Tuomisto, H. (1994a). Critical Heat Flux through Curved, Downward Facing, Thick walls. Nucl. Eng. Des. 151 (1), 247–258. doi:10.1016/0029-5493(94)90046-9
Tsurikov, D. F., Strizhov, V. F., and Bechta, S. V. (2007). Main Results of the MASCA1 and 2 Projects[J]. Integrated Report.
Wang, K., Li, Z. G., She, D., Liu, Y., Xu, Q., Shen, H., et al. (2011). “Progress on RMC – A Monte Carlo Neutron Transport Code for Reactor Analysis,” in Proceedings of International Conference on Mathematics and Computational Methods Applied to Nuclear Science and Engineering (M&C 2011).
Wichner, R. P., Weber, C. F., Wright, A. L., Hodge, S. A., Lorenz, R. A., and Nehls, J. W. (1983). SBLOCA outside Containment at Browns Ferry Unit One. Volume 2. Iodine, Cesium, and noble Gas Distribution and release[R]. Oak Ridge National Lab..
Yuan, Z., Zavisca, M., and Khatib-Rahbar, M. (2003). Impact of the Reactor Pressure Vessel Insulation on the Progression of Severe Accidents in AP1000[J]. Energy Research, Inc., ERI/NRC, 03–205.
Zavisca, M., Yuan, Z., and Khatib-Rahbar, M. (2003). Analysis of Selected Accident Scenarios for AP1000[J]. Energy Research, Inc., ERI/NRC, 03–201.
Zhang, L. T., Ma, R. B., Zhou, Y. K., Zhang, Y. P., Tian, W. X., Qiu, S. Z., et al. (2016b). Experimental Study on Heat Transfer Characteristics in Corium Pool with High Rayleigh Number (In Chinese) [J]. At. Energ. Sci. Tech. 50 (05), 798–804. doi:10.7538/yzk.2016.50.05.0798
Zhang, L. T., Su, G. H., Ma, Z. Y., Bu, S. S., Sun, W., and Pan, L. M. (2019). Development and Validation of Two-Dimensional Transient Analysis Code for Corium Pool Heat Transfer (In Chinese) [J]. Nucl. Power Eng. 40 (S2), 1–5. doi:10.13832/j.jnpe.2019.S2.0001
Zhang, L. T., Zhang, Y. P., Zhou, Y. K., and Tian, W. X. (2016a). Experimental Study on Influence of Crust Formation on Heat Transfer Characteristic in Corium Pool (In Chinese) [J]. At. Energ. Sci. Tech. 50 (06), 1002–1007. doi:10.7538/yzk.2016.50.06.1002
Zhang, L. T., Zhou, Y. K., Zhang, Y. P., Tian, W. X., Qiu, S. Z., and Su, G. H. (2015b). “Experimental Study on Heat Transfer Characteristics in Corium Pools with Molten Salt as Simulant under High Rayleigh Numbers (In Chinese) [A]. The Nuclear Power Branch of the Chinese Nuclear Society,” in Proceedings of the Symposium on "Practically Eliminating the Release of Large Number of Radioactive Materials from Nuclear Power Plants" [C] (Nuclear Power Branch of Chinese Nuclear Society: Chinese Nuclear Society), 8.
Zhang, Y. P., Zhang, L. T., Tian, W. X., Qiu, S. Z., and Su, G. H. (2015a). “Study on the Heat Transfer of the Molten Pool Based on the Two-Dimensional Slice Structure (In Chinese) [A]. Reactor Thermal Fluids Professional Committee of the Nuclear Energy and Power Branch of the Chinese Nuclear Society,” in Proceedings of the 14th National Reactor Thermal Fluids Academic Conference and China Nuclear Reactor Thermal Hydraulic Technology Key Laboratory 2015 Annual Conference Proceedings [C] (Reactor Thermal Fluids Professional Committee of the Nuclear Energy and Power Branch of the Chinese Nuclear Society: Key Laboratory of Advanced Reactor Engineering and Safety of Ministry of Education, Tsinghua University), 5.
Keywords: severe accident, in-vessel retention, decay heat, monte carlo, molten pool
Citation: Hao Y, Chen J, Luo H, Guo X, Liu M, Huang S, Wang K, Gong H, Li Y, Hu Y and Lu C (2021) Study on the Calculation Method of Molten Pool Decay Heat Distribution under IVR Condition. Front. Energy Res. 9:677865. doi: 10.3389/fenrg.2021.677865
Received: 08 March 2021; Accepted: 12 May 2021;
Published: 02 June 2021.
Edited by:
Muhammad Zubair, University of Sharjah, United Arab EmiratesReviewed by:
Keyou Mao, Oak Ridge National Laboratory (DOE), United StatesCopyright © 2021 Hao, Chen, Luo, Guo, Liu, Huang, Wang, Gong, Li, Hu and Lu. This is an open-access article distributed under the terms of the Creative Commons Attribution License (CC BY). The use, distribution or reproduction in other forums is permitted, provided the original author(s) and the copyright owner(s) are credited and that the original publication in this journal is cited, in accordance with accepted academic practice. No use, distribution or reproduction is permitted which does not comply with these terms.
*Correspondence: Shanfang Huang, c2ZodWFuZ0BtYWlsLnRzaW5naHVhLmVkdS5jbg==
Disclaimer: All claims expressed in this article are solely those of the authors and do not necessarily represent those of their affiliated organizations, or those of the publisher, the editors and the reviewers. Any product that may be evaluated in this article or claim that may be made by its manufacturer is not guaranteed or endorsed by the publisher.
Research integrity at Frontiers
Learn more about the work of our research integrity team to safeguard the quality of each article we publish.