 Yuzhou Zhang
 Ryan Anderson
 Ning Zhu
 Lifeng Zhang
94% of researchers rate our articles as excellent or good
Learn more about the work of our research integrity team to safeguard the quality of each article we publish.
Find out more
ORIGINAL RESEARCH article
Front. Energy Res., 13 May 2021
Sec. Fuel Cells, Electrolyzers and Membrane Reactors
Volume 9 - 2021 | https://doi.org/10.3389/fenrg.2021.677685
This article is part of the Research TopicResearch in (PEM) Fuel Cell and Fuel Cell CatalysisView all 6 articles
Synchrotron X-ray tomography images were used to study dynamic, regional water transfer behavior in the gas diffusion layer (GDL) during thawing and desaturation processes. Initially saturated, frozen GDLs were thawed and desaturated with air in a serpentine gas flow channel. On-the-fly (OTF) high speed CT scans via synchrotron X-ray allowed the capture of consecutive water transfer inside the GDL under the cold start-up gas purging condition. Desaturation data of Sigracet 35AA GDLs with three superficial gas velocities (2.88–5.98 m/s) were selected for analysis. Multiple spatial segmentation levels based on the flow field geometry, including channel vs. rib, individual channels and ribs, and smaller sections in each channel and rib, were applied to the in-plane direction to study the GDL regional thawing and desaturation behaviors. Each segmentation volume had a similar desaturation pattern in general; however, water distribution and desaturation show heterogeneity over the GDL domain, as well as relation with factors including the flow field geometry, air traveling distance, and initial saturation level. These data from the segmentation analysis expand the knowledge of localized water transfer behavior during the cold start thawing process. These data can also provide valuable information for future cold start modeling and help in optimizing the PEM fuel cell flow field design.
Proton-exchange membrane fuel cells (PEM fuel cells) have gained increased interest as one of the clean energy solutions for small scale applications. Owing to their high energy efficiency, zero emissions, and simplicity in operation, PEM fuel cells are considered as a promising clean energy alternative in future automobiles to replace the fossil fuel engines (Anderson et al., 2010; Pandian et al., 2010; Spiegel, 2008; Hardman et al., 2013; Lin et al., 2014; Amamou et al., 2016; Andersson et al., 2016). One of the main challenges to a successful commercialized PEM fuel cell product is water management, where the water generated from the electrochemical reaction and removed by the cell needs to be balanced in order to maintain the optimized hydration level through the entire cell. Excess water may cause blockages, which limit the gas transfer to the catalyst layer; insufficient water may cause membrane dehydration. Both issues can lead to performance loss and even irreversible cell degradation in the long term (Kim and Lee, 2013a; Siegwart et al., 2020).
The gas diffusion layers (GDLs) play a crucial role in PEM fuel cell water management. As a part of the membrane electrode assembly (MEA), the GDL is a thin layer of porous media with porosity of 75–90% placed between the channel and the catalyst layer, which functions as the bridge of mass transfer between these layers (Safi et al., 2017). Poor water management, especially water flooding in the GDL can limit or even prevent the reactants from reaching the catalyst and membrane. It could become a more serious problem in the operation under the subzero temperature (Lin et al., 2014; Amamou et al., 2016; Siegwart et al., 2020). The frozen water in the MEA could completely block the transport of the reactant streams and cause gas starvation, which may lead to carbon corrosion, catalyst degradation, voltage reversal, and in the long term, lifetime reduction and cell failure (Knights et al., 2004; Taniguchi et al., 2004; Liang et al., 2009; Li et al., 2013; Chen et al., 2019). Therefore, removing excess water in the GDL is essential for low operating temperature. Due to the difficulty in studying the water transfer phenomenon in this small scale of porous media, which also involves heat transfer and phase change, cold-start operation has become one of the main challenges in PEM fuel cell commercialization in the automobile industry. Pressurized dry gas purging on the anode/cathode side is considered as a common solution for the cold-start problem (Tajiri et al., 2008; Tang et al., 2013).
For experimental approaches, visualization via X-ray or neutron imaging is one of the methods used in GDL water management studies. As the high energy beam penetrates the materials, the inner structure of the sample can be revealed with contrast difference based on the material properties without cutting through the sample. X-ray imaging differentiates the material via density difference, which can support both qualitative and quantitative studies on GDL structure and liquid water distribution when combined with the computed tomography technique (CT). Compared with the lab-based X-ray imaging system, the high photon flux from synchrotron X-ray provides high spatial and temporal resolution, making it possible to capture the dynamic water transfer process in the GDL (Manke et al., 2007). Using X-ray CT data, Lamibrac et al. (2015) characterized the liquid water saturation in the microporous layer (MPL) coated GDLs as a function of the capillary pressure. Ince et al. (2018) showed that the in-plane water distribution in the porous structures of both MPL and GDL increased as the GDL compression level increased. Markötter et al. (2012) visualized the increased hydrophilicity in water distribution around the holes of perforated GDLs. For dynamic water transfer processes, Zenyuk et al., (2016) visualized the water evaporation in several GDLs with gas flow rates of 200 and 600 ml/min at 30°C. The desaturation process in the GDL was also visualized by Battrell et al. (Battrell et al., 2018; Battrell et al., 2019) for both global and localized GDL areas, with the gas flow rate at 50 ml/min.
In the literature, several studies were conducted on GDL visualization with subzero operating temperatures or GDL freezing/thawing processes. Otsuki et al. (2020) measured the solidification heat from supercooled water using thin-film thermocouples and visualized the ice distribution via X-ray CT after several cold-start operations. Kim et al. (2010) visualized the GDL structure deformation after freezing the pre-saturated GDL using X-ray tomography. By in-situ visualization of water production and water transfer via synchrotron X-ray CT, Mayrhuber et al. (2015) investigated the mechanism of the performance drop during the cold-start operation of PEM fuel cells. Kim et al. (Kim and Lee, 2012; Kim and Lee, 2013b) quantitively measured the heterogeneous distribution of the GDL’s porosity using synchrotron X-ray CT, and studied the GDL structures with 3D reconstruction after the GDLs experienced freezing/thawing cycles. As most of the X-ray visualization studies involving subzero temperatures focused on the GDL structure after the freezing/thawing cycles, neutron imaging has been used in several studies to visualize the dynamic process in the cold-start condition. Siegwart et al. (2020) visualized the dynamic phase change of water during the isothermal PEM fuel cell cold-start and successfully distinguished ice from liquid water via contrast difference using 2D neutron imaging. Water accumulation has been visualized by Oberholzer et al. (2011) during the isothermal cold-start using in-plane neutron imaging.
Flow field geometry is one of the important elements of PEM fuel cell design, which has significant impact on aspects such as cell performance and water management. Hence, understanding the effects of flow field geometry is critical in optimizing the design and improving the performance and water management ability. Spernjak et al. (Spernjak et al., 2007; Spernjak et al., 2010) experimentally investigated the liquid water formation and transport in a single-serpentine PEM fuel cell, and also compared the liquid water dynamics in parallel, serpentine, and interdigitated flow fields using neutron imaging and digital camera. Battrell et al. (2019) quantitatively visualized the water removal in the GDL with serpentine gas channels, considering the effects of flow field geometry. Ding et al. (2020) compared the cell performances of a parallel, interdigitated, and serpentine flow field with normal and wavelike channels using a three-dimensional, two-phase, non-isothermal model. Yin et al. (2020) numerically investigated the liquid water droplet movement at the U-turn of the serpentine channel. Kerkoub et al. (2018) used a three-dimensional CFD model to study the effects of the channel to rib width ratio for the PEM fuel cell with parallel, serpentine, and interdigitated flow fields.
In summary, although numerous studies have experimentally or numerically investigated the PEM fuel cell and GDL water management, there is still a lack of a clear understanding of the water transfer phenomenon in this porous media. High quality visualization could provide valuable information for modeling and numerical studies. However, most of the existing visualization research studied the water behavior with the cell in an idle state to increase the exposure time. Using the low energy monochromatic beam with long exposure time in X-ray imaging can increase the quality of spatial resolution and material contrast, but the duration of each scan is too long to capture the water dynamics. Furthermore, in studying the dynamic water behavior with cold-start conditions, although neutron imaging is commonly used for its high sensitivity to ice and liquid water, it can only provide low resolution images due to apparatus limitation. It can be seen that the dynamic processes of freezing, thawing and water movement in the cold-start GDL are not well understood. Motivated by these challenges, the thawing and desaturation process of a pre-saturated frozen GDL was 3-D visualized using high-speed synchrotron X-ray CT and analyzed both qualitatively and quantitively in this work. Multiple GDL samples (Sigracet 35AA and 35BA graphite GDLs) were studied with a serpentine flow field and the air purging rate at 10, 20, 30 ml/min during the desaturation. Continuing our previous work (Zhang et al., 2021), which studied the global desaturation profile and heterogeneity across the entire GDL domain, this research focuses on the localized desaturation and water behaviors in smaller scale to study the effects of flow field on the GDL water management. This work provides valuable data for the modeling community for simulation of the water transfer and the freezing/thawing process in the GDL. These data can also be useful for future design of GDLs, flow fields, and cold-start strategies to improve the overall water management of PEM fuel cells.
This research used the same protocols and setups as a previous experiment (Zhang et al., 2021) and were discussed there in detail. A summary is included in the following section along with the changes and improvements.
The GDL sample was initially saturated by injecting liquid water at 0.05 ml/min using a syringe pump. The saturated GDL was then transferred into the test cell and an X-ray CT scan was performed. After this point, the GDL sample remained in the test cell untouched until the end of this experimental trial to minimize the position change in each scan. The GDL was frozen in a −80°C freezer for 20 min to simulate the rapid ice formation in the GDL during the subzero temperature. Then, the test cell was mounted on the CT rotation stage and the scans were performed in 2 min intervals for a total of 30 min, with ambient temperature dry air constantly purging the cell at the rate of 10, 20 or 30 ml/min depending on the experimental conditions, corresponding to 2.88, 4.26 and 5.98 m/s superficial gas velocity in the gas channel. A CT scan was captured for baseline GDL porosity on the dry state sample at the end of each experiment after a 5 min air purge was applied. Two GDL samples from the same product series, Sigracet 35AA and 35BA, were used in the experiment, where the 35BA has additional 5% PTFE loading for higher hydrophobicity (Rashapov et al., 2015).
Raw 2D projections were reconstructed with ultra-fast imaging and online reconstruction - Karlsruhe Institute of Technology (UFO-KIT), where background correction and phase retrieval were applied to enhance the image quality and convert edge enhanced contrast to area contrast (Vogelgesang et al., 2012; Vogelgesang, 2016). The reconstructed images (32-bit) were imported to ImageJ 1.52a for image processing, segmentation, and calculation. The sample images of the reconstructed slices are shown in Figures 1A,B, where the bright sections represent the water/GDL structure mixture, and the dark sections represent the empty porous space. The segmentation was done by first separating the water/GDL structure mixture from the total volume via the large contrast difference between the unoccupied space (air) and materials due to their significant density difference. Due to the small contrast difference between the GDL fiber, liquid water, and ice, previous segmentation method could not be applied to separate each other. Therefore, the water content was segmented from the GDL carbon fiber by subtracting the volume with the GDL structure captured from the dry state baseline, where the liquid water and ice were both included in the total water content, shown in Figure 1C, for further calculation. Using the quantitative data extracted from the segmented images, the percentage-saturation of the GDL was calculated as the volume of water content divided by the total pore volume in the dry state GDL. The desaturation rate of the GDL was calculated as the change in the volume of water content over 4 min divided by cross sectional area of the GDL. Previous research showed the heterogeneity in water distribution during the initial saturation, and the impacts of the initial saturation on the magnitude of desaturation rate, which could be more noticeable when zooming into the localized level. Therefore, the desaturation data was additionally normalized with the local initial saturation level, which transformed into the percentage removal rate of the initial residual water in that GDL area. The normalized percentage water removal rate was calculated as averaged desaturation rate over 4 min divided by the volume of initial water content.
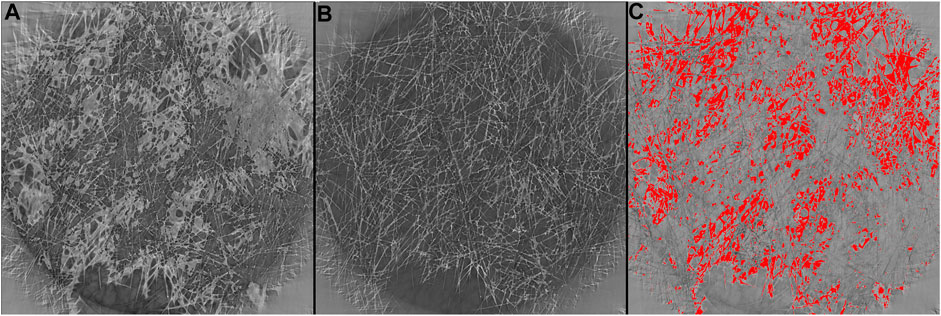
FIGURE 1. Synchrotron X-ray reconstructed slices for 35AAGDL with 20 ml/min air purging rate at (A) 0 min thawing process, (B) dry state. (C) Total water content (highlight in red) after segmentation via image subtraction.
All the experiments for this research were performed at the Bio-Medical Imaging and Therapy (BMIT) 05B1-1 beamline in the Canadian Light Source Inc. the 3rd generation synchrotron facility located in Saskatoon, Canada (Wysokinski, 2007). 2000 projections were captured in 10 s during each CT scan, with the Field of View (FOV) set as 10 mm × 1.5 mm and the pixel size set as 5.3 µm. High photon flux filtered white beam and the detector with the combination of a high-speed camera DIMAX HS4 (PCO) and a beamline monitor AA40 (HAMAMATSU) ensured the high CT capture speed and the high image quality. Additional phase contract was obtained to enhance the image quality by placing the detector 0.5 m away from the test cell.
The test cell used in this experiment simulated the water transfer in the GDL and channel on the cathode side of a single PEM fuel cell unit. To minimize the effects of the test cell during the experiment, polyether ether ketone (PEEK) was selected as the cell material for its low X-ray absorption rate and high durability. When the top and bottom parts of the test cell shown in Figures 2A,B assembled, the GDL sample was placed between the 40 mm serpentine shape gas/water channels, shown in Figure 2C, and sealed with the rubble gaskets at the edge.
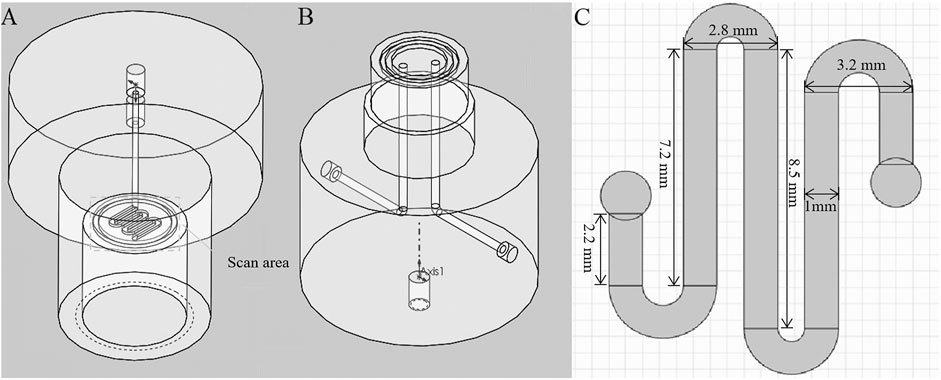
FIGURE 2. 3D schematics of the test cell (A) top and (B) bottom parts; (C) flow channel design with dimension.
This research focuses on localized water behavior during the thawing and desaturation process, and the effects related to the flow field geometry. For doing so, the GDL area underneath the channel and the rib was segmented in three different levels, and the GDL thawing and desaturation process was studied within each individual area. In the first level, channel/rib was studied as a whole, where the channel area was a continuous section with five individual channels and four bends, and the rib area contains all four ribs between the channels. For the next segmentation level, each individual channel (C), bend (B), and rib (R) is isolated from the whole channel/rib area as shown in Figure 3A. In the third level, each long channel and rib is evenly separated into three smaller sections, as shown in Figure 3B, where the short channels, short ribs, and bends remain in the same segmentation as in the second level. The number in the naming convention of the segmented sections is set as an increment order along the direction of the air purging flow.
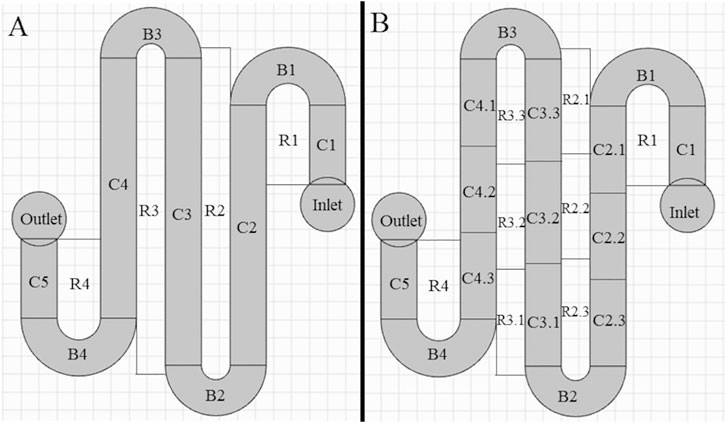
FIGURE 3. Schematic showing the geometry and the naming convention for (A) second segmentation level and (B) third segmentation level.
The in-plane saturation profiles and desaturation rates are examined in different segmentation levels within the GDL area, which include the whole channel/rib areas, individual channels/ribs, and smaller sections within a single channel/rib. This work investigated how the flow filed geometry affected the thawing and desaturation process in the frozen GDLs. Also, according to previous research, this difference in GDL hydrophobicity (difference in 35AA and 35BA) has insignificant impact on the thawing and desaturation process, and would almost only affect the overall GDL initial saturation level. Therefore, the data analysis focused on comparing the saturation profiles and desaturation rates in different segmentations within the same experimental trial.
The first analysis was performed under the coarser segmentation of the three levels. The whole channel domain is the continuous area and includes all the five channel segments and four bends, and the whole rib domain is the sum of all the four rib areas. The channel vs. rib saturation profiles and desaturation rates for 35AA and 35BA GDLs with 10, 20, and 30 ml/min air purging rates are shown in Figure 4. Like the thawing and desaturation process for the overall GDL domain, the saturation profiles and desaturation rates at the large scale in both channel and ribs show a similar trend in all the cases. From 0 to 10 min, the temperature of the GDL increased but remained in frozen condition, indicated by the flat curves in the saturation plots and close to zero desaturation rates. From 5 to 15 min, ice thawing occurred with an increased amount of water removed the from GDL. Therefore, the desaturation rates started to increase. The peak in the desaturation profile indicates the completion of the thawing process at around 15 min. For the rest of the purging process, the desaturation rates continue to decrease until most of the water content is removed from the GDL, as the desaturation rates drop to almost 0 µl cm−2 s−1.
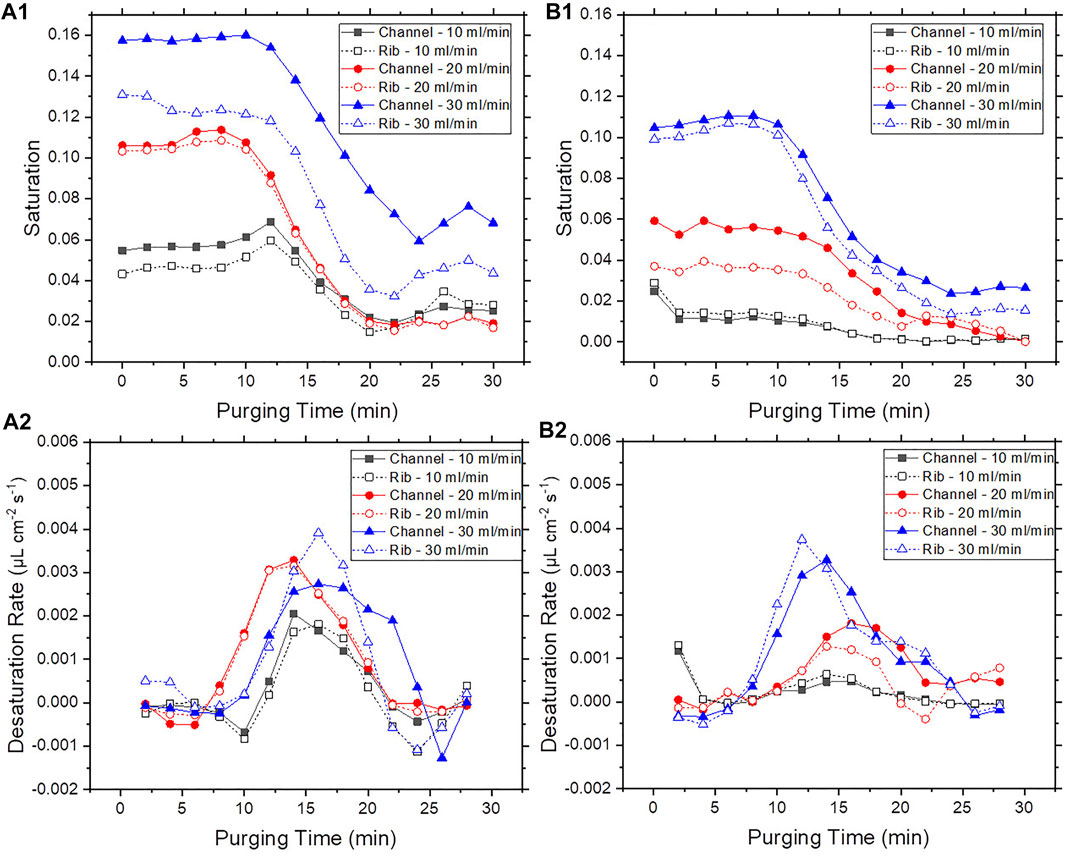
FIGURE 4. Dynamic 1) saturation profiles and 2) desaturation rates for (A) 35AA GDL (B) 35BA GDL over both whole channel and ribs domains, with 10, 20, and 30 ml/min air purging rates.
By comparing the desaturation rates for the channel and the ribs within the individual experimental cases, it is observed that at the large scale, the difference in the thawing and desaturation process is not significant between the two segmented domains. The durations of the same phase in the air purging process are similar or even identical for the channel and ribs areas in the same experimental case. For 35AA GDL with a 20 ml/min air purging rate, the desaturation curves for the channel and ribs completely overlap, where the difference in averaged desaturation rates is only 1.08%. The differences in the channel and ribs desaturation profiles for 35AA GDL with 30 ml/min and 35BA GDL with 20 ml/min could be caused by other factors rather than the flow field geometry such as GDL initial saturation level. For instance, the initial saturation differences in the channel and the ribs for 35AA with 30 ml/min and 35BA with 20 ml/min are 16.8 and 37.5%, respectively, and the initial saturation difference is only 2.78% for 35AA with 20 ml/min air purging rate.
To investigate localized saturation and desaturation rates in the flow field, the individual channels, bends, and ribs were further divided in the next segmentation level as shown in Figure 3A. Previous research showed that a high level of heterogeneity could occur in the saturation across the GDL domain, and this uneven water distribution can affect the desaturation rates in those areas, where the magnitude of the desaturation rates appears to be proportional to the initial saturation level. This effect becomes more significant when zooming into smaller GDL area. To minimize this effect, the desaturation rate values in each segmented area were normalized using the initial saturation values in those sections, and the desaturation rates were transformed into the percentage initial water removal rates. After normalization, the channels, bends, and ribs water removal rates for 35AA GDL at a 20 ml/min air purging rate are shown in Figures 5A–C, respectively. No significant difference could be found between the magnitudes of the water removal rates in each section. However, it can be clearly seen that the peaks of the desaturation curves shift to earlier times in segments closer to the air inlet (a shorter purging distance). The humidity of the purging air increases as it travels along the channel from the inlet to the outlet, and the thawing and desaturation of the GDL slows down during this process. For instance, the full thawing point of B4 came 5 min later than B1, which has approximately 28 mm purging distance longer than B1.
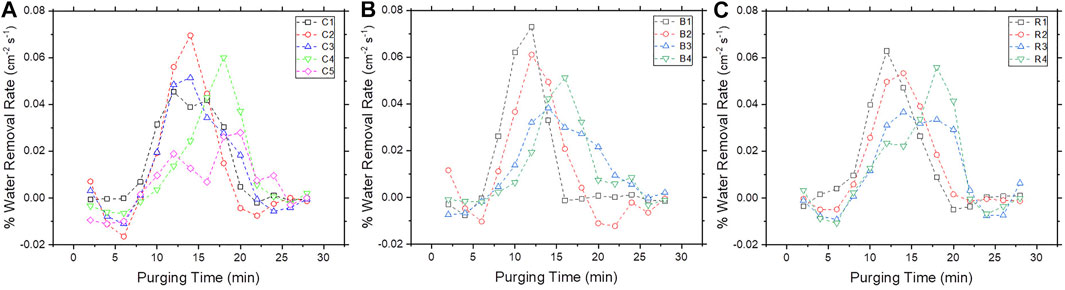
FIGURE 5. Normalized percentage water removal rates profiles for 35AA GDL with 20 ml/min air purging rate underneath the (A) channels, (B) bends, (C) ribs.
Each long channel and rib were evenly divided into three rectangular sections at finer segmentation level shown as Figure 3B. Taking 35AA GDL with 20 ml/min air purging rate as an example, the saturation profiles of all the segments are presented on surface plots shown in Figure 6, where the geometries on the plots represent the actual flow field geometries in Figure 3B. For better demonstration, the saturation profiles are converted into the value of percentage water relative to the initial residual water in each section. Heterogeneity in the thawing and desaturation process were observed through the entire GDL area. From 0 to 8 min, the saturation level in most of the GDL areas increased and exceeded their initial saturation values. This increase in the water volume may be caused by the combination of the volume expansion from the ice thawing, and the liquid water intrusion from the water droplets and thin films attached to the bottom surface of the GDL due to the through-plane pressure difference caused by the purging flow.
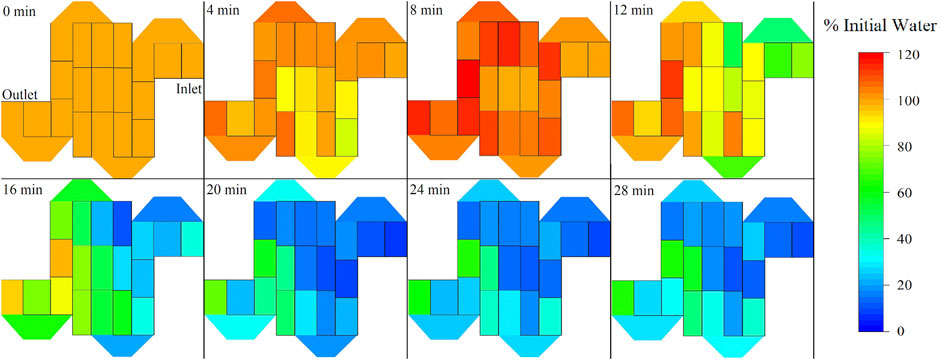
FIGURE 6. Spatial saturation colormaps include all the segmentations in the 35AA GDL with 20 ml/min air purging rate experiment.
From 8 to 16 min, rapid water removal occurs in all the segmented areas. The channel and rib segments closer to the outlet of the purging air desaturate slower than the segments near the inlet. At 24 min, as 78.3% of the segmented areas have the saturation drop below 30% of the initial water content, C2.3, C4.2, C5, R3.1, and R3.2 desaturate slower than other sections. C4.2 was not considered as the slow desaturation region due to its low initial saturation level at 2.56%. Other than that area, the slow desaturation regions could appear randomly in both channel and rib areas, but had a higher chance to appear near the outlet than the inlet. From 20 to 28 min, desaturation across all the areas slowed down with almost no significant change in the saturation level, and the water removal rates in the slow desaturation regions did not increase as the water removal process finished for the rest of the areas.
In studying the effect of purging distance, the percentage water removal rates of the finer segmentations for each long channel and rib are shown in Figure 7. Heterogeneity becomes more obvious in the smaller scale. Different from the results in the second segmentation level, the effect of purging distance was not clearly observed within C2, C3, and R3. Also, C3.3 and R3.3 appeared to be outliers that had higher water removal rates and a faster thawing process than the other sections within the same channel/rib. It indicates that other localized factors such as GDL structure, permeability and pore size could potentially influence the thawing and desaturation process in the GDL.
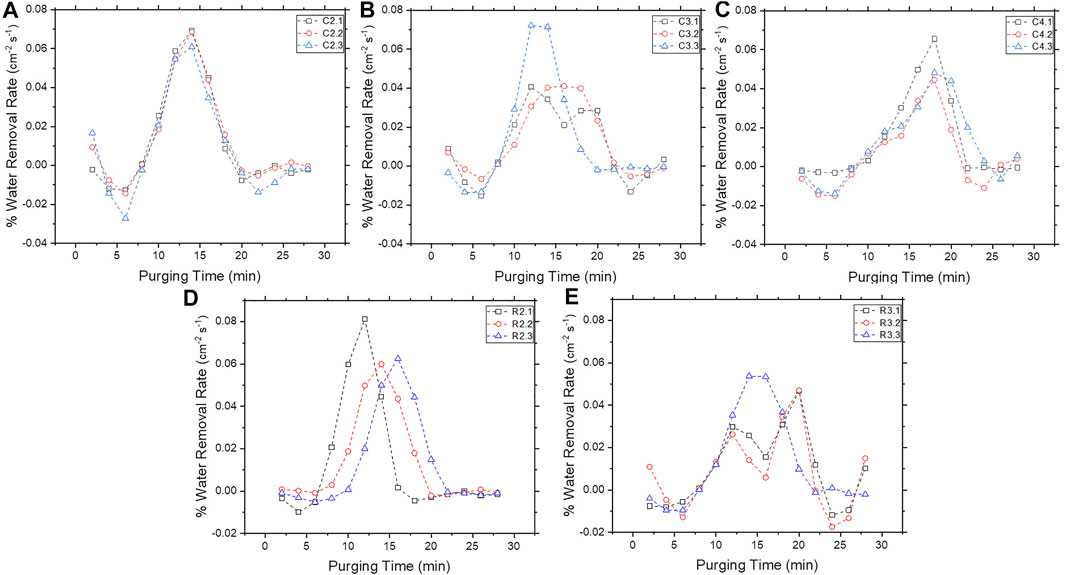
FIGURE 7. Normalized percent water removal rates profiles for 35AA GDL with 20 ml/min air purging rate for segmentations underneath (A) channel 2, (B) channel 3, (C) channel 4, (D) rib 2, (E) rib 3.
In studying the effect of flow field geometry on the thawing and desaturation process, a comparison of the water removal rates in a mixed area of channels, bend, and rib was conducted and results are shown in Figure 8. To isolate the effect of purging distance, four neighboring sections, C3.3, B3, R3.3, and C4.1 were selected, which form a continuous U-shape channel area plus the rib area between the two straight channels. Two straight channels, C3.3 and C4.1, have the fastest and slowest thawing process among the four areas respectively, where the bend and rib areas B3 and R3.3 laid in between. Comparing with the straight channel in Figure 7, the U-shape channel area including C3.3, B3, and C4.1 has a similar purging distance. However, the difference of the thawing process duration in the U-shape channel is significantly larger than the straight channel, which shows approximately 5 min difference on the GDL full thawing points, indicates that the bend structure of the U-shape/serpentine shape channel could slow down the thawing and desaturation process for the areas after the structure. Combined with the purging distance factor, the longer the purging air travels along the serpentine shape channel, the longer it would take for the ice under this channel area to thaw and be removed.
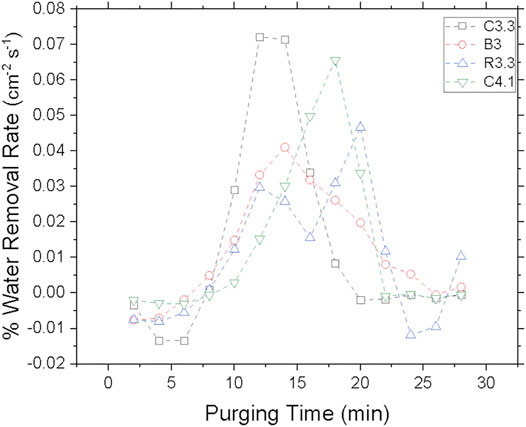
FIGURE 8. Normalized percent water removal rates profiles for 35AA GDL with 20 ml/min air purging rate underneath a U-shape channel area.
GDL thawing and desaturation processes were visualized and analyzed both qualitatively and quantitatively on multiple segmentation levels under air purging conditions via synchrotron X-ray CT. Three desaturation phases were noted in the desaturation profiles in the large scale of GDL domain and locally in the smaller segmented areas: GDL warmup, partial thawing with water removal, and desaturation after complete thawing. At larger scale, the relationship between the desaturation and the channel/rib geometry was not clearly observed. Zooming into smaller segment levels, both the temporal desaturation profiles and the spatial saturation colormaps show that the purging distance, flow field geometry, and the initial saturation level play important roles in the GDL thawing and desaturation process, where longer purging distance and bend channel structures decreased the thawing speed. Besides these factors, heterogeneity in desaturation was found across the GDL, even for the neighboring areas. These results also show the difference in the thawing and desaturation process between the global and the local GDL domain, which indicates that the water behaviors in localized areas could be the key in solving the water management problems for the PEM fuel cell. These results provide valuable information for understanding the GDL water management during cold-start and could be used in optimizing the PEM fuel cell flow field design.
The raw data supporting the conclusions of this article will be made available by the authors, without undue reservation.
YZ: Conceptualization, Writing - original draft, Methodology, Investigation, Visualization; RA: Conceptualization, Methodology, Writing-review and; editing; NZ: Methodology, review and; editing. LZ: Conceptualization, review; editing, Supervision, Funding acquisition.
The authors of this paper appreciate the financial support from Natural Sciences and Engineering Research Council of Canada and the University of Saskatchewan.
The authors declare that the research was conducted in the absence of any commercial or financial relationships that could be construed as a potential conflict of interest.
LZ and RA acknowledge the support from their respective universities, the University of Saskatchewan and Montana State University. Experiments and image processing described in this paper were performed at the BMIT facility at the Canadian Light Source, which is supported by the Canada Foundation for Innovation, Natural Sciences and Engineering Research Council of Canada, the University of Saskatchewan, the Government of Saskatchewan, Western Economic Diversification Canada, the National Research Council Canada, and the Canadian Institutes of Health Research.
Amamou, A. A., Kelouwani, S., Boulon, L., and Agbossou, K. (2016). A Comprehensive Review of Solutions and Strategies for Cold Start of Automotive Proton Exchange Membrane Fuel Cells. IEEE Access 4, 4989–5002. doi:10.1109/access.2016.2597058
Anderson, R., Zhang, L., Ding, Y., Blanco, M., Bi, X., and Wilkinson, D. P. (2010). A Critical Review of Two-phase Flow in Gas Flow Channels of Proton Exchange Membrane Fuel Cells. J. Power Sourc. 195 (15), 4531–4553. doi:10.1016/j.jpowsour.2009.12.123
Andersson, M., Beale, S. B., Espinoza, M., Wu, Z., and Lehnert, W. (2016). A Review of Cell-Scale Multiphase Flow Modeling, Including Water Management, in Polymer Electrolyte Fuel Cells. Appl. Energ. 180, 757–778. doi:10.1016/j.apenergy.2016.08.010
Battrell, L., Patel, V., Zhu, N., Zhang, L., and Anderson, R. (2019). Imaging of the Desaturation of Gas Diffusion Layers by Synchrotron Computed Tomography. J. Power Sourc. 416, 155–162. doi:10.1016/j.jpowsour.2019.01.089
Battrell, L., Zhu, N., Zhang, L., and Anderson, R. (2018). Transient, Spatially Resolved Desaturation of Gas Diffusion Layers Measured via Synchrotron Visualization. Int. J. Hydrogen Energ. 43 (24), 11234–11243. doi:10.1016/j.ijhydene.2018.05.017
Chen, H., Zhao, X., Zhang, T., and Pei, P. (2019). The Reactant Starvation of the Proton Exchange Membrane Fuel Cells for Vehicular Applications: A Review. Energ. Convers. Manag. 182, 282–298. doi:10.1016/j.enconman.2018.12.049
Ding, Quan., et al. (2020). Performance of Parallel, Interdigitated, and Serpentine Flow Field PEM Fuel Cells with Straight or Wavelike Channels. J. Energ. Eng. 146 (5), 04020054. doi:10.1061/(asce)ey.1943-7897.0000701
Hardman, S., Steinberger-Wilckens, R., and van der Horst, D. (2013). Disruptive Innovations: The Case for Hydrogen Fuel Cells and Battery Electric Vehicles. Int. J. Hydrogen Energ. 38 (35), 15438–15451. doi:10.1016/j.ijhydene.2013.09.088
Ince, U. U., Markötter, H., George, M. G., Liu, H., Ge, N., Lee, J., et al. (2018). Effects of Compression on Water Distribution in Gas Diffusion Layer Materials of PEMFC in a Point Injection Device by Means of Synchrotron X-Ray Imaging. Int. J. Hydrogen Energ. 43 (1), 391–406. doi:10.1016/j.ijhydene.2017.11.047
Kerkoub, Y., Benzaoui, A., Haddad, F., and Ziari, Y. K. (2018). Channel to Rib Width Ratio Influence with Various Flow Field Designs on Performance of PEM Fuel Cell. Energ. Convers. Manag. 174, 260–275. doi:10.1016/j.enconman.2018.08.041
Kim, J., Je, J., Kaviany, M., Son, S. Y., and Kim, M. H. (2010). Visualization of GDL Deformation by Freezing of Water Using X-Ray Radiography. Int. Fuel Cel Sci. Eng. Tech. Conf. 1, 14. doi:10.1115/fuelcell2010-33281
Kim, S.-G., and Lee, S.-J. (2012). Tomographic Analysis of Porosity Variation in Gas Diffusion Layer under Freeze-Thaw Cycles. Int. J. Hydrogen Energ. 37 (1), 566–574. doi:10.1016/j.ijhydene.2011.09.052
Kim, S.-G., and Lee, S.-J. (2013a). A Review on Experimental Evaluation of Water Management in a Polymer Electrolyte Fuel Cell Using X-Ray Imaging Technique. J. Power Sourc. 230, 101–108. doi:10.1016/j.jpowsour.2012.12.030
Kim, S. G., and Lee, S. J. (2013b). Quantitative Visualization of a Gas Diffusion Layer in a Polymer Electrolyte Fuel Cell Using Synchrotron X-Ray Imaging Techniques. J. Synchrotron Radiat. 20 (2), 286–292. doi:10.1107/s0909049513001659
Knights, S. D., Colbow, K. M., St-Pierre, J., and Wilkinson, D. P. (2004). Aging Mechanisms and Lifetime of PEFC and DMFC. J. Power Sourc. 127 (1-2), 127–134. doi:10.1016/j.jpowsour.2003.09.033
Lamibrac, A., Roth, J., Toulec, M., Marone, F., Stampanoni, M., and Büchi, F. N. (2015). Characterization of Liquid Water Saturation in Gas Diffusion Layers by X-Ray Tomographic Microscopy. J. Electrochem. Soc. 163 (3), F202–F209. doi:10.1149/2.0401603jes
Li, Pengcheng., et al. (2013). A Starvation Diagnosis Method for a PEM Fuel Cell during Dynamic Loading. Gaojishu Tongxin/Chinese High Tech. Lett. 23 (2), 189–195. doi:10.3772/j.issn.1002-0470.2013.02.012
Liang, D., Shen, Q., Hou, M., Shao, Z., and Yi, B. (2009). Study of the Cell Reversal Process of Large Area Proton Exchange Membrane Fuel Cells under Fuel Starvation. J. Power Sourc. 194 (2), 847–853. doi:10.1016/j.jpowsour.2009.06.059
Lin, R., Weng, Y., Lin, X., and Xiong, F. (2014). Rapid Cold Start of Proton Exchange Membrane Fuel Cells by the Printed Circuit Board Technology. Int. J. Hydrogen Energ. 39 (32), 18369–18378. doi:10.1016/j.ijhydene.2014.09.065
Manke, I., Hartnig, C., Grünerbel, M., Lehnert, W., Kardjilov, N., Haibel, A., et al. (2007). Investigation of Water Evolution and Transport in Fuel Cells with High Resolution Synchrotron X-Ray Radiography. Appl. Phys. Lett. 90 (17), 174105. doi:10.1063/1.2731440
Markötter, H., Alink, R., Haußmann, J., Dittmann, K., Arlt, T., Wieder, F., et al. (2012). Visualization of the Water Distribution in Perforated Gas Diffusion Layers by Means of Synchrotron X-Ray Radiography. Int. J. Hydrogen Energ. 37 (9), 7757–7761. doi:10.1016/j.ijhydene.2012.01.141
Mayrhuber, I., Marone, F., Stampanoni, M., Schmidt, T. J., and Büchi, F. N. (2015). Fast X-Ray Tomographic Microscopy: Investigating Mechanisms of Performance Drop during Freeze Starts of Polymer Electrolyte Fuel Cells. ChemElectroChem 2 (10), 1551–1559. doi:10.1002/celc.201500132
Oberholzer, P., Boillat, P., Siegrist, R., Perego, R., Kästner, A., Lehmann, E., et al. (2011). Cold-Start of a PEFC Visualized with High Resolution Dynamic In-Plane Neutron Imaging. J. Electrochem. Soc. 159 (2), B235–B245. doi:10.1149/2.085202jes
Otsuki, Y., Tamada, Y., Inoue, S., Shigemasa, K., and Araki, T. (2020). Measurement of Solidification Heat from Supercooled Water Freezing during PEFC Cold Start and Visualization of Ice Distribution. Int. J. Hydrogen Energ. 45 (31), 15600–15610. doi:10.1016/j.ijhydene.2020.04.004
Pandian, Meiyappan. Siva., et al. (2010). Efficiency and Economics Analysis of Proton Exchange Membrane Fuel Cell. Conf. Proc. IPEC, 875–880. doi:10.1109/ipecon.2010.5697089
Rashapov, R. R., Unno, J., and Gostick, J. T. (2015). Characterization of PEMFC Gas Diffusion Layer Porosity. J. Electrochem. Soc. 162 (6), F603–F612. doi:10.1149/2.0921506jes
Safi, M. A., Prasianakis, N. I., Mantzaras, J., Lamibrac, A., and Büchi, F. N. (2017). Experimental and Pore-Level Numerical Investigation of Water Evaporation in Gas Diffusion Layers of Polymer Electrolyte Fuel Cells. Int. J. Heat Mass Transfer 115, 238–249. doi:10.1016/j.ijheatmasstransfer.2017.07.050
Siegwart, M., Huang, F., Cochet, M., Schmidt, T. J., Zhang, J., and Boillat, P. (2020). Spatially Resolved Analysis of Freezing during Isothermal PEFC Cold Starts with Time-Of-Flight Neutron Imaging. J. Electrochem. Soc. 167 (6), 064510. doi:10.1149/1945-7111/ab7d91
Spernjak, D., Prasad, A. K., and Advani, S. G. (2007). Experimental Investigation of Liquid Water Formation and Transport in a Transparent Single-Serpentine PEM Fuel Cell. J. Power Sourc. 170 (2), 334–344. doi:10.1016/j.jpowsour.2007.04.020
Spernjak, D., Prasad, A. K., and Advani, S. G. (2010). In Situ Comparison of Water Content and Dynamics in Parallel, Single-Serpentine, and Interdigitated Flow Fields of Polymer Electrolyte Membrane Fuel Cells. J. Power Sourc. 195 (11), 3553–3568. doi:10.1016/j.jpowsour.2009.12.031
Spiegel, Colleen. (2008). PEM Fuel Cell Modeling and Simulation Using Matlab. Burlington, MA, United States: Elsevier Science.
Tajiri, K., Wang, C.-Y., and Tabuchi, Y. (2008). Water Removal from a PEFC during Gas Purge. Electrochimica Acta 53 (22), 6337–6343. doi:10.1016/j.electacta.2008.04.035
Tang, H.-Y., Santamaria, A. D., Bachman, J., and Park, J. W. (2013). Vacuum-Assisted Drying of Polymer Electrolyte Membrane Fuel Cell. Appl. Energ. 107, 264–270. doi:10.1016/j.apenergy.2013.01.053
Taniguchi, A., Akita, T., Yasuda, K., and Miyazaki, Y. (2004). Analysis of Electrocatalyst Degradation in PEMFC Caused by Cell Reversal during Fuel Starvation. J. Power Sourc. 130 (1-2), 42–49. doi:10.1016/j.jpowsour.2003.12.035
Vogelgesang, Matthias. (2012). A Scalable GPU-Based Image Processing Framework for On-Line Monitoring. IEEE 14th Int. Conf. High Perform. Comput. Commun. 2012 IEEE 9th Int. Conf. Embedded Softw. Syst. 2012. doi:10.1109/hpcc.2012.116
Vogelgesang, Matthias. (2016). Real-Time Image-Content-Based Beamline Control for Smart 4D X-Ray Imaging. J. Synchrotron Radiat. 23 (5), 1254–1263. doi:10.1107/s1600577516010195
Wysokinski, Tomasz. W. (2007). Beamlines of the Biomedical Imaging and Therapy Facility at the Canadian Light Source—Part 1. Nucl. Instr. Methods Phys. Res. Section A: Acc. Spectrometers, Detectors Associated Equipment 582 (1), 73–76. doi:10.1016/j.nima.2007.08.087
Yin, Y., Shangguan, X., Ma, X., Zhang, J., and Qin, Y. (2020). Influence of Corner Structure of Fuel Cell Serpentine Channel on Water Removal. Int. J. Hydrogen Energ. 45 (54), 29812–29823. doi:10.1016/j.ijhydene.2019.08.200
Zenyuk, I. V., Lamibrac, A., Eller, J., Parkinson, D. Y., Marone, F., Büchi, F. N., et al. (2016). Investigating Evaporation in Gas Diffusion Layers for Fuel Cells with X-Ray Computed Tomography. J. Phys. Chem. C 120 (50), 28701–28711. doi:10.1021/acs.jpcc.6b10658
Keywords: x-ray radiography, segmentation, gas diffusion layer (GDL), proton exchange membrane fuel cell, cold start, desaturation
Citation: Zhang Y, Anderson R, Zhu N and Zhang L (2021) Visualizing Water Desaturation in Frozen Gas Diffusion Layers With Flow Field Segmentation via Synchrotron X-Ray Radiography. Front. Energy Res. 9:677685. doi: 10.3389/fenrg.2021.677685
Received: 08 March 2021; Accepted: 28 April 2021;
Published: 13 May 2021.
Edited by:
Pei-Chen Su, Nanyang Technological University, SingaporeReviewed by:
Zhiqiang Niu, Loughborough University, United KingdomCopyright © 2021 Zhang, Anderson, Zhu and Zhang. This is an open-access article distributed under the terms of the Creative Commons Attribution License (CC BY). The use, distribution or reproduction in other forums is permitted, provided the original author(s) and the copyright owner(s) are credited and that the original publication in this journal is cited, in accordance with accepted academic practice. No use, distribution or reproduction is permitted which does not comply with these terms.
*Correspondence: Lifeng Zhang, bGlmZW5nLnpoYW5nQHVzYXNrLmNh
Disclaimer: All claims expressed in this article are solely those of the authors and do not necessarily represent those of their affiliated organizations, or those of the publisher, the editors and the reviewers. Any product that may be evaluated in this article or claim that may be made by its manufacturer is not guaranteed or endorsed by the publisher.
Research integrity at Frontiers
Learn more about the work of our research integrity team to safeguard the quality of each article we publish.