 Wenhai Qu
95% of researchers rate our articles as excellent or good
Learn more about the work of our research integrity team to safeguard the quality of each article we publish.
Find out more
ORIGINAL RESEARCH article
Front. Energy Res. , 09 June 2021
Sec. Nuclear Energy
Volume 9 - 2021 | https://doi.org/10.3389/fenrg.2021.675494
This article is part of the Research Topic Advanced Nuclear Fuel Technology View all 11 articles
Axial and lateral pressure loss in a 5 × 5 rod–bundle with a split-type mixing vane spacer grid was experimentally measured using differential pressure transmitters at different sub-channel Reynolds numbers (Re) and orienting angles. The geometrical parameters of the 5 × 5–rod bundle are as follows: they have the same diameter (D = 9.5 mm) and pitch (p = 12.6 mm) as those of real fuel rods of a typical pressurized water reactor (PWR), with a sub-channel hydraulic diameter (Dh) of 11.78 mm. The characteristics and resistance models of pressure loss are discussed. The main axial pressure loss is caused by the spacer grid, and the spacer grid generates additional wall friction pressure loss downstream of the spacer grid. The lateral pressure loss shows strong correlations with orienting angles and distance from the spacer grid. The lateral pressure loss shows a sudden burst in the mixing vanes region and a slight augmentation at z = 3Dh. After 3Dh, the lateral pressure loss decays in an exponential way with distance from the spacer grid, and it becomes constant quickly at z = 20Dh.
The mixing vane spacer grids in the fuel assembly of a pressurized water reactor (PWR) highly enhance cross-flow, turbulent mixing, and heat transfer in fuel assembly, improving the departure from nucleate boiling (DNB) conditions in PWRs. However, it costs pressure loss in the reactor core due to the relatively large resistance of the spacer grid, and the axial and lateral resistance of the fuel assembly are important parameters, which should be investigated and modeled into a sub-channel analysis code in the design phase and operation phase. In the axial momentum conservation equation, wall friction resistance and spacer grid resistance models are employed to predict the axial pressure loss performance of the fuel assembly, while the lateral resistance model is used for predicting lateral pressure loss (Li et al., 2019).
The classical wall friction factor models for circular pipes are a power function of the Reynolds number (Re), including the Nikuradse equation, the Moody diagram, the Blasius equation, and the McAdams equation (Fang et al., 2011). The Colebrook equation (Colebrook, 1939) considers the wall roughness and Re, but the implicit equation is inconvenient for engineering application. Many explicit correlations were approximated to the Colebrook equation (Churchill, 1973, 1977; Chen, 1979; Haaland, 1983; Manadilli, 1997; Sonnad and Goudar, 2006). These correlations are evaluated precisely enough for predicting the wall friction in pipes (Brkić, 2011; Yıldırım, 2009). However, the geometrical details of the rod bundle reshape the wall friction. The wall friction factor is a function of Re and P/D (pitch-to-rod diameter) in triangular and square arrangements of rod bundles (Cheng and Todreas, 1986; Lee et al., 2012). The wall friction models should be developed and assessed before applying them in a special design of the rod bundle (Toptan et al., 2018).
The resistance of a spacer grid is mainly decided by the blockage of the flow area and wall friction of the straps (Chun and Oh, 1998; Idelchik, 1986). The resistance of a spacer grid is different for each special design and geometry of rod bundles. The classical resistance models for different spacer grids (Rehme, 1970, 1973) were a function of the ratio of the projected area of the spacer grid to the flow area of the bared rod bundle and the modified spacer grid resistance. A series of similar models of spacer grid resistance were found in the studies by Vog et al. (1971), Savatteri et al. (1986), Cigarini and Donne (1988), Cevolani (1995), Epiney et al. (2010), Pacio et al. (2014), and Schikorr et al. (2010). These resistance models of spacer grids were evaluated (Chenu et al., 2011; Maskal and Aydogan, 2017), and each correlation can only be applied for the special design of the spacer grid. It is essential to develop new correlations of spacer grid resistance for special designs of spacer grids and rod bundles. A sliding pressure–sensing rod in the rod bundle was employed to measure the locally axial pressure loss facing different angles in sub-channels (Caraghiaur et al., 2009). The axial pressure distribution upstream and downstream of the spacer grid facing different orienting angles is almost the same, but it is very different in the spacer grid caused by the complex geometry. Both the local geometry details and the influence of the neighboring sub-channels play an important role in the pressure distribution. Many researchers predicted the axial pressure loss in the rod bundle with the spacer grid using CFD simulations (Chen et al., 2017; Cheng et al., 2017; Wu et al., 2017; Han et al., 2018; In et al., 2015; Xiong et al., 2018; Sibel Tas-Koehler et al., 2020; Wang et al., 2020). The axial pressure upstream of the spacer grid gradually decreases due to the wall friction of the rod bundle. But the axial pressure suddenly jumps down just before the spacer grid, and in the region of the spacer grid, the axial pressure decreases sharply (Wang et al., 2020). Downstream of the spacer grid, the axial pressure increases slightly just near the spacer grid, and then it decreases slowly.
Several studies have investigated the lateral pressure loss in rod bundles. The cross-flow resistance coefficient between sub-channels (Tapucu, 1977) is defined as the ratio of the lateral pressure loss to the laterally kinetic energy, calculated by the cross-flow velocity and fluid density. The cross-flow resistance in a bared rod bundle is a power correlation of the P/D ratio and Re (Liu and Todreas, 1979). In the MATiS-H benchmark exercise (Agbodemegbe et al., 2015; Chang and Tavoularis, 2015), the pressure distribution on the surface of mixing vanes was the mechanism of the cross-flow pattern, and the cross-flow resistance was investigated using the CFD simulation. In the studies by Qu et al. (2019a) and Xiong et al. (2020), a new sliding pressure loss measurement system was designed to measure the lateral pressure loss between sub-channels. The lateral pressure loss decays as an exponential function of the distance from the spacer grid, and the cross-flow resistance was fitted into a correlation of distance from the spacer grid.
In most studies, the impulse pipes are fixed on the channel wall of the rod bundle, which is not the locally axial pressure loss in sub-channels. It is reasonable that the spacer grid generates additional wall friction downstream of the spacer grid. The pressure distribution in the sub-channels is determined by the local flow conditions, but few studies investigate the pressure loss in sub-channels along the axial distance and facing different angles experimentally.
The axial and lateral pressure loss facing different angles along the axial distance upstream and downstream of the spacer grid were measured using the sliding pressure loss measurement system, and corresponding resistance models are proposed and discussed. The experimental data help to understanding the hydraulic performance of the mixing vane spacer grid, and benefit the development of the spacer grid and CFD validation.
The MEdium Scale Hydraulic (MESH) test facility is utilized for the experiment (Qu et al., 2019a) in the Shanghai Jiao Tong University. In the primary loop, the deionized water is vertically driven by the pump from the fluid reservoir to the test section and then back to the water tank. The cooling loop precisely stabilizes the temperature of the fluid in the test section via the heat exchanger, cooling pump, and cooling tower. The temperature in the test section is monitored using calibrated thermal couples with an accuracy of 0.1°C at the inlet and the outlet of the test section. The flow rate through the test section is measured using a turbine flow meter with an error of 0.5% in range of 4–50 m3/h.
The spacer grid with 11 mm long mixing vanes and an inclination angle of 30° is shown in Figure 1A. The spacer grid with a height of 40 mm from the bottom plate of 3 mm thickness to the top of the straps with a height of 37 mm is installed in the rod bundle. The top and front views of the mixing vane spacer grid are shown in Figures 1B,C. The details of the mixing vanes are shown in Figure 1D. The vertical test section is shown in Figure 2A, including the inlet section, the measuring section, and the outlet tank. The housing of the test section includes the aluminum frame and four PMMA windows of 1011.5 mm length. A flow straightener at the inlet of the inlet section minimizes disturbance upstream of the test section. In Figure 2B, the rod bundle of 1100 mm length is made of aluminum oxidized by chromate and dyed to be black using a colorant. The rod diameter (D) is 9.5 mm with a pitch (P) of 12.6°mm, resulting in the sub-channel hydraulic diameter (Dh) of 11.78 mm. The 517-mm-long rods are fixed on the bottom plate of the spacer grid upstream, and the 580-mm-long rods are fixed downstream of the spacer grid. The rod bundle is fixed on the bottom and top flanges of the measuring section. The laboratory coordinate system is defined as shown in Figures 2B,C. The origin (x = 0, y = 0, z = 0) is defined at the center of the central rod on the plane of the upper edge of the straps. The sixteen sub-channels are named in Figure 2D.
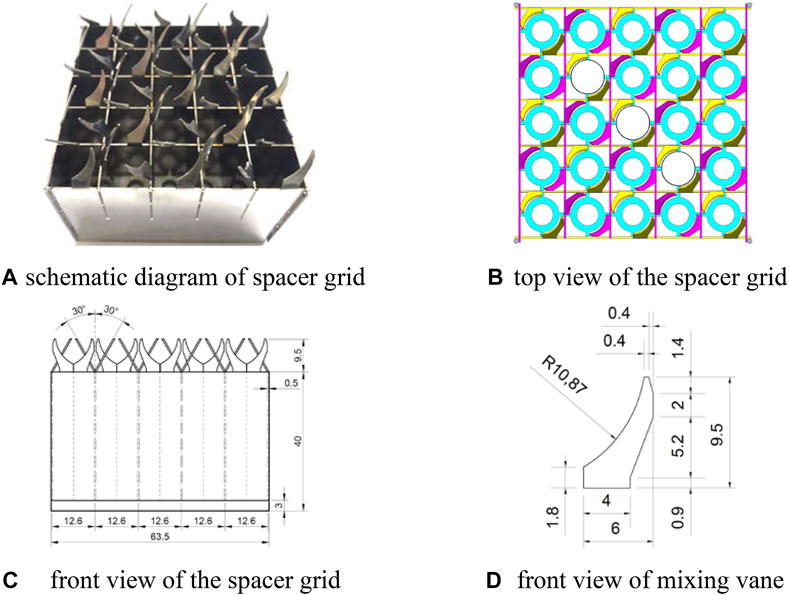
FIGURE 1. Spacer grid.
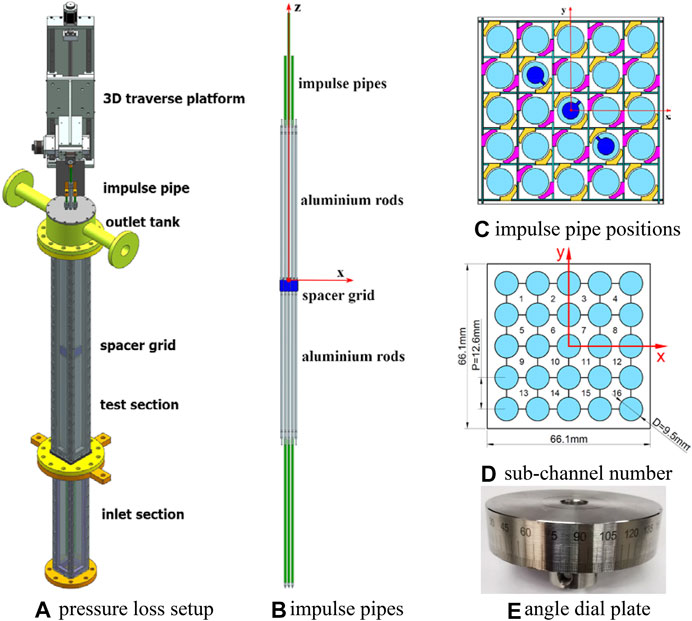
FIGURE 2. Pressure loss measurement system.
The pressure loss setup is shown in Figure 2A. Three impulse pipes are mounted through the inlet flange, spacer grid, and outlet flange. As shown in Figure 2B, the length of the impulse pipes is 1850 and 2000 mm for the two noncenter pipes and the center pipe, respectively. As shown in Figure 2C, the three impulse pipes marked blue with an outer diameter of 9.5 mm and an inner diameter of 8 mm pass through the spacer grid from the center rod and two neighboring rods, with three pressure ports of 1 mm diameter on the surface of each impulse pipe. Three pressure taps are used to guide the pressure to the differential pressure transmitters. At the measuring position of z = −20Dh, there is still a 279.4 mm length of impulse pipes upstream of the inlet of the rod bundle, which is far enough from the inlet of the rod bundle. The inlet conditions of the rod bundle and the inlet condition at the spacer grid are not influenced by the three impulse pipes. To measure the pressure loss orienting to different angles, an SUS304 angle dial plate of 63.5 mm diameter with scale lines dividing the perimeter into 360° is fixed on the top of the central impulse pipe, as shown in Figure 2E. We define the orienting angle on the x axis as equal to 0° and that on the y axis as equal to 90°. Combined with the 3D traverse platform and pressure sensors, the axial and lateral pressure loss of different orienting angles from z = −20Dh to z = 20Dh can be measured by moving the pulse pipes and turning the angle dial plate.
The axial pressure loss at different angles from z = −20Dh to z = 20Dh in sub-channel nos. 6, 7, and 11 is measured using a YOKOGAWA differential pressure transmitter (EJA110A) (range 100 kPa, accuracy 0.065%), and the reference pressure point is set on the top surface of the outlet tank. Only the central impulse pipe is used to measure axial pressure loss at different orienting angles. The lateral pressure loss in sub-channel nos. 7 and 11 was measured using a YOKOGAWA differential pressure transmitter (EJA110E) (range 5 kPa, accuracy 0.065%) for pressure loss from −2500 to 2500 Pa and a YOKOGAWA differential pressure transmitter (EJA110A) (range 100 kPa, accuracy 0.065%) for pressure loss from −50 to 50 kPa. The reference pressure point is set as the lower-right corner pressure port facing the center of sub-channel no. 11, as shown in Figure 2C. The central impulse pipe is used to measure lateral pressure loss of different orienting angles from z = −20Dh to z = 20Dh. During the experimental process, the central impulse pipe can be turned to face a different angle
The pressure loss measurements are conducted at a temperature of 25 ± 0.2°C measured by the calibrated thermal couples, a gauge pressure of 0.12 MPa at the inlet of the test section, and a flow rate of 4.68, 9.35, 18.70, 28.05, 37.4, and 46.75 m3/h through the test section with an accuracy of 0.05 m3/h. Equivalently, the corresponding sub-channel Reynolds numbers are 0.66 × 10⁴, 1.32 × 10⁴, 2.64 × 10⁴, 3.96 × 10⁴, 5.28 × 10⁴, and 6.6 × 10⁴, which are calculated by using the bulk velocity and sub-channel hydraulic diameter. The sub-channel hydraulic diameter is calculated by using the inner sub-channel geometry with a pitch of 12.6 mm and a rod diameter of 9.5 mm. The characteristics and models of pressure loss upstream and downstream of the spacer grid are discussed.
The axial pressure loss was measured at
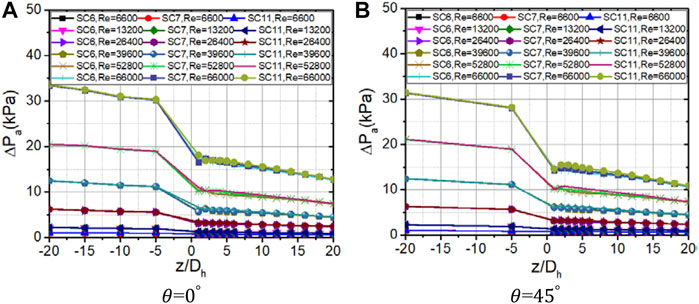
FIGURE 3. Axial pressure loss of three impulse pipes.
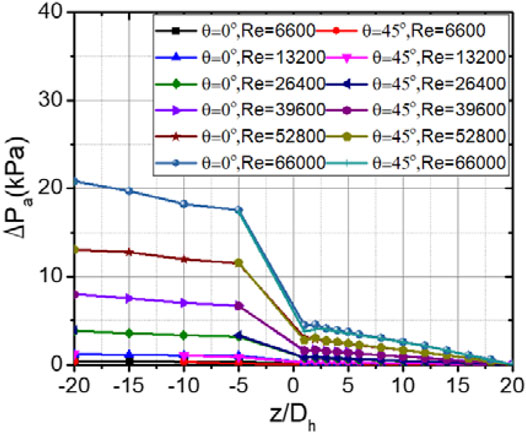
FIGURE 4. Averaged axial pressure loss of three impulse pipes.
The axial pressure loss at different orienting angles is almost the same, so the averaged axial pressure loss of
The wall friction coefficient is defined as
Here, f is the friction factor in the rod bundle.

FIGURE 5. Friction factor in the bared rod bundle.
Classical friction factor models listed following Chun and Oh (1998), Yıldırım (2009), and Lee et al. (2012) were compared with the new wall friction model. The rod roughness is equal to 1.5 µm. For the present experimental range, all classical correlations highly predicted the experimental data at higher Reynolds numbers.Blasius correlation
McAdams correlation
Moody correlation
Churchill (1973) correlation
Lee (2012) correlation
The spacer grid resistance coefficient is defined as (Caraghiaur et al., 2009; Deng et al., 2020; In et al., 2015; Lee et al., 2012)
Here, KSG is the spacer grid resistance, and
The classical spacer grid models (Rehme, 1973) consider the relative plugging of the flow cross section of the spacer grid to be the main reason for resistance, and the other reason is the Reynolds number corresponding to the friction of the spacer surface. The following is the relationship between the spacer grid resistance coefficient and the relative plugging of the flow cross section:
where CSG is the modified drag coefficient and
Here, Ap is the projected area of the spacer grid, and Af is the flow area in the bared rod bundle. In this study,
Cigarini–Donne (1988) correlation
Schikorr (2010) correlation
Based on experimental data of the spacer grid in the triangular rod bundle (Epiney et al., 2010; Pacio et al., 2014), the spacer grid resistance models are modified as the following correlations, in which n is equal to 0.2.Epiney (2010) correlation
Pacio (2014) correlation
For each spacer grid, the blockage ratio is constant, so the spacer grid resistance is a function of the Reynolds number. The measured spacer grid resistance is in the form of the power function of Re (Lee et al., 2012).
The spacer grid resistance for the split-type spacer grid and P/D = 1.35 is as follows:
In this study, the fitting curve of the spacer grid resistance coefficient is a function of Re.
As shown in Figure 6, the fitting curve predicts the spacer grid resistance well, while the other correlations, much higher or lower, predict the spacer grid resistance. This is due to the difference between the spacer grids. Downstream of the spacer grid, the axial pressure loss is higher than the pressure loss calculated by the wall friction factor, as shown in Figure 7A. Because the strong cross flow generated by the spacer grid introduces extra friction pressure loss in the rod bundle downstream of the spacer grid from z = 3Dh to z = 20Dh, we consider the axial pressure loss in this range to fit a friction factor curve downstream of the spacer grid, as shown in Figure 7B.
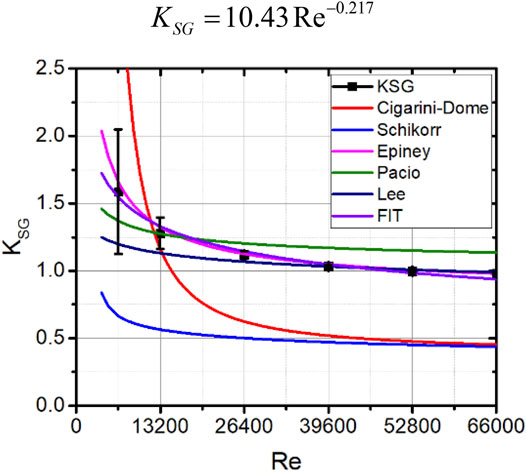
FIGURE 6. Spacer grid resistance models.
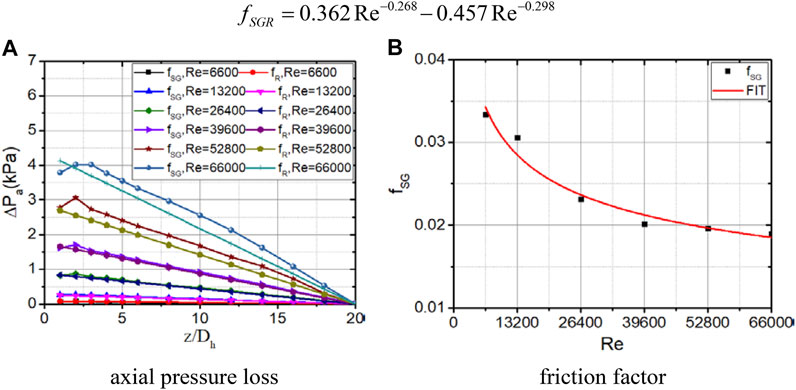
FIGURE 7. Spacer grid effect on the friction factor downstream of the spacer grid.
To evaluate the spacer grid effect on the friction factor downstream of the spacer grid, we define the parameter fSGR
The curve of fSGR is shown in Figure 8. It is clear that the spacer grid effect increases suddenly when the Re increases, and then it reaches a plateau gradually.
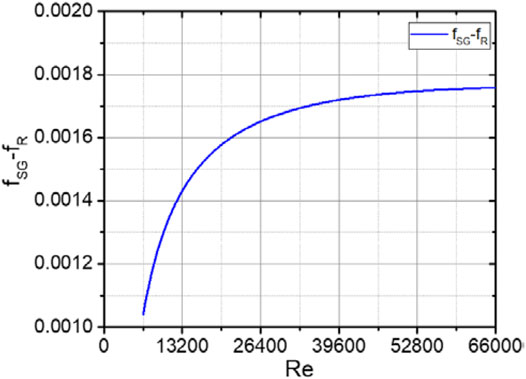
FIGURE 8. Spacer grid effect on the friction factor downstream of the spacer grid.
The resistance of the mixing vanes forces lateral pressure distribution following the arrangement of the mixing vanes, generating strong vortex, and cross flow. The lateral pressure loss changes with the orienting angle based on a series of CFD simulations (Li and Gao, 2014; Chang and Tavoularis, 2015; Sibel Tas-Koehler et al., 2020). The lateral pressure loss changes with the distance from the split-type mixing vane spacer grid, and the cross flow develops from two vortices to a single vortex, and then it decays gradually (McClusky et al., 2002; McClusky et al., 2003; Chang et al., 2008; Qu et al., 2019a; Qu et al., 2019b; Xiong et al., 2020). However, lateral pressure measurements were reported in a few studies (Qu et al., 2019a; Turankok et al., 2020; Xiong et al., 2020).
In the experiment, the lateral pressure loss at different angles ranging from z = −20Dh to z = 20Dh was measured, and the typical results are shown in Figure 9. The lateral pressure loss is maintained low, close to zero, from z = −20Dh to z = −5Dh because the flow in the rod bundle has been fully developed at z = −20Dh, and the spacer grid blockage effect on the flow upstream is still negligible at z = −5Dh. The lateral pressure loss shows a sharp decrease just upstream of the spacer grid between z = −5Dh and z = −3.4Dh because of the suddenly reduced flow area due to the spacer grid. The root of the mixing vanes locates at z = 0Dh, and the lateral pressure loss increases sharply and reaches its peak value at around half of the height of the mixing vanes (z = 0.40Dh). A similar conclusion can be seen in the work of Chang and Tavoularis (2015). The peak value of lateral pressure loss is strong enough to generate a cross flow comparable to the bulk velocity.
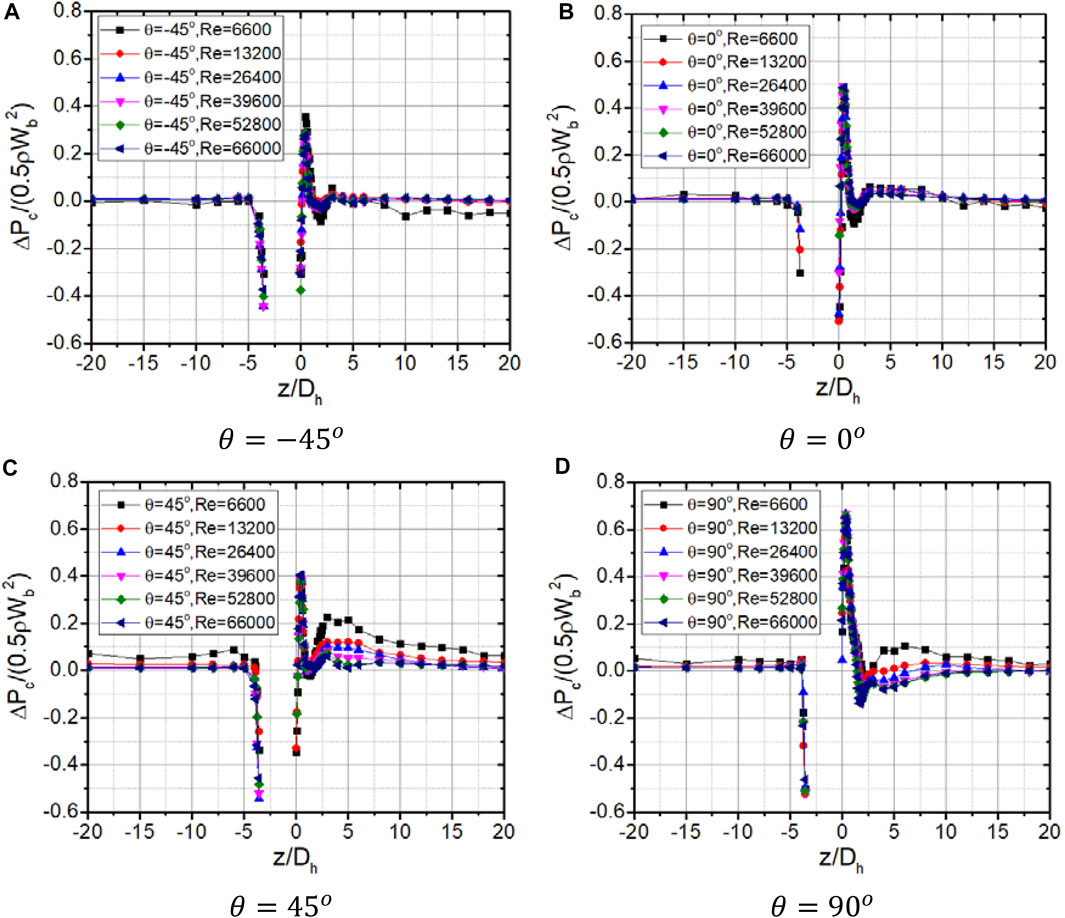
FIGURE 9. Typical normalized lateral pressure loss from −20Dh to 20Dh.
The circumferential distribution of lateral pressure loss can be divided into three regions and two patterns, as shown in Figure 10. In the mixing vane region, two lower lateral pressure loss regions and three higher lateral pressure loss regions form the “W” pattern near the spacer grid from z = 0Dh to z = 1Dh, especially in the height of the mixing vanes. This “W” pattern of lateral pressure loss generates two vortices in the sub-channels, as shown in Figure 11A. The lateral pressure loss suddenly increases from z = 0Dh to z = 0.4Dh at the angle
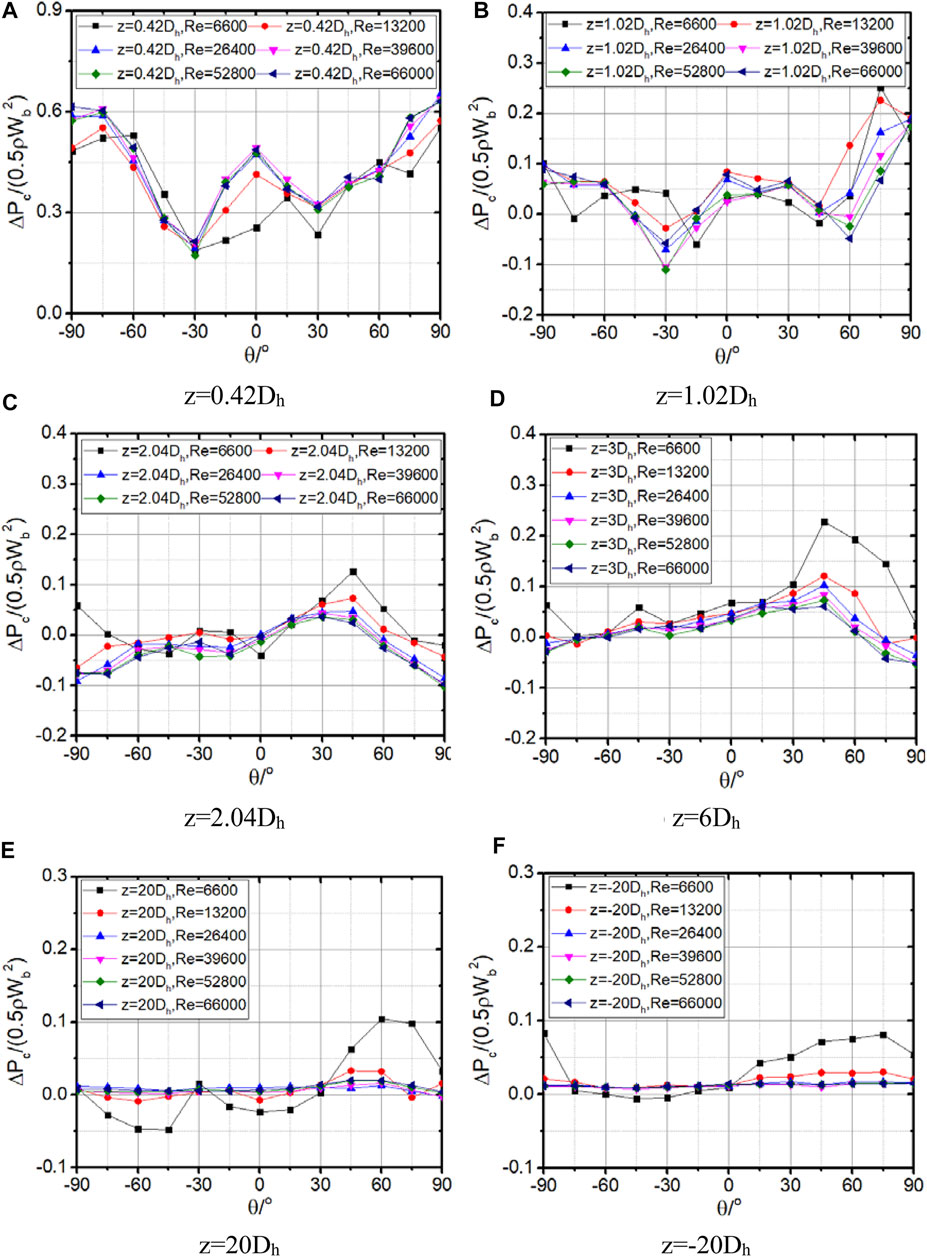
FIGURE 10. Normalized lateral pressure loss with angles.
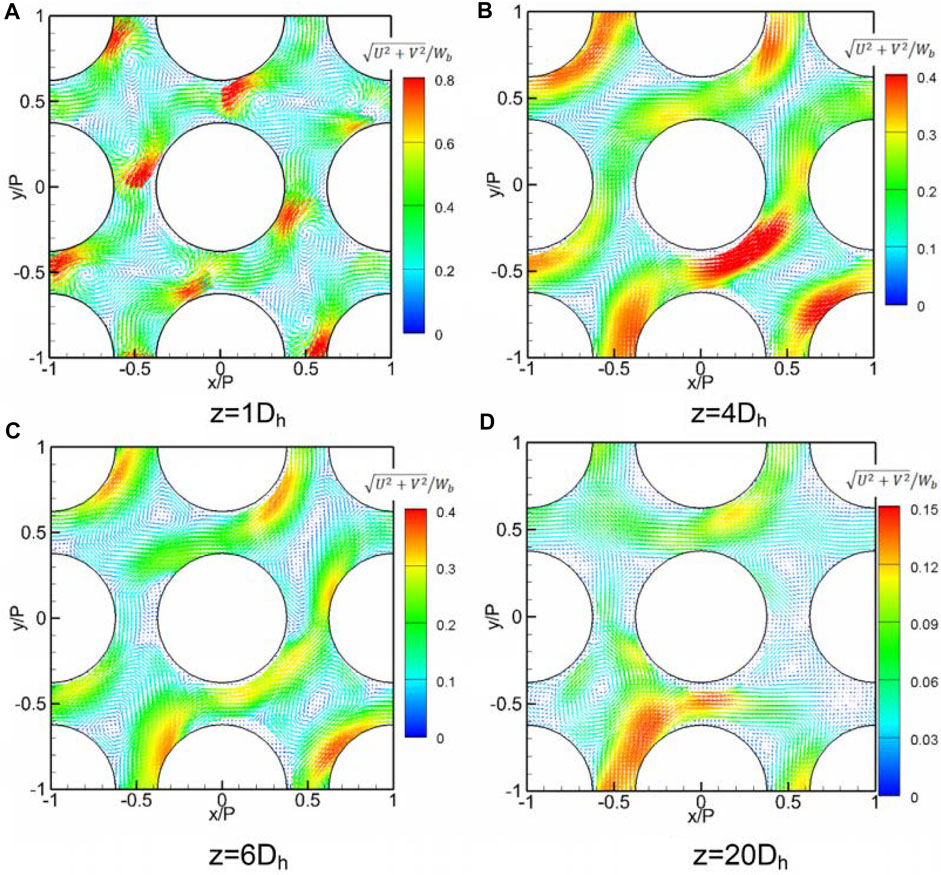
FIGURE 11. Cross-flow structure from z = 1Dh to z = 20Dh (Xiong et al., 2020).
In this study, axial and lateral pressure loss in the central inner sub-channels of the 5 × 5–rod bundle were measured from z = −20Dh to z = 20Dh and from
The axial pressure loss shows a weak correlation with the orienting angles and can be divided into three regions. When the flow is fully developed upstream of the spacer grid, the wall friction is the main reason of axial pressure loss, which is a decreasing power function of the Reynolds number. The spacer grid makes the most contribution to the axial pressure loss, and the spacer grid resistance is also a decreasing power function of the Reynolds number. Downstream of the spacer grid, the mixing vanes generate a strong cross flow circulating the rod surface, resulting in additional wall friction compared with the bared rods. This additional wall friction factor quickly increases with the Reynolds number and is almost kept constant when Re = 66,000.
The lateral pressure loss is caused by the mixing vane blockage to the flow area. The lateral pressure loss increases suddenly just upstream of the spacer grid. In the mixing vane height region, the lateral pressure loss increases sharply from z = 0Dh to z = 0.4Dh and decreases quickly from z = 0.4Dh to z = 0.8Dh. The lateral pressure loss is obviously huge enough to generate a strong cross flow comparable with the bulk velocity. The “W” pattern of circumferential distribution of lateral pressure loss generates two vortices in the sub-channels. After the flow passes through the mixing vanes, the lateral pressure loss continuously decreases from z = 0.8Dh to z = 2Dh, and the circular distribution pattern of lateral pressure loss becomes the “Λ” pattern. The lateral pressure loss increases slightly from z = 2Dh to z = 3Dh, and then it decreases slowly until it becomes nearly constant at z = 20Dh. All these deformations of lateral pressure loss will make the cross-flow pattern change later. As the flow develops downstream of the spacer grid, the cross-flow resistance becomes larger and larger until the cross flow disappears.
The raw data supporting the conclusions of this article will be made available by the authors, without undue reservation.
WQ: methodology and writing—original draft, review, and editing. WY: experimental labor and data processing. JX: supervision. XC: supervision.
This work was supported by the China Postdoctoral Science Foundation (2020M681305) and National Key R&D Program of China (2018YFE0116100).
The authors declare that the research was conducted in the absence of any commercial or financial relationships that could be construed as a potential conflict of interest.
Agbodemegbe, V. Y., Cheng, X., Akaho, E. H. K., and Allotey, F. K. A. (2015). Correlation for Cross-Flow Resistance Coefficient Using STAR-CCM+ Simulation Data for Flow of Water through Rod Bundle Supported by Spacer Grid with Split-type Mixing Vane. Nucl. Eng. Des. 285, 134–149. doi:10.1016/j.nucengdes.2015.01.003
Brkić, D. (2011). Review of Explicit Approximations to the Colebrook Relation for Flow Friction. J. Pet. Sci. Eng. 77, 34–48. doi:10.1016/j.petrol.2011.02.006
Caraghiaur, D., Anglart, H., and Frid, W. (2009). Experimental Investigation of Turbulent Flow through Spacer Grids in Fuel Rod Bundles. Nucl. Eng. Des. 239, 2013–2021. doi:10.1016/j.nucengdes.2009.05.029
Cevolani, S. (1995). ENEA Themohydraulic Data Base for the Advanced Water-Cooled Reactor Analysis. in 1st Research Co-ordination Meeting of IAEA CRP on Thermohydraulic Relationships for Advanced Water Cooled Reactors, Vienna, Austria.
Chang, D., and Tavoularis, S. (2015). Hybrid Simulations of the Near Field of a Split-Vane Spacer Grid in a Rod Bundle. Int. J. Heat Fluid Flow 51, 151–165. doi:10.1016/j.ijheatfluidflow.2014.07.005
Chang, S. K., Moon, S. K., Baek, W. P., and Choi, Y. D. (2008). Phenomenological Investigations on the Turbulent Flow Structures in a Rod Bundle Array with Mixing Devices. Nucl. Eng. Des. 238, 600–609. doi:10.1016/j.nucengdes.2007.02.037
Chen, N. H. (1979). An Explicit Equation for Friction Factor in Pipe. Chem. Eng. 18 (3), 296–297. doi:10.1021/i160071a019
Chen, X., Du, S., Zhang, Y., Yu, H., Li, S., Peng, H., et al. (2017). Validation of CFD Analysis for Rod Bundle Flow Test with Vaned Spacer Grids. Ann. Nucl. Energ. 109, 370–379. doi:10.1016/j.anucene.2017.05.055
Cheng, S.-K., and Todreas, N. E. (1986). Hydrodynamic Models and Correlations for Bare and Wire-Wrapped Hexagonal Rod Bundles - Bundle Friction Factors, Subchannel Friction Factors and Mixing Parameters. Nucl. Eng. Des. 92, 227–251. doi:10.1016/0029-5493(86)90249-9
Cheng, S., Chen, H., and Zhang, X. (2017). CFD Analysis of Flow Field in a 5 × 5 Rod Bundle with Multi-Grid. Ann. Nucl. Energ. 99, 464–470. doi:10.1016/j.anucene.2016.09.053
Chenu, A., Mikityuk, K., and Chawla, R. (2011). Pressure Drop Modeling and Comparisons with Experiments for Single- and Two-phase Sodium Flow. Nucl. Eng. Des. 241, 3898–3909. doi:10.1016/j.nucengdes.2011.07.009
Chun, T.-H., and Oh, D.-S. (1998). A Pressure Drop Model for Spacer Grids with and without Flow Mixing Vanes. Journal of Nuclear Science and Technology Tae-Hyun CHUN, Dong-Seok OH. A Pressure Drop Model for Spacer Grids with and without Flow Mixing Vanes. J. Nucl. Sci. Tech. 35 (1998), 7508–7510. doi:10.1080/18811248.1998.9733899
Churchill, S. W. (1973). Empirical Expressions for the Shear Stress in Turbulent Flow in Commercial Pipe. Aiche J. 19 (2), 375–376. doi:10.1002/aic.690190228
Churchill, S. W. (1977). Friction Factor Equation Spans All Fluid-Flow Regimes. Chem. Eng. 7, 91–92.
Cigarini, M., and Donne, M. D. (1988). Thermohydraulic Optimization of Homogeneous and Heterogeneous Advanced Pressurized Water Reactors. Nucl. Tech. 80, 107–132. doi:10.13182/nt88-a35553
Colebrook, C. F. (1939). Turbulent Flow in Pipes with Particular Reference to the Transition Region between the Smooth and Rough Pipe Laws. Prog. Ind. Civil Eng. 11. doi:10.1680/ijoti.1939.13150
Deng, J., Lu, Q., Wu, D., Wang, C., Guo, C., Mi, Z., et al. (2020). Sub-channel Code Development of lead-bismuth Eutectic Fast Reactor Available for Multiple Fuel Assembly Structures. Ann. Nucl. Energ. 149, 107769. doi:10.1016/j.anucene.2020.107769
Epiney, A., Mikityuk, K., and Chawla, R. (2010). TRACE Qualification via Analysis of the EIR Gas-Loop Experiments with Smooth Rods. Ann. Nucl. Energ. 37, 875–887. doi:10.1016/j.anucene.2010.01.020
Fang, X., Xu, Y., and Zhou, Z. (2011). New Correlations of Single-phase Friction Factor for Turbulent Pipe Flow and Evaluation of Existing Single-phase Friction Factor Correlations. Nucl. Eng. Des. 241, 897–902. doi:10.1016/j.nucengdes.2010.12.019
Haaland, S. E. (1983). Simple and Explicit Formulas for the Friction Factor in Turbulent Pipe Flow. J. Fluids Eng. 105, 89–90. doi:10.1115/1.3240948
Han, B., Yang, B.-W., and Zha, Y. (2018). Numerical Study on the Effect of Grid Mixing Span in 2 × 1 Spacer Grid. Nucl. Eng. Des. 339, 11–20. doi:10.1016/j.nucengdes.2018.08.030
Idelchik, I. E. (1986). Handbook of Hydraulic Resistance. New York: Hemisphere Publishing Corporation.
In, W. K., Shin, C. H., Kwack, Y. K., and Lee, C. Y. (2015). Measurement and CFD Calculation of Spacer Loss Coefficient for a Tight-Lattice Fuel Bundle. Nucl. Eng. Des. 284, 153–161.
Lee, C. Y., Shin, C. H., and In, W. K., (2012). Pressure Drop in Dual-Cooled Annular and Cylindrical Solid Fuel Assemblies for Pressurized Water Reactor. Nucl. Eng. Des. 250, 287–293. doi:10.1016/j.nucengdes.2012.05.039
Li, X., Chen, D., and Hu, L. (2019). Numerical Investigation on Mixing Performance in Rod Bundle with Spacer Grid Based on Anisotropic Turbulent Mixing Model. Int. J. Heat Mass Transfer 130, 843–856. doi:10.1016/j.ijheatmasstransfer.2018.10.121
Li, X., and Gao, Y. (2014). Methods of Simulating Large-Scale Rod Bundle and Application to a 17×17 Fuel Assembly with Mixing Vane Spacer Grid. Nucl. Eng. Des. 267, 10–22. doi:10.1016/j.nucengdes.2013.11.064
Liu, J., and Todreas, N. (1979). The Comparison of Available Data on PWR Assembly Thermal Hydraulic Behavior with Analytical Predictions. Cambridge: Energy Laboratory and Department of Nuclear Engineering, 83–86.
Manadilli, G. (1997). Replace Implicit Equations with Signomial Functions. Chem. Eng. 104 (8), 129–132.
Maskal, A. B., and Aydogan, F. (2017). Mathematical Spacer Grid Models for Single Phase Flow. Ann. Nucl. Energ. 103, 130–146. doi:10.1016/j.anucene.2017.01.019
McClusky, H. L., Holloway, M. V., Beasley, D. E., and Conner, M. E. (2002). Development of Swirling Flow in a Rod Bundle Subchannel. J. Fluids Eng. 124, 747–755. doi:10.1115/1.1478066
McClusky, H. L., Holloway, M. V., Conover, T. A., Beasley, D. E., Conner, M. E., and Smith, L. D. (2003). Mapping of the Lateral Flow Field in Typical Subchannels of a Support Grid with Vanes. J. Fluids Eng. 125, 987. doi:10.1115/1.1625688
Pacio, J., Daubner, M., Fellmoser, F., Litfin, K., Marocco, L., Stieglitz, R., et al. (2014). Heavy-liquid Metal Heat Transfer experiment in a 19-rod Bundle with Grid Spacers. Nucl. Eng. Des. 273, 33–46. doi:10.1016/j.nucengdes.2014.02.020
Qu, W., Wang, Z., Xiong, J., and Cheng, X. (2019a). Experimental Study of Cross Flow and Lateral Pressure Drop in a 5×5 Rod Bundle with Mixing Vane Spacer Grid. Nucl. Eng. Des. 353, 110209. doi:10.1016/j.nucengdes.2019.110209
Qu, W., Xiong, J., Chen, S., and Cheng, X. (2019b). High-fidelity PIV Measurement of Cross Flow in 5×5 Rod Bundle with Mixing Vane Grids. Nucl. Eng. Des. 344, 131–143. doi:10.1016/j.nucengdes.2019.01.021
Rehme, K. (1973). Pressure Drop Correlations for Fuel Element Spacers. Nucl. Tech. 17, 15–23. doi:10.13182/nt73-a31250
Rehme, K. (1970). Widerstandsbeiwerte von Gitterabstandshaltern für Reaktorbrennelemente. Atomke rnenergie 15/2, 127–130.
Savatteri, C., Warnsing, R., Loens, J., and Kottowski, H. (1986). Results and Comparison of Dry-Out in Grid and Wire Spaced Bundles at Single- and Two-phase Flow. in Proc.12th Liquid Metal Boiling Working Group (Grenoble, France: LMBWG), 164–190.
Schikorr, M., Bubelis, E., Mansani, L., and Litfin, K. (2010). Proposal for Pressure Drop Prediction for a Fuel Bundle with Grid Spacers Using Rehme Pressure Drop Correlations. Nucl. Eng. Des. 240, 1830–1842. doi:10.1016/j.nucengdes.2010.03.039
Sibel Tas-Koehler, G. L., Krepper, Eckhard., Unger, Sebastian., and Hampel, Uwe. (2020). Numerical Investigation on the Effect of Transversal Fluid Field Deformation on Heat Transfer in a Rod Bundle with Mixing Vanes. Nucl. Eng. Des. 361, 110575. doi:10.1016/j.nucengdes.2020.110575
Sonnad, J. R., and Goudar, C. T. (2006). Turbulent Flow Friction Factor Calculation Using a Mathematically Exact Alternative to the Colebrook–White Equation. J. Hydraul Eng. ASCE 132 (8), 7. doi:10.1061/(asce)0733-9429(2006)132:8(863)
Tapucu, A. (1977). Studies on Diversion Crossflow between Two Parallel Channels Communicating by a Lateral Slot. 1: Transverse Flow Resistance Coefficient. Nucl. Eng. Des. 42, 297–306. doi:10.1016/0029-5493(77)90191-1
Toptan, A., Porter, N. W., Salko, R. K., and Avramova, M. N. (2018). Implementation and Assessment of wall Friction Models for LWR Core Analysis. Ann. Nucl. Energ. 115, 565–572. doi:10.1016/j.anucene.2018.02.022
Turankok, N., Moreno, F., Bantiche, S., Bazin, F., Biscay, V., Lohez, T., et al. (2020). Unsteady Pressure and Velocity Measurements in 5×5 Rods Bundle Using Grids with and without Mixing Vanes. Nucl. Eng. Des. 364, 110687. doi:10.1016/j.nucengdes.2020.110687
Vog, P., Markfort, D., and Ruppert, E., (1971). A thermal-hydraulic Analysis for Fuel Elements with Liquid Metal Cooling, in International Conference of Heat and Mass Transfer, Trogir, Yugoslavia.
Wang, Y., Wang, M., Ju, H., Zhao, M., Zhang, D., Tian, W., et al. (2020). CFD Simulation of Flow and Heat Transfer Characteristics in a 5x5 Fuel Rod Bundles with Spacer Grids of Advanced PWR. Nucl. Eng. Tech. 52, 1386–1395. doi:10.1016/j.net.2019.12.012
Wu, J. M., Liang, H. Y., Zhu, F. J., and Lei, J. (2017). CFD Analysis of the Impact of a Novel Spacer Grid with Longitudinal Vortex Generators on the Sub-channel Flow and Heat Transfer of a Rod Bundle. Nucl. Eng. Des. 324, 78–92. doi:10.1016/j.nucengdes.2017.08.029
Xiong, J., Cheng, R., Lu, C., Chai, X., Liu, X., and Cheng, X. (2018). CFD Simulation of Swirling Flow Induced by Twist Vanes in a Rod Bundle. Nucl. Eng. Des. 338, 52–62. doi:10.1016/j.nucengdes.2018.08.003
Xiong, J., Qu, W., Zhang, T., Chai, X., Liu, X., and Yang, Y. (2020). Experimental Investigation on Split-Mixing-Vane Forced Mixing in Pressurized Water Reactor Fuel Assembly. Ann. Nucl. Energ. 143, 107450. doi:10.1016/j.anucene.2020.107450
Keywords: pressure loss, resistance model development, rod bundle assembly, spacer grid, sliding pressure loss measurement
Citation: Qu W, Yao W, Xiong J and Cheng X (2021) Experimental Study of Pressure Loss in a 5 × 5–Rod Bundle With the Mixing Vane Spacer Grid. Front. Energy Res. 9:675494. doi: 10.3389/fenrg.2021.675494
Received: 03 March 2021; Accepted: 10 May 2021;
Published: 09 June 2021.
Edited by:
Hitesh Bindra, Kansas State University, Manhattan, United StatesReviewed by:
Juliana P. Duarte, Virginia Tech, Blacksburg, United StatesCopyright © 2021 Qu, Yao, Xiong and Cheng. This is an open-access article distributed under the terms of the Creative Commons Attribution License (CC BY). The use, distribution or reproduction in other forums is permitted, provided the original author(s) and the copyright owner(s) are credited and that the original publication in this journal is cited, in accordance with accepted academic practice. No use, distribution or reproduction is permitted which does not comply with these terms.
*Correspondence: Jinbiao Xiong, xiongjinbiao@sjtu.edu.cn
Disclaimer: All claims expressed in this article are solely those of the authors and do not necessarily represent those of their affiliated organizations, or those of the publisher, the editors and the reviewers. Any product that may be evaluated in this article or claim that may be made by its manufacturer is not guaranteed or endorsed by the publisher.
Research integrity at Frontiers
Learn more about the work of our research integrity team to safeguard the quality of each article we publish.