 Shuran Liu
 Meng Cheng
 Qinhao Xing
 Qianliang Xiang
- Smart Grids and Consulting, ABB Power Grids Investment (China) Ltd, Beijing, China
One of the key challenges facing distribution network operators today is the expected increase in electric vehicles. The increased load from EV charging will result in distribution assets becoming “thermally overloaded” due to higher operating temperatures. In addition to the issue of increased load, we have a limited understanding of the behavior and performance of the distribution assets and their potential to accept the increased load. It has been well acknowledged that EVs increase the network loading level, leading to a reduced system reliability performance. These results have not been quantified in a realistic case study, including actual cable rating and design properties. To address this gap, this paper proposes a novel methodology in the existing power network reliability evaluation framework, which quantifies the impact of different EV penetration levels on distribution network reliability, and the thermal performance of distribution cables. Novel approaches using smart switching technology and emergency uprating are proposed to reduce the peak power demand caused by EVs, in order to reinforce the reliability of the grid and to boost the maximum allowable EV penetration in the distribution networks. The methodology was applied using a case study on the modified EV-integrated RBTS (Roy Billinton Test System) bus four distribution network. The results showed that the negative impact of EVs on network performance can be mitigated by the implementation of smart switching technology. The peak demand under contingencies can also be accepted by the cables though emergency uprating. The frequency and duration of EV demand interruption was also significantly reduced. Thus, a higher EV penetration can be accommodated.
Introduction
The rapid development of electric vehicles (EV) has caused heavy stress to conventional power grids. The peak power demand caused by EV charging requires a more flexible and intelligent network, posing a great challenge for future smart grids. As the rapid development of EVs, distribution network operators (DNOs) will be responsible for upgrading their existing network to supply the EV charging points. Therefore, utilities are investigating innovative solutions to reinforce their existing distribution networks to satisfy the increasing demand of EVs (Akmal et al., 2014).
However, most existing urban distribution networks are designed solely based on a typical residential load cycle, without consideration for massive EV connections and random EV charging patterns (Green et al., 2011; Health Systems in Transition, 2013). Most existing distribution networks are more than 30 years old in the United Kingdom, which is operating close to the thermal limit after years of demand growth. DNOs initially planned to replace and upgrade most of their network within the next 20 years, gradually due to budget constraints (Report and Closedown, 2016). However, the expected EV market share will be more than 40% by 2030, and certain geographical clusters will have a higher penetration of EVs (Hadley and Tsvetkova, 2009). Therefore, DNOs are forced to develop economic solutions to enhance the network capacity for increased EV integration over the next 5–10 years.
The impact of EV charging at distribution networks, including component overloading, feeder congestion and undue faults. Different aspects of the impact, such as energy loss, voltage profiles, the reduced lifetime of the network components, the thermal loading of cables and transformers, are considered in some studies (Green et al., 2010; Fernandez et al., 2011). However, limited work has been published to quantify the impacts on the feeder cables in the presence of EV charging.
Controlled smart charging techniques or Vehicle-to-Grid (V2G) technology aids the power grid by reducing the peak load and transmission congestion, minimizing their effect on the distribution system assets, and reducing investments in the network reinforcements (Verzijlbergh et al., 2012; Aravinthan and Jewell, 2015; Mehta et al., 2018). However, similar to distributed generation (DG), DNOs would have no control over the location of future EV charging points or stations, and no direct control over the period and frequency of EV charging (Fernandez et al., 2011). How to schedule the charging for each EV based on their battery state and their availability for charging is a key question. Consequently, uncontrolled stochastic EV charging would be more common for most situations in the early future.
Several literature describing new business models for the successful integration of EVs into the distribution network have been published (Denholm, 2006; Fernandez et al., 2011). Public aggregated charging points and charging stations infrastructures, called “aggregators,” can be developed by intermediate service providers, while distributed charging infrastructures will still be installed at each household. Compared to distributed EVs, EV aggregators can be coordinated by DNOs to provide an ancillary service at the appropriate large-scale power system level. However, limited literature has considered the existence of both aggregated and distributed charging in relation to distribution network operations and planning.
During normal operations, medium voltage radial distribution circuits reserve around 50% of their total capacity for emergency operations. The reserved capacity can be utilized to accommodate more EVs. However, in a restructured network during emergency restoration, distribution lines may operate close to their capacity limits or even overloaded due to the increased load of EV charging. The utilization of the emergency rating on the distribution cables provides more network flexibility and reduces the interruption of EV charging demands during emergency restoration. Automated switches are becoming a key component in electric distribution systems (U. S. Department of Energy, 2012). These smart switch devices can also be utilized in an EV-integrated distribution network, to perform corrective EV load shedding actions in response to sensing an overload condition, or by receiving control signals from the network operator. However, no existing literature has considered employing emergency uprating or smart switching to solve the problem of feeder congestion due to EV connections.
This paper utilized the proposed power network reliability framework integrating cable design and aging (Kopsidas and Liu, 2018) to evaluate the impact of EV charging on increased thermal loading and the thermal aging of feeder cable circuits, as well as the overall distribution network reliability. The aim of this methodology is to achieve a better prediction of the network’s reliability and distribution cable performance when a high penetration of EVs is integrated into the existing distribution network. Another aim of this study was to evaluate the potential of utilizing emergency uprating or smart switching to enable a higher penetration of EVs connected to the electric grid for charging.
Proposed Methodological Approach
Overview of the Proposed Methodology
To quantify the impact of electric vehicle charging on the behavior and performance of the distribution assets, as well as the overall distribution network reliability, the proposed sequential Monte Carlo based network reliability evaluation framework was integrated with asset failure and repair modeling, EV charging and demand restoration modeling, and distribution network power restoration modeling. The outline of the proposed methodology has been shown in Figure 1.
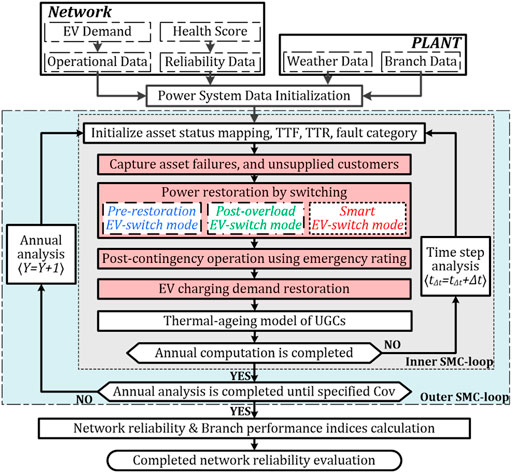
FIGURE 1. Methodological flowchart for evaluating the EV impact in the distribution network.
The methodology initially started by generating a time-to-fail (TTF) and time-to-repair (TTR) for each asset considering the characteristics of the internal and external fault categories. The health score for each asset determined the internal failure rate for the distribution assets using the United Kingdom DNO common network asset indices methodology, which is further explained in section “Asset Failure and Repair Modeling.”
For the distribution networks integrated with EVs, new load profiles need to be constructed by adding different EV charging profiles to the original household loads. EV charging profiles for residential and non-residential EV parks were modeled according to the EV arrival pattern and charging duration pattern, both of which follow normal distribution to consider the randomness of EV charging demand. The detailed modeling of EV charging profiles is described in section “EV Charging Modeling.”
The methodology was used to perform the inner SMC-loop for the time step analysis, and the outer SMC-loop for the annual analysis. Within each time step analysis, the methodology captured whether there was any asset failure, and any customer without supply. A network reconfiguration algorithm was then used to restore supply to as many customers as possible using switching actions. Once the restoration is established, distribution cables on the neighboring feeder usually operate close to their capacity limits and in some occasions could be temporarily overloaded. To avoid overloading, the EV charging demand needs to be shed, thus three operational modes under different contingencies were designed for aggregated EV charging parks: Pre-restoration EV-off mode, Post-overload EV-off mode and Smart switch mode. The detailed description of the three models has been provided in section “Network Restoration Modeling.”
In the restructured distribution network, emergency ratings could be employed to allow for increased loading during emergency restoration. This study considered the three different underground cable (UGC) ratings (normal rating Inormal, cyclic rating Icyclic, and emergency rating Ieme) to indicate the impact of emergency rating employment on network reliability, EV interruption reduction, and cable aging.
If some of the EV charging demand was interrupted during any network contingencies, the EV battery will continue to be charged until it is full after the interruption finishes, thus the interrupted EV charging demand needs to be restored. The detailed modeling of the EV charging demand restoration procedure has been described in section “EV Demand Restoration Modeling.”
This study introduced an EDNS (EV Demand Not Satisfied, MWh/yr) index that represents that the charging demand of the EVs might not be fully satisfied since less energy can be charged into the batteries during a period of emergency dispatching. Although all interrupted EV charging demands will be restored after the contingency, the EDNS index indicates the quality of the EV charging service. The frequency and duration of the EV charging demand interruption was captured for every EV charging point using the EFEI (Expected Frequency of EV charging demand Interruption, occ./yr) and EDEI (Expected Duration of EV charging demand Interruption, hrs/yr) index. The mathematical equations for EDNS, EFEI and EDEI have been stated in Eq. 1, Eq. 2, and Eq. 3, where SysDNSY is the EV charging demand not satisfied during the system contingency in year Y, DEIP,Y is the duration of EV demand interruption at EV charging point P, in year Y, FEIP,Y is the frequency of the EV demand interruption at EV charging point P, in year Y.
Asset Failure and Repair Modeling
Since most cable failure is caused by digging activities instead of internal failures, this study considers there to be two types of failures for feeder cables; failures caused by external human activities and failures caused by internal aging reasons. Overhead lines (OHLs) and transformers consider there to be two types of outage: internal failure and external maintenance outage.
The internal failure rates λinternal for the distribution assets were computed based on United Kingdom DNO Common Network Asset Indices Methodology (Health and Criticality, 2017). A health score (HS) between 0.5 and 10 is allocated to each network component. The smallest HS = 0.5 and the largest HS = 10 represents a component in very good and in a very poor condition respectively. The health score of a new component initializes at HS = 0.5 and increases along with time due to aging. A third order polynomial relates failure rates to the health scores, as shown in Eq. 4, where H is a variable equal to the Health Score unless H ≤ 4 then H = 4 to ensure that the failure rates are not initially too low, K and C are the constants that are defined for each type of asset in (Health and Criticality, 2017). The constants for different distribution assets have been stated in Table 1.
Considering the randomness of the internal failures, an exponential distribution was used to calculate the time-to-fail TTFinternal and time-to-repair TTRinternal values, as shown in Eq. 5, Eq. 6, using the internal failure rate λinternal and mean repair duration Dinternal with an unavailability U which is randomly generated from a uniform distribution U (0,1) (Billinton and Li, 1994).
As provided in Table 1, the external failure rates for the UGCs and maintenance outage rates for OHLs and transformers were set to be constant throughout the asset lifetime. The mean repair durations for the internal and external failures of the distribution assets have been provided in (Allan et al., 1991).
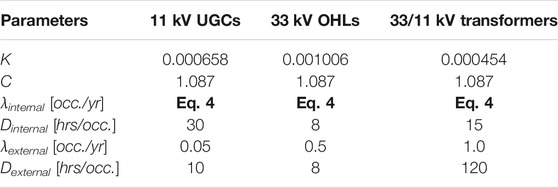
TABLE 1. Reliability parameters of the distribution assets in the modified RBTS.
For cable external failures and maintenance outages, time to failure, TTFexternal, was generated in Eq. 7 using an exponential distribution. The time to repair TTRexternal was calculated in Eq. 8 for the asset subject to a normal distribution Nor with a standard deviation SD = 25%.
SD = 25% is a reasonable assumption that could be redefined as further data becomes available. Using normal distribution limits, the extent to which repair durations vary dramatically from the average (Clements and Mancarella, 2018).
Electric Vehicle Charging and Restoration Modeling
Electric Vehicle Charging Modeling
Under an uncontrolled charging strategy, an EV will consume charging power after it is parked until its battery is fully charged. In this study, the EV charging pattern was modeled by the EV arrival pattern and charging duration pattern. The charging duration was related to the power consumption in the last drive, namely the charging power of EV battery. Each individual EV was assumed to have a 50 kW capacity and a charging speed of 1.44 kW/h (120 V 12 A), using the example of the “Tesla Model 3.” It is assumed that EVs are always charged with a constant power draw that is equal to the charging speed.
Figure 2 illustrates the average number of EVs to arrive, N_EVavg(tΔt), for every 100 EV charging slots in residential areas (distributed or aggregated parking) and non-residential areas (commercial or industrial parking lot) during weekdays and weekends (Wu et al., 2011). The average charging power consumption profile for every 100 EV charging slots has been calculated and displayed in Figure 2.
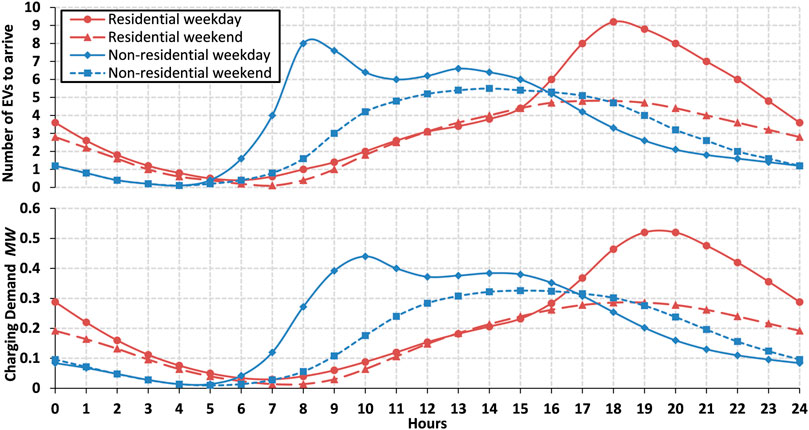
FIGURE 2. EV arrival pattern and average charging power demand pattern.
Considering the randomness of the EV arrival pattern changes, the actual simulated number of arrived EVs, N_EVP(tΔt) in parking lot P, at time tΔt, was calculated in Eq. 9, subject to a normal distribution Nor with a standard deviation SD = 20%, where N_EVSP was the number of EV charging slots in parking space P, and N_EVavg(tΔt) was the number of EVs to arrive per 100 EV charging slots at time tΔt.
The actual simulated charging power consumption P_EVP(tΔt) at parking lot P, at time tΔt, is calculated in Eq. 10, where Pcharging is the EV charging speed, D_EVP(tΔt) is the charging duration of EVs parked in parking lot P, at time tΔt.
Electric Vehicle Demand Restoration Modeling
EV charging in EV parking lots can be interrupted deliberately by the network operator due to circuit overloading under emergency contingency conditions. The interrupted EV batteries will continue to be charged until they are full, thus EV charging demand needs to be restored once the network contingency ends and the service is back online. The EV demand restoration modeling and constraint criteria have been described by the following Eq. 11, Eq. 12.
The new EV charging demand P_EVP,new(tΔt) of parking lot P at tΔt during the restoration period is the sum of the original EV charging demand P_EVP (tΔt) and the restored EV charging demand P_EVP,res(tΔt), as expressed by Eq. 11.
The restored EV charging demand P_EVP,res(tΔt), can be calculated by Eq. 12, where P_EVP,int,total is the total interrupted EV charging demand, N_EVP,int,total is the total number of interrupted EVs, N_EVP,res is the number of EVs which were fully restored, t0 is the time when the restoration started. This equation indicates that the restored EV charging demand is constrained by the EV charging speed, the number of EVs that still needed to be restored, and the total demand that still needs to be restored.
Network Restoration Modeling
In distribution networks, transformers, lines (OHLs and cables), busbars and breakers may incur a failure or undergo scheduled maintenance. In response to both, suitable network restoration actions should be taken to restore service to as many affected customers in the out-of-service areas as possible using both switching actions and cable emergency loading. The affected area around the fault point can be divided into repaired, upstream and downstream areas by the switches, as illustrated in Figure 3. The traditional procedure for power restoration in a typical two-feeder open-ring network includes: 1) protection response; 2) upstream restoration; 3) downstream restoration; 4) repairing process.
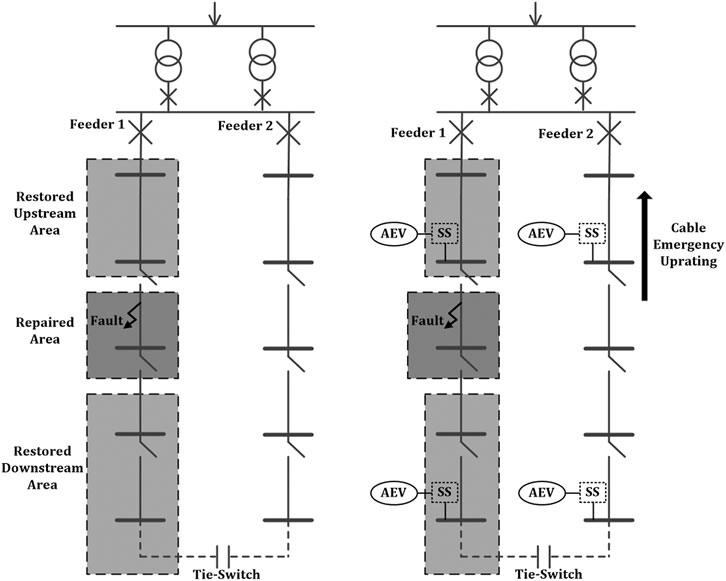
FIGURE 3. An example of power restoration in a two-legged ring network with or without EV connection.
After power restoration is established for a distribution network with EV connection in Figure 3, distribution cables in the neighboring feeder usually operate close to their capacity limits and in some occasions, could be temporarily overloaded. If network constraints such as line capacity constraints cannot be met, alternative actions will be undertaken to satisfy the constraints, such as utilizing the emergency ratings of feeder cables, or abandoning an increased load from aggregated EV (AEV) charging using a smart switch (SS). This study considered three EV operating modes for restructuring distribution networks with an EV connection under the following network contingencies: Pre-restoration EV-switch mode, Post-overload EV-switch mode and Smart EV-switch mode.
1) Pre-restoration EV-switch mode
Pre-restoration EV-switch mode switches off all aggregated EV charging parks connected to the neighboring feeder before the restoration is established. EV charging parks stay disconnected until the repair is finished and the network returns to its pre-contingency structure. For example in Figure 3, two AEV parks on feeder two and one AEV park in the restored downstream area will be disconnected. This scheme provides a conservative approach for distribution networks with EV parks that are equipped without smart switches.
2) Post-overload EV-switch mode
Post-overload EV-switch mode switches off all aggregated EV charging parks connected to the neighboring feeder once any distribution cable on the neighboring feeder is overloaded. It keeps them disconnected until the repair finishes. In principal, this scheme sheds all charging demand from the AEV parks to prevent the cables from further overloading, thermal aging and damage. This mode requires the smart switch devices for EV parks to be opened in response to the monitoring signal indicating cable overloading.
3) Smart EV-switch mode
The Smart EV-switch mode aims to meet as many EV charging demands as possible at the minimum cost. Its objective function and constraints have been stated in Eq. 13, where ocss,P is a binary operation variable indicating whether the smart switch ss at EV park P is closed (=0) or open (=1); costEV is the cost of EV interruption in £/MVA; costPL is the cost of the power losses in £/MVA; Ploss,i(tΔt) is power losses of cable i at time tΔt; costENS is the cost of non-delivered demand in £/MVA and ENS(tΔt) is the customer energy not supplied in MVA.
The only decision variables are operational variables ocss,P, which allow the smart switches to be opened or closed in real time by receiving control signals from other locations. The optimization allows the network operator to decide whether one or more EV charging parks should be disconnected to prevent cable overloading, to satisfy as many EV charging demands as possible, and to minimize the cost of power losses and non-delivered energy.
Case Study Formation
This methodology utilizes the original RTBS bus four network as a realistic example of an existing distribution network in an urban area. The original test network consists of seven feeders (F1–F7), 38 load points (LP1–LP38), disconnecting switches on both sides for each feeder cable and four tie-switches. Disconnecting switches are positioned before and after each load bus on each feeder, to allow for each load bus to be isolated from a fault. The tie-switches (TS1-TS4) are normally open, while all other switches are closed when in a state of normal operation. Only one circuit breaker is equipped at the top of each feeder. The default peak load of the network is the actual 40 MW and 13 MVar. The hourly chronological load profile as described in (Grigg et al., 1999) is used to describe the load profile for this network.
Selection of the Feeder Cables
The RBTS bus four network does not provide thermal limits and circuit design data, therefore the size and current rating of each feeder cable (numbered with C) was carefully selected to ensure that all existing demands can still be fully supplied under the N-1 condition through backfeeding from the normal open points. Four types of single-core un-armored XLPE cables with copper conductors were used in the study. Table 2 shows the selected cable design data, normal and cyclic current rating for each corresponding feeder cable. The cables were assumed to be laid in a trefoil formation (touching) and directly buried in the ground at a depth of 0.8 m. The XLPE cables and soil thermal parameters used in this study have been listed in Table 3.
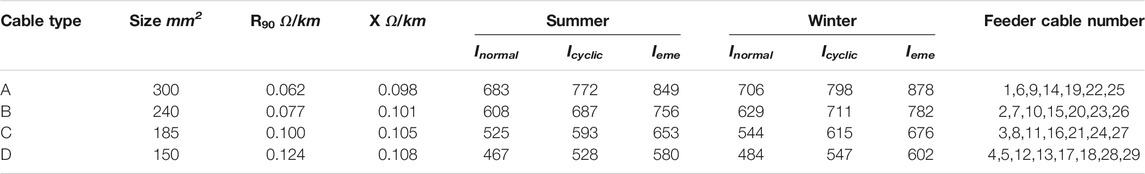
TABLE 2. The cable electrical properties modeled in the RBTS bus four network.
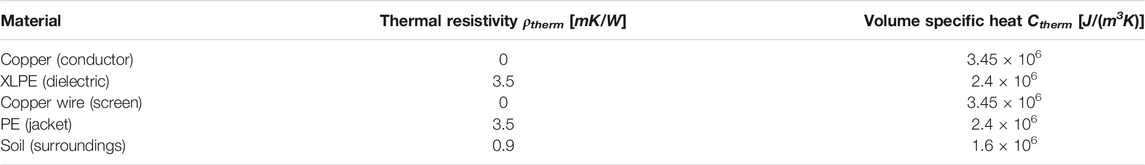
TABLE 3. Thermal parameters in XLPE cables and soil.
The cable’s normal current ratings, Inormal, as shown in Table 2 were calculated at a maximum core temperature of 90°C, 0.9 km/W soil thermal resistivity, and 1.6 J/m3K × 106 J/m3K volume specific heat, which are the default values in ENA P17 (ENA, 2004). The summer (Nov-Apr) and winter (May-Oct) ratings were calculated using a soil temperature of 15 and 10°C respectively, and cyclic ratings, Icyclic, that were 1.13 times the corresponding normal rating based on a cyclic loading factor (Electrical, 2009). For the 11 kV cables forming a two-legged ring network, an emergency rating that is more liberal than the cyclic rating, may be used for the design of such networks. As indicated in (Health Systems in Transition, 2013), distribution utilities allow for an emergency rating, Ieme, which is effectively 110% of the appropriate summer and winter cyclic ratings, to be used in their 11kV UGCs as provided in Table 2.
Modifications of the RBTS Bus four Network
Some modifications have been applied to the RBTS bus four network to simulate a realistic scenario that aggregates the EV park lots and the distributed residential EV charging piles that are both available in the distribution network. The modified RBTS network has been shown in Figure 4.
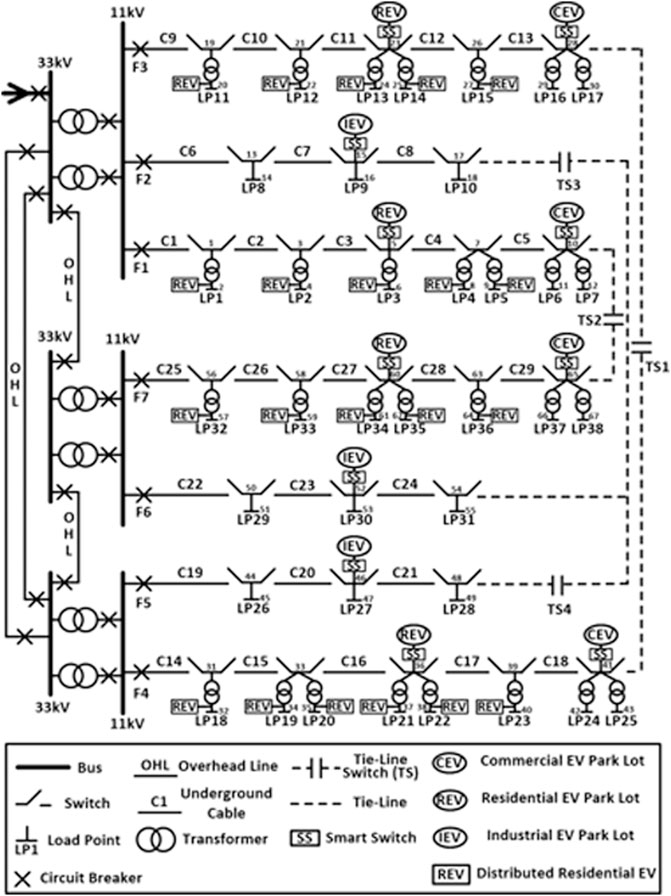
FIGURE 4. Single line diagram of the modified RBTS bus four distribution network.
In Figure 4, distributed residential EVs are connected to each residential load point. Four aggregated residential EV parks are connected directly to four 11 kV buses; bus 5, 23, 36, and 60. The aggregated residential EV (AREV) park on each feeder consists of X% of the total residential EV parking slots, while the distributed residential EV (DREV) charging facilities within each household own the rest.
This study assumes that two individual households exist in each residential customer as defined in the original RBTS bus four network. Each household is assumed to own an average of 1.5 vehicles, thus the total number of residential vehicles was 14,070. The EV penetration level indicates the proportion of the number of EVs compared to the number of total household vehicles in the area.
As shown in Figure 4, four commercial car parks with 1,000 parking slots were integrated into terminal buses 10, 28, 41, and 65, with commercial customers. Three industrial car parks with 2,000 parking slots were integrated into terminal buses 15, 46, and 52 on three short feeders with a small number of users. Commercial and industrial parking lots provide parking spaces and EV charging mainly for workers in offices and factories. The EV penetration level defines the proportion of EV charging slots to the total number of parking slots in all commercial and industrial parking lots.
In this study, it is assumed that X% = 50%, means that half of the EVs are charged at AREV parks, while the other half are charged at DREV slots located at residential load points. The EV penetration level is PEV%, which means that the PEV% of all parking slots were EV charging slots. Thus, the number of EV charging slots on each bus has been shown in Table 4.
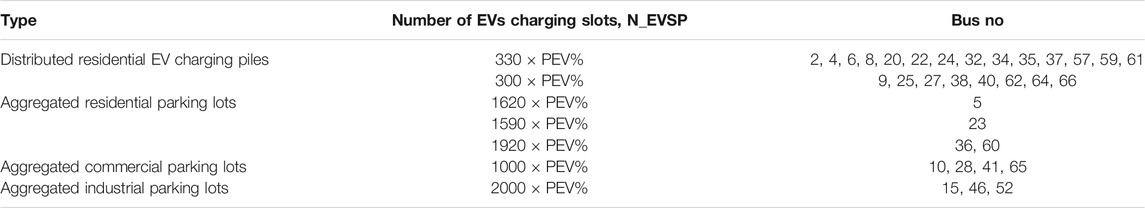
TABLE 4. | Number of EV charging slots on each bus at PEV% penetration level.
A smart switch device was equipped for each EV park lot to perform smart switching actions if required. No control can be applied to individual EVs to provide smart charging and no vehicle-to-grid (V2G) mode was available.
Modeled Scenarios
The scenarios have been described in Table 5. All scenarios consider a health score HS = 10 for all distribution network assets to model an aged distribution network.
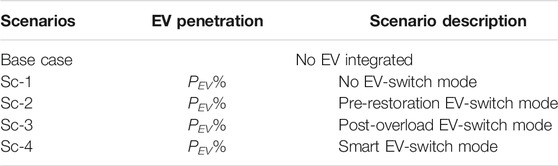
TABLE 5. Modeling Scenarios of EV impact on the distribution network.
Sc-1 does not apply any of the EV-switch modes, where the EV charging demand is the same type of load as normal loads (residential, commercial, and industrial). It is not considered to be a special demand that requires unique EV-switch actions under emergency operations. Sc-2 is the most conservative scenario using the pre-restoration EV-switch mode, which switches off the EV parks before the restoration is established. Sc-3 implements the post-overload EV-switch mode, which allows for the EVs to continue to be charged until overload occurs, and then the EV parks are switched off until the contingency ends. Sc-3 applies the smart EV-switch mode by implementing smart switching, monitoring and control devices, to allow the EV parks to be switched on or off in real-time. The optimal EV switching solution was determined to minimize the total cost of EV charging interruption, power losses and non-delivered demand.
Impact of Electric Vehicles on Network and Cable Performance
The impact of the EV integration on the network’s reliability and cable aging can be indicated by the comparison between the base case and Sc-1. Table 6 illustrates the amount of expected energy not supplied (EENS), expected annual network losses (EANL), expected equivalent network aging (EENA), and the expected EV demand not supplied (EDNS) when the EV penetration level increased from 0% in the base case up to 100% in Sc-1. It is worth mentioning that the normal current rating, Inormal, was utilized in all base cases and Sc-1 scenarios as in Table 6.
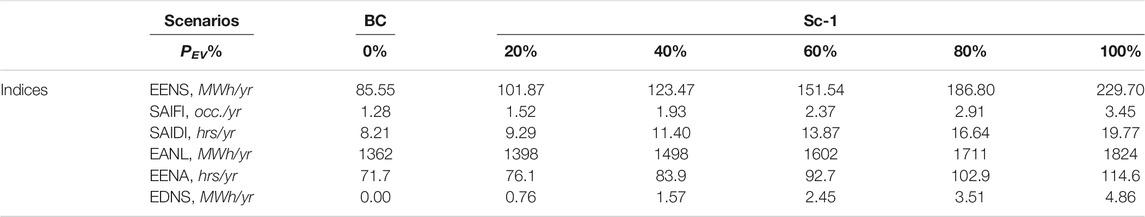
TABLE 6. Network performance indices of the base case and Sc-1
By increasing the EV penetration PEV%, a continuous increase of load curtailment, power losses and cable aging was observed. In particular, the EENS rose from 85.55 MWh in the base case with zero EV integration and peaked at 229.70 MWh at 100% EV penetration. The frequency and duration of the demand interruption also increased by almost three times the maximum values of 3.45 occ./yr and 19.77 h/yr. This indicates a significantly reduced network reliability performance when more EVs are connected in the distribution networks.
The impact of the EV penetration on the feeder cable circuits can be indicated by the increase of EANL and EENA. The additional EV charging demand causes an increase in current loading, and a rise of power losses within the circuits. Based on the basic theory of “Losses = I2R,” the EANL was increased by 33.9% from 1362 to 1824 MWh, suggesting a 15.7% increase in the general loading of the whole distribution network. This result will become worse, considering the natural annual increase of the residential demand of electric vehicles.
The network cable aging was almost doubled from 71.7 to 114.6 h/yr, when the EV penetration was increased to 100%. This aging increase seems to be slow and tolerable for the cables, considering that the expected annual aging is 8760 h/yr. The reason for the aging output is because no emergency and cyclic loading is allowed, thus the cables operate at quite low temperatures at which negligible aging occurs. Sc-1, with the utilization of Inormal, tends to sacrifice the demand when network loading constraints are met, rather than utilize emergency loading to provide extra flexibility and loadability to the network. Consequently, more load curtailment is made but less aging occurs.
Impact of Smart Switching on Electric Vehicle Penetration
Various EV-switch modes were considered in this methodology to provide DNOs with a smarter alternative option to address the EV issues during network contingencies. Table 7Error! Reference source not found. illustrates the amount of expected energy not supplied (EENS), the expected EV demand not supplied (EDNS), the expected duration of EV demand interruption (EDEDI) and the expected equivalent network aging (EENA) across different EV penetrations PEV% from 0 to 100% when various EV-switch modes were utilized. Normal current rating, Inormal, was still utilized in all scenarios within Table 7.
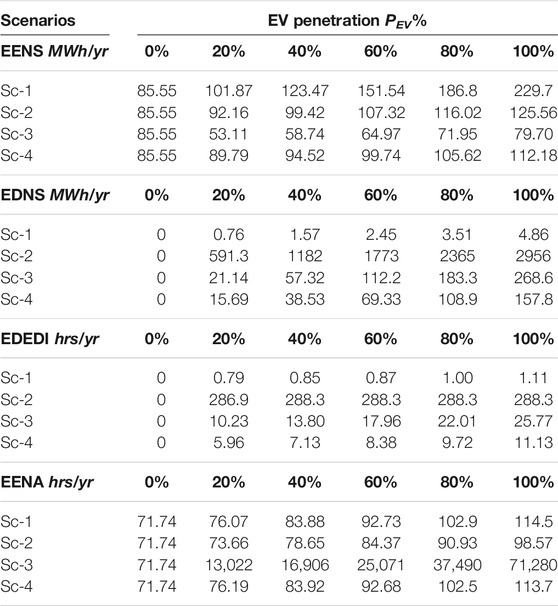
TABLE 7. The output of EENS, EDNS, EDEDI and EENA in Sc-1, Sc-2, Sc-3 and Sc-4 across different EV penetration levels.
Sc-1 achieved the highest load curtailment out of the four scenarios, indicating that the worst network performance was obtained when no EV-switch mode was considered. This is because EV charging demand was the same load type as regular demand, thus load curtailment occurred in both EV and regular demand, and there was no clear priority between these two.
As suggested from the EDNS and EDEDI results, Sc-2 obtained significantly more interruption in relation to the EV charging demand (highest among scenarios), including the amount (EDNS) and the duration (EDEDI) of the interrupted EV demand. This was because Sc-2 disconnected all aggregated EV charging lots before restoration was established, thus the EV charging in the EV park lots was interrupted during all the contingencies, resulting in a huge EDNS and EDEDI.
It is suggested from the EENA results that Sc-3 received significantly more cable aging, which was almost 70 times more than the other three scenarios. Meanwhile, Sc-3 achieved the best reliability performance by obtaining the lowest EENS of 79.7 MWh. Sc-3 disconnected the aggregated EV charging lots when any feeder circuit was overloaded. Compared to Sc-2, Sc-3 fully utilizes the loadability of the cable circuit to satisfy demands before any overload condition occurs, thus the lowest load curtailment was achieved in Sc-3. However, such an operating scheme requires smart switching and associated control devices, to operate the correct switching action in response to the overload signals. Meanwhile, Sc-3 tends to operate the cable circuits at their maximum allowable rating, thus much more cable aging is generated compared to the other scenarios. As a result, the EENS in Sc-3 was reduced to the lowest, at the cost of significantly increased aging. This increased aging may force utilities to perform more frequent condition checks and maintenance and replace heavily loaded and most-aged cables. Thus, this increased aging cost and its related maintenance costs may lead Sc-3 to being considered less cost-worthy.
Sc-4 achieved more EENS than Sc-3, but less than Sc-1 and Sc-2. The second lowest EDNS and EDEDI was obtained by Sc-4, which was only higher than Sc-1. Meanwhile, Sc-4 maintains the cable aging (EENA) to an acceptable level, similar to Sc-1 and Sc-2. This result shows that Sc-4 achieved a relatively low load of curtailment and less frequent EV demand interruption at the cost of tolerable aging. If the utility applies a maximum EENS of 100 MWh as their main criterion to constraint the connection of more EVs, Sc-4 allows for a 60% penetration of EVs, which is 40% more when compared to Sc-1. By setting the EV demand interruption performance as a criterion, a projection of allowable EV penetration can be estimated based on the EDNS or EDEDI. In this case, Sc-4 generates a smaller amount and lower frequency of EV demand interruptions than Sc-2 and Sc-3, thus a higher EV penetration can be enabled using the smart EV-switching mode.
Sc-4 applies a cost optimization tool to achieve the minimum overall operating costs, indicating its significant economic advantage against other operating modes. However, the smart EV-switching mode requires that smart switches are equipped for each EV park under central control and optimization, thus the initial equipment installation cost has not been considered in the total cost computation.
Impact of Emergency Uprating on Electric Vehicle Penetration and Cable Aging
Emergency uprating allows the feeder cables to operate at a higher current rating in the restructured distribution network after contingencies. It provides more network flexibility and loadability to supply the network demand and EV demand under emergency operations. Figure 5 shows the amount of load curtailment (EENS), the equivalent network cable aging (EENA), the system average interruption duration (SAIDI) and the frequency (SAIFI) of Sc-4 when normal (Inormal), cyclic (Icyclic) and emergency (Ieme) ratings are utilized respectively.
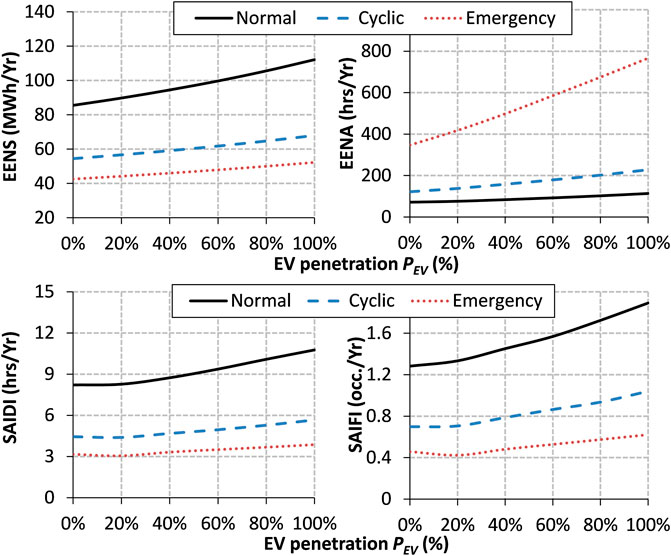
FIGURE 5. EENS, EENA, SAIDI and SAIFI output of Sc-4 when utilizing normal, cyclic and emergency ratings.
As shown in Figure 5, the significant reduction of EENS, SAIDI and SAIFI was observed when increasing the cable rating from Inormal to Icyclic and Ieme, suggesting an effective improvement of the overall network reliability performance. The reduction seems to be very constant across all different EV penetration levels. For example, a constant reduction of over 40 MWh/yr in EENS was observed when the cable rating increased from Inormal to Ieme. This improved network performance was because the increased current rating provided more loadability and flexibility during contingencies, thus more network demand, including regular and EV demand, can be supplied under looser loading constraints. As a result, the negative impact of the EV penetration on the network can be significantly mitigated by the implementation of emergency uprating.
The benefits of emergency uprating can be further indicated by the amount of interrupted EV demand (EDNS) and the expected duration of the EV demand interruption (EDEDI) as in Figure 6. Although the EDNS increased exponentially along with the EV penetration PEV% becoming higher, an effective reduction of EDNS from 158 to 55 MWh/yr was achieved at PEV = 100% by uprating Inormal to Ieme. The EDEDI output showed an almost linear rise when the PEV% increased, and emergency uprating significantly decreased the increasing rate of EDEDI. In particular, the EV interruption duration was reduced by 64% from 11 to 4 h/yr when Ieme was utilized.
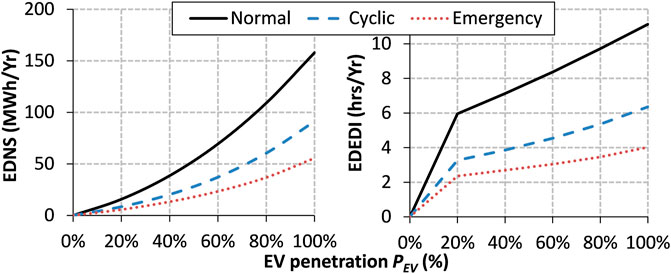
FIGURE 6. EDNS and EDEDI output of Sc-4 when utilizing normal, cyclic and emergency ratings.
The increased load from EV charging will result in the distribution circuits being loaded close to their limits. The network performance worsens, mainly due to the loading constraints of the circuits. From the results, it was indicated that the distribution cables do have the ability to accept additional EV charging demands under emergency loading conditions. The ability stems from the UGCs’ inherent characteristics (i.e. thermal inertia) that allow cycling or emergency currents for a limited period.
The potential risks of ‘thermal overloading’, and thus, aging can be demonstrated by the EENS result in Figure 5. This shows that the emergency uprating leads to increased cable aging, particularly when the PEV% increases. As discussed before, the current rating increase leads to an exponential growth of thermal aging, therefore the network aging caused by emergency rating is much higher than that of normal or cyclic rating. The EENA is 766 h/yr at PEV = 100% when Ieme is used, while it is 228 h/yr for Icyclic and 114 h/yr for Inormal. The growth rate of EENA along with the increase of PEV% is also significantly larger for the emergency rating case.
Conclusion
This paper applied the proposed network reliability evaluation framework to evaluate the impact of electric vehicles integration on a distribution network and the related assets. Two solutions, smart switching and emergency uprating, were proposed to mitigate the negative impact. The methods also enable a higher EV penetration in the existing distribution networks which helps to postpone network upgrades and reinforcements.
The proposed smart switching method requires smart switches and network automation devices (monitoring, optimization, and control) to connect/disconnect the aggregated EV charging park in real time during contingencies. It provides an optimization tool to minimize the cost of cable aging, power losses, load curtailment and EV interruption under the network loading and voltage constraints.
Emergency uprating provides utilities with a simple and direct method to uprate their distribution cables to emergency rating levels under contingency operations. This allows operators to unlock the emergency loadability of UGCs temporarily to loosen the loading constraint and to transmit more power according to demands. However, emergency uprating may lead to both the “current” and “thermal” overloading of cables, and therefore produce increased cable aging. The potential network benefits and cable aging risks can be quantified through the proposed methodology.
The case study on the modified RBTS bus four network has shown that the network reliability performance significantly worsens when a high penetration of EVs is considered. When EV penetration PEV = 100%, the load curtailment was increased by 160% from 85.5 to 229.7 MWh/yr. The smart EV-switching method applied cost optimization to achieve a balance between load curtailment, cable aging and EV demand interruption. Thus, the smart switching method reduces the load curtailment by half while maintaining cable aging and EV charging interruption at an acceptable level. Emergency uprating also provides an effective way to improve network performance at the cost of increased cable aging. Compared to normal rating, emergency rating reduces by half the amount of load curtailment and interrupted EV charging demand. The emergency uprating method could be too risky when a higher current rating is considered.
The proposed methodology allows utilities to determine the optimum emergency rating and operating strategy for their distribution networks with a high penetration of EV connections. Further work is required to design a more advanced network reconfiguration tool to adapt the increasing penetration of EVs.
Data Availability Statement
The original contributions presented in the study are included in the article/Supplementary Material, further inquiries can be directed to the corresponding author.
Author Contributions
SL: conceptualization and writing—original draft preparation. SL and MC: methodology. HX, QHX, and YJ: writing—review and editing. QLX and HX: supervision.
Funding
This research was funded by the National Natural Science Foundation of China, under the project Synergies of Distributed Multi-Energy Systems for Efficient Integration of Large Shares of Renewable Energies (No. 51961135101).
Conflict of Interest
SL, MC, QHX, YJ, QLX, and HX were employed by the company ABB Power Grids Investment (China) Ltd.
References
Akmal, M., Fox, B., Morrow, D. J., and Littler, T. (2014). Impact of Electric Vehicle and Heat Pump Loads on Network Demand Profiles. UK Power Networks.
Allan, R. N., Billinton, R., Sjarief, I., Goel, L., and So, K. S. (1991). A Reliability Test System for Educational Purposes-Basic Distribution System Data and Results. IEEE Trans. Power Syst. 6 (2), 813–820. doi:10.1109/59.76730
Aravinthan, V., and Jewell, W. (2015). Controlled Electric Vehicle Charging for Mitigating Impacts on Distribution Assets. IEEE Trans. Smart Grid 6 (2), 999–1009. doi:10.1109/tsg.2015.2389875
Billinton, R., and Li, W. (1994). Reliability Assessment of Electrical Power Systems Using Monte Carlo Methods. London: Springer. doi:10.1007/978-1-4899-1346-3
Clements, D., and Mancarella, P. (2018). Systemic Modelling and Integrated Assessment of Asset Management Strategies and Staff Constraints on Distribution Network Reliability. Electric Power Syst. Res. 155, 164–171. doi:10.1016/j.epsr.2017.09.029
Denholm, W. S. P. (2006). An Evaluation of Utility System Impacts and Benefits of Optimally Dispatched Plug-In Hybrid Electric Vehicles. National Renewable Energy Laboratory. doi:10.2172/888683
Electrical (2009). Code of Practice 203: Current Ratings - Underground Cables. Electricity North West.
ENA (2004). Standard ENA Engineering Recommendation ER P17: ‘Current Rating Guide for Distribution Cables’. ENA.
Fernandez, L. P., Roman, T. G. S., Cossent, R., Domingo, C. M., and Frias, P. (2011). Assessment of the Impact of Plug-In Electric Vehicles on Distribution Networks. IEEE Trans. Power Syst. 26 (1), 206–213. doi:10.1109/TPWRS.2010.2049133
Green, R. C., Wang, L., and Alam, M. (2010). The Impact of Plug-In Hybrid Electric Vehicles on Distribution Networks: A Review and Outlook. IEEE PES General Meeting, 1–8.
Green, R. C., Wang, L., and Alam, M. (2011). The Impact of Plug-In Hybrid Electric Vehicles on Distribution Networks: A Review and Outlook. Renew. Sust. Energ. Rev. 15 (1), 544–553. doi:10.1016/j.rser.2010.08.015
Grigg, C., Wong, P., Albrecht, P., Allan, R., Bhavaraju, M., Billinton, R., et al. (1999). The IEEE Reliability Test System-1996. A Report Prepared by the Reliability Test System Task Force of the Application of Probability Methods Subcommittee. IEEE Trans. Power Syst. 14 (3), 1010–1020. doi:10.1109/59.780914
Hadley, S. W., and Tsvetkova, A. A. (2009). Potential Impacts of Plug-In Hybrid Electric Vehicles on Regional Power Generation. Electricity J. 22 (10), 56–68. doi:10.1016/j.tej.2009.10.011
Kopsidas, K., and Liu, S. (2018). Power Network Reliability Framework for Integrating Cable Design and Ageing. IEEE Trans. Power Syst. 33 (2), 1521–1532. doi:10.1109/tpwrs.2017.2720196
Mehta, R., Srinivasan, D., Khambadkone, A. M., Yang, J., and Trivedi, A. (2018). Smart Charging Strategies for Optimal Integration of Plug-In Electric Vehicles within Existing Distribution System Infrastructure. IEEE Trans. Smart Grid 9 (1), 299–312. doi:10.1109/tsg.2016.2550559
Report and Closedown (2016). Distribution Asset Thermal Modelling 'ENWL002'. Electricity North West.
U. S. Department of Energy (2012). Reliability Improments from the Application of Distribution Automation Technologies - Initial Results. U.S. Department of Energy.
Verzijlbergh, R. A., Grond, M. O. W., Lukszo, Z., Slootweg, J. G., and Ilic, M. D. (2012). Network Impacts and Cost Savings of Controlled EV Charging. IEEE Trans. Smart Grid 3 (3), 1203–1212. doi:10.1109/tsg.2012.2190307
Wu, D., Aliprantis, D. C., and Gkritza, K. (2011). Electric Energy and Power Consumption by Light-Duty Plug-In Electric Vehicles. IEEE Trans. Power Syst. 26 (2), 738–746. doi:10.1109/tpwrs.2010.2052375
Glossary
costENS Cost of non-delivered demand in £/MVA
costEV Cost of EV interruption in £/MVA
costPL Cost of the power losses in £/MVA
D_EVP(tΔt) Charging duration of EVs parked in parking lot P, at time tΔt
DEIP,Y Duration of EV demand interruption at EV charging point P in year Y
Dexternal Duration of external failure
Dinternal Duration of internal failure
EANL Expected annual network losses, MWh/yr
EDEI Expected Duration of EV charging demand Interruption, hrs/yr
EDNS EV Demand Not Satisfied, MWh/yr
EENA Expected equivalent network aging, hrs/yr
EENS Expected energy not supplied, MWh/yr
EFEI Expected Frequency of EV charging demand Interruptio, occ./yr
ENS(tΔt) Customer energy not supplied in MVA
FEIP,Y Frequency of EV demand interruption at EV charging point P in year Y
Icyclic Cyclic rating, A
Ieme Emergency rating, A
Inormal Normal rating, A
N_EVavg(tΔt) Average number of EVs to arrive per 100 EV charging slots at time tΔt
N_EVP(tΔt) Actual simulated number of arrived EVs in parking lot P at time tΔt
N_EVP,int,total Total number of interrupted EVs
N_EVP,res The number of EVs which were fully restored
N_EVSP Number of EV charging slots in parking space P
NY Number of simulation years
ocss,P Variable indicating whether smart switch ss at EV park P is closed(0) or open(1)
P EV charging point number
P_EVP (tΔt) Original EV charging demand of parking lot P at tΔt
P_EVP(tΔt) Charging power consumption at parking lot P, at time tΔt
P_EVP,int,total Total interrupted EV charging demand
P_EVP,new(tΔt) New EV charging demand of parking lot P at tΔt during the restoration period
P_EVP,res(tΔt) Restored EV charging demand of parking lot P at tΔt
Pcharging EV charging speed
PEV EV penetration level, %
Ploss,i(tΔt) Power losses of cable i at time tΔt
SysDNSY EV charging demand not satisfied during the system contingency in year Y
t0 The time when the restoration started
TTFexternal Time to failure for external failures
TTFinternal Time to failure for internal failures
TTRexternal Time to repair for external failures
TTRinternal Time to repair for internal failures
Y Year number
λinternal Internal failure rates
Keywords: electric vehicles, distribution networks, reliability evaluation, emergency uprating, smart switching
Citation: Liu S, Cheng M, Xing Q, Jiang Y, Xiang Q and Xie H (2021) Increasing Electric Vehicle Penetration Using Smart Switching and Emergency Uprating. Front. Energy Res. 9:672721. doi: 10.3389/fenrg.2021.672721
Received: 26 February 2021; Accepted: 22 June 2021;
Published: 02 July 2021.
Edited by:
Yuvaraja Teekaraman, Vrije University Brussel, BelgiumReviewed by:
Joao Soares, Instituto Superior de Engenharia do Porto (ISEP), PortugalIndragandhi Vairavasundaram, VIT University, India
Copyright © 2021 Liu, Cheng, Xing, Jiang, Xiang and Xie. This is an open-access article distributed under the terms of the Creative Commons Attribution License (CC BY). The use, distribution or reproduction in other forums is permitted, provided the original author(s) and the copyright owner(s) are credited and that the original publication in this journal is cited, in accordance with accepted academic practice. No use, distribution or reproduction is permitted which does not comply with these terms.
*Correspondence: Shuran Liu, c2h1cmFuLmxpdUBoaXRhY2hpYWJiLXBvd2VyZ3JpZHMuY29t