 Tianlin Wang
 Di Wang
 Lili Tong1
- 1School of Mechanical Engineering, Shanghai Jiao Tong University, Shanghai, China
- 2China Nuclear Power Technology Research Institute, Shenzhen, China
Steam condensation plays a key role in prediction of the pressure behavior and hydrogen distribution in the containment during a hypothetical loss-of-coolant accident or a severe accident in a light water nuclear reactor. The objective of this study is to evaluate and improve the condensation model in GASFLOW code. Reynolds analogy coupled with wall function and Chilton-Colburn empirical analogy is used to model heat and mass transfer in GASFLOW, which has requirements for dimensional distance of the first cell near the wall and some deficiencies in description of heat and mass transfer process in the stagnant zone. Based on the evaluation of original condensation, the results shows good agreement with COPAIN experiment cases where the mass fraction of air ranges from 76.7 to 86.4%. However, with the changes in geometry of the facility and the presence of helium, the original model has a large deviation in the prediction of pressure, temperature and gas distribution compared with MISTRA ISP47 (OECD International Standard Problem No. 47) experiment data. This work proposes a modified condensation model which uses McAdams correlation and Schlichting correlation with a weight factor to calculate natural, forced, or mixed convection heat transfer coefficient, and adopts Chilton-Colburn empirical analogy to model mass transfer. The modified model has no requirement for the dimensionless distance near the wall in heat and mass transfer calculation and improves the prediction performance of heat transfer in stagnant zone. The prediction result of the modified model shows good agreements with MISTRA ISP47 problem, and the error of it compared with COPAIN experiment data is within 25% which is the same as that predicted by the original model.
Introduction
In a postulated design basis accident or a severe accident in a light water reactor, liquid water or steam at high pressure and high temperature will be released into the reactor containment building. A rapid increase in mass and energy in the containment will result in rapid heat up and pressurization of the containment, which will threaten the integrity of the containment. Whether the heat transfer occurring on the surface of the containment wall and the surface of the internal structures can effectively transfer energy to the environment will directly affect the pressure behavior in the containment. Convective heat transfer and condensation heat transfer are two mechanisms to transfer heat out of the containment, and the latter is the key mechanism for heat removal and pressurization mitigation (Yoo et al., 2018). Therefore, it is significant to carry out the evaluation of condensation model to predict pressure behavior of the containment accurately under accident conditions.
De la Rosa et al. (2009) and Yadav et al. (2016) systematically review the condensation phenomena on the containment structures and the related available models. The condensation models can be divided into three categories, boundary layers and full 3-Dimension (3D) equation models, empirical correlation models, and heat and mass transfer analogy (HMTA) models.
Boundary layer analytical solution for condensation heat transfer are basically based on the film-wize condensation of Nusselt. Nusselt obtained the analytical solution of pure vapor film condensation by solving the boundary layer equation based on the simplified hypothesis (e.g. constant physical properties, ignoring inertia force etc.), and discussed the influence of relevant physical parameters on condensation heat transfer. The inertia term, convection term (Sparrow and Gregg, 1959), shear action of gas-liquid interface (Koh et al., 1961), the influence of the presence of non-condensable gas (Sparrow et al., 1967), and the influence of the inertia of liquid film and the viscous force of gas-liquid interface (Churchill, 1986) on condensation are considered in the subsequent researches. With the development of computation power, the full 3D transport equations can be solved. Using fine meshes, Vyskocil et al. (2014) and Dehbi (2013) respectively resolved the boundary layer to investigate the wall condensation with non-condensable gas presented.
Empirical correlations have been established that correlate the heat transfer rate by gas concentration, pressure, surface subcooling, or some other parameters. Uchida and Tagami respectively established the correlations that included mass fraction of steam and non-condensable gas (De la Rosa et al., 2009; Yadav et al., 2016). Dehbi (1991) investigated the condensation phenomenon on the surface of a circular tube under turbulent natural convection conditions, developed the correlations considering the pressure, wall subcooling, and length of the condenser. Liu et al. (2000), Kawakubo et al. (2009) and, Kuhn et al. (1997) also established global heat transfer correlations (HTC) used in reactor containment applications. Sharma et al. (2012) suggested a generalized HTC based on curve fitting of the reported semi-empirical models, and validated it by COPAIN experimental data. These correlations lay foundations for evaluation of steam condensation in containment thermal hydraulic analysis, however, the use of these correlations may be limited by specific conditions (pressure, non-condensable gas, geometrical scale etc.), and it may predict erroneous results outside these conditions (Yadav et al., 2016).
Heat and mass transfer analogy (HMTA) has been successfully applied in different fields, such as Reynolds analogy, Chilton-Colburn analogy which are used in some CFD codes (Kim and Corradini, 1990; Li et al., 2018; Wang et al., 2019). Bird et al. (2002) and Lienhard (1987) systematically demonstrated the physical and mathematical bases and application process of HMTA. Ambrosini et al. (2006) subdivided HMTA models into two broad categories of “mass” approach and “molar” approach and assessed the related quantitative differences in different forms of HMTA based on COPAIN experimental data. The prediction results of different formulations of HMTA show limited discrepancies.
Both the lumped parameter code and the 3D CFD code can be used for containment thermal-hydraulic analysis. Compared with lumped parameter codes, 3D CFD codes can obtain more detailed flow field and gas concentration distribution information, which provides a best-estimated result for formulation and optimization of accident mitigation measures. Resolved boundary method or HMTA method with wall function is usually used to model steam condensation. Fine near-wall mesh resolution (dimensional length y+<1) is required for the former method, which requires a lot of computing resources; HMTA method with wall function can reduce requirements for mesh resolution to a certain degree (Ambrosini et al., 2014; Lee et al., 2015). The GASFLOW code uses HMTA method with wall function to model steam condensation in containment (Wang et al., 2018). There are some deficiencies in using this method when the flow field close to the wall is nearly stagnant, the condensation rate then somewhat depends on the cell size next to the condenser (Royl et al., 2014). For nuclear power plant containment analysis, as a result of the limitation of computational resources, the near wall cell size is still relatively coarse. Due to the lack of resolution of near-wall meshing, the distortion of near wall flow field calculation may lead to the failure of condensation heat transfer for some special zones. As Dehbi (2013) pointed out, the wall function leads to substantial deviations in the developing region. Therefore, it is meaningful to carry out evaluation and development of the condensation model in GASFLOW.
The objective of this study is to evaluate and improve the condensation model of GASFLOW under complex environments. The original HMTA model of GASFLOW was evaluated by COPAIN test and MISTRA ISP47(OECD International Standard Problem No. 47) problems. Then a modified condensation model was established. The modified model decouples GASFLOW wall function for the heat transfer coefficients, uses semi-empirical correlations which cover natural convection, forced convection, and mixed convection simultaneously. The original model is described in Condensation Model, and the evaluation of original model is introduced in Assessment of Original Model. Then the modified model is described and validated in Modified Condensation Model and Reassessment.
Condensation Model
Fundamentals of the Model
The bulk gas in containment transfers heat to the surface of liquid film by convection and condensation, and then transfer heat to the wall by conduction. Assuming that the heat transfer process is steady state (the heat flux from the wall to the interface is equal to that from the interface to the bulk.), the schematic diagram of the thermal resistance structure of the wall condensation heat transfer process is shown in Figure 1.
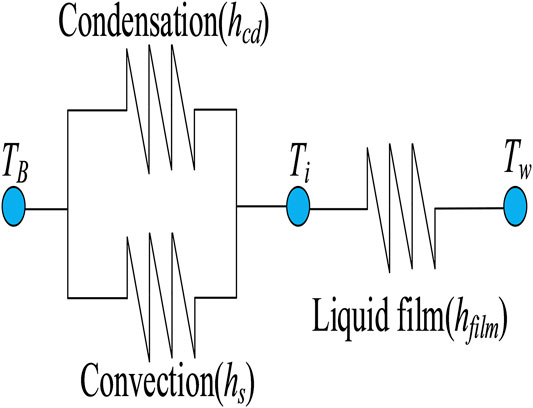
FIGURE 1. Scheme of the thermal resistances through the wall.
The heat transfer flux between the bulk gas and the liquid film is divided into two parts, convection and condensation.
Where
The heat transfer flux in liquid film can be expressed as Eq. (3), and the total heat transfer flux from the bulk mixture to the wall can be expressed as Eq. (4).
Where
The heat transfer model is derived from the heat balance at the liquid/gas interface. In steady state, the heat transfer flux from the liquid film to the wall is equal to that through the gas mixture to the liquid film.
The total heat transfer flux can be obtained by eliminating the interface temperature,
As the non-condensable gas fraction is large enough, the thermal resistance of liquid film can be neglected (Corradini, 1984; Yoon et al., 2017). Therefore, the total heat transfer coefficient can be simplified as Eq. (7)
Original Model in GASFLOW
HMTA is adopted to calculate convection and condensation heat transfer by GASFLOW code (Xiao et al., 2014). Reynolds analogy with Colburn correction is adopted for convection heat transfer, and Chilton-Colburn empirical analogy is used for condensation heat transfer. The convection heat transfer coefficient is expressed as Eq. (8).
Where
According to the boundary layer theory, the dimensionless velocity of boundary layer can be described as Eq. (9).
Where y+ is dimensionless length,
To avoid iterative calculation, the one-seventh-power law is applied for calculation of y+ (Li et al., 2018).
where
Then the convection heat transfer coefficient can be obtained using Eq. (8).
The condensation is modeled with Chilton-Colburn empirical analogy. The mass transfer coefficient is linked to the convection heat transfer coefficient as follow
where Sc is Schmidt number, Pr is Prandtl number. For relatively large steam mass fractions, the mass-transfer coefficient is corrected as (Bird et al., 2002)
where
where
The condensation mass transfer rate on structure surface is calculated as
where
Assessment of Original Model
COPAIN Test
COPAIN is separate effect experiment facility which aims at investigating the phenomenon of wall condensation in the presence of non-condensable gases (Bucci, 2009). The main test section consists of a rectangular channel which is placed vertically with a width, depth, and height dimension of 0.6, 0.5, and 4.0 m (Lee et al., 2019), as shown in Figure 2A. The rectangular channel is located inside a cylindrical vessel, by which is insulated from the external environment. The condensation plate is 2.0 m long and 0.6 m wide which is cooled by the secondary loop to achieve uniform temperature distribution on the plate surface.
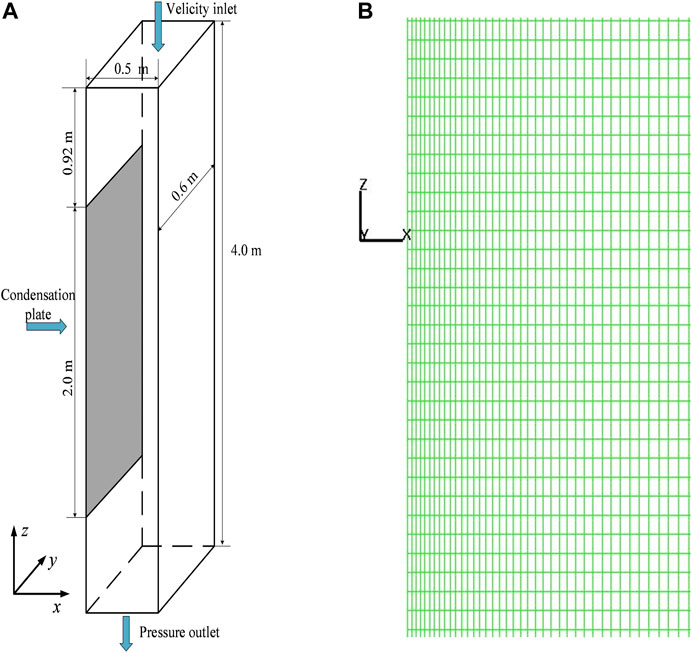
FIGURE 2. Diagram of COPAIN test section and mesh. (A) Diagram of COPAIN test section. (B) Mesh division for x-z plane.
Due to the symmetric geometry of the facility in y-direction, a 2-D geometry model is established in this study. The computational domain is divided into 200 uniform cells along z-direction whose size is 2 cm and 50 cells along x-direction, the meshes are refined near the condensation wall along x-direction with the size of 0.5 cm, as shown in Figure 2B.
Li et al. (2018) and Zhang et al. (2018) validated the original HMTA model of GASFLOW to simulate natural convection and forced convection at atmospheric pressure based on COPAIN experiment data. In the later part, additional experiment cases with similar pressure and air mass fraction were added to validate the original model for heat and mass transfer under different flow regimes (including mixed convection). The analyzed initial conditions are shown in Table 1, which includes natural convection, forced convection, and mixed convection. The comparison between model prediction results and experimental data is shown in Figure 3. The original model predicts all of the data within 25% error. For the case of a relatively simple flow channel geometry, the flow field near the wall can be described by the classical boundary layer theory as Eq. (9). The original model which calculates the convective heat transfer coefficient based on the wall function shows good performances for prediction of heat and mass transfer in different flow regimes.
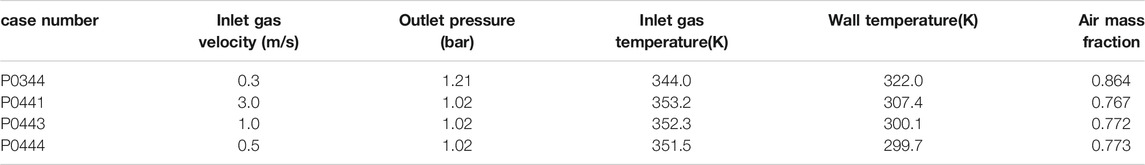
TABLE 1. COPAIN experimental conditions.
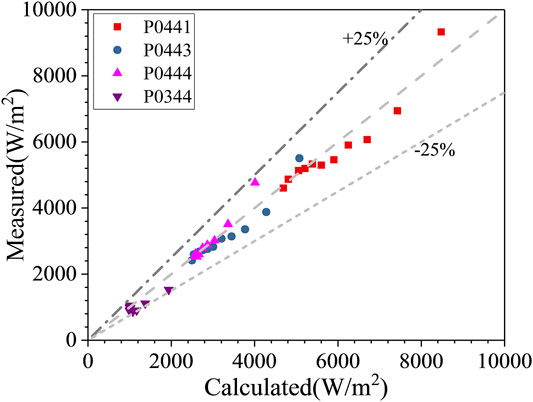
FIGURE 3. Prediction results of original model compared with COPAIN experimental data.
MISTRA ISP 47 Problem
MISTRA ISP47 problem is selected to evaluate the condensation model of GASFLOW. The MISTRA facility is a closed cylindrical vessel (99.5 m3, inner diameter 4.25 m) into which steam or non-condensable gases are injected through a vertical pipe located on the vessel axis. Inside the vessel, three temperature control condensers are concentric to the vessel walls and arranged along the axial direction at a distance of 1.897 m from the center axis. There is a narrow gap between the condensers and the walls where the spurious condensation may occur. Though the condensers are formed of vertical tubes, they are modeled as plates in this study for simplicity with the surface area of 26.2 m2 for the lower condenser, 21.4 m2 for the middle and the upper condensers. Through the temperature control system, the surface of the condensers can achieve good constant temperature boundary conditions ( ± 1°C). The instrumentation location (thermocouples and gas sampling tubes) of the main vertical half planes is shown in Figure 4, other experimental device details can be found in literature (Studer et al., 2007; Kudriakov et al., 2008).
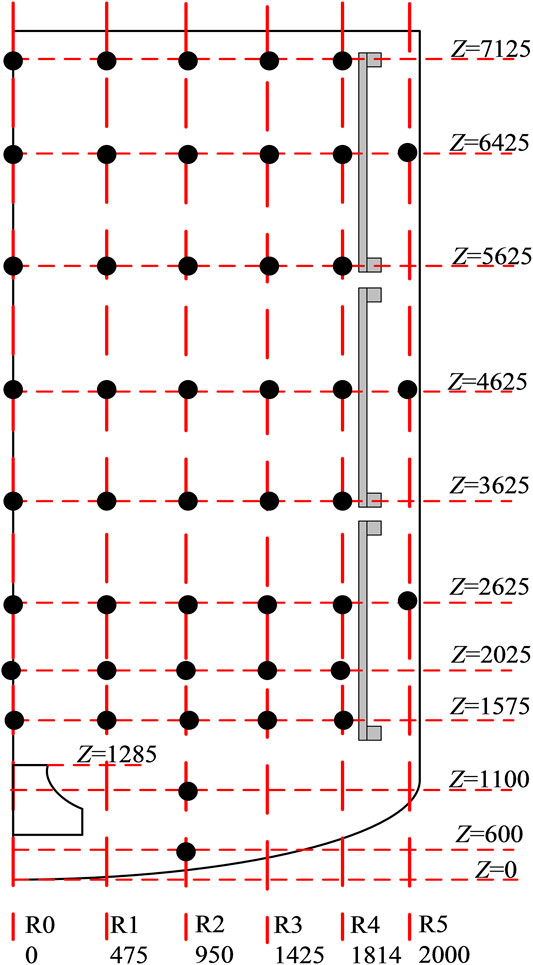
FIGURE 4. Schematic view of the MISTRA facility and distribution of main instrumentation (Studer et al., 2007).
The MISTRA ISP47 test is composed of five consecutive stages. The first stage is to heat the vessel which is not simulated. The initial and boundary conditions of the other four stages are shown in Table 2 and Table 3. The initial phase is assumed to reach a state with uniform initial conditions 0.45 MPa, 407.2 K and volume fraction 0.3 for air and 0.7 for steam.
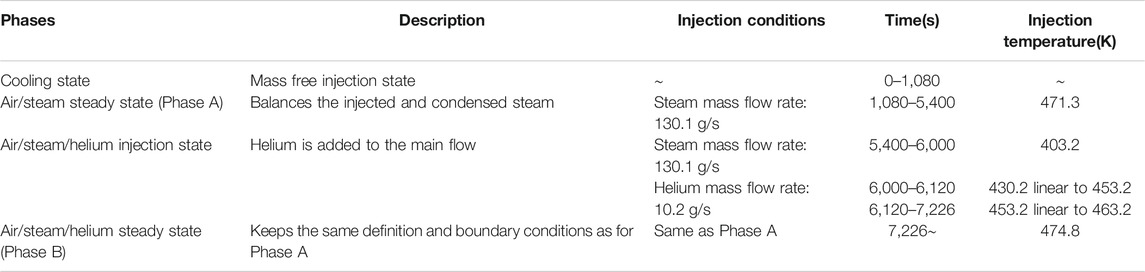
TABLE 2. Injection characteristics of MISTRA ISP47 experiment.
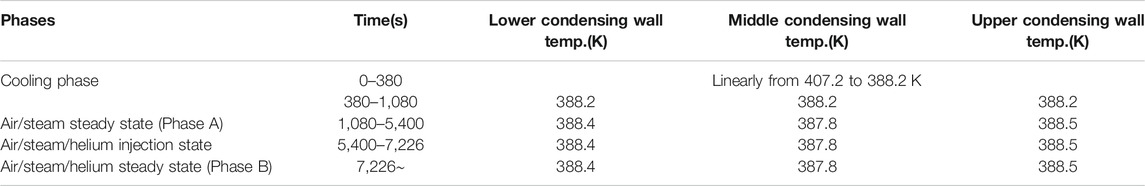
TABLE 3. Wall temperature characteristics of MISTRA ISP47 experiment.
Due to the symmetry of the facility, a 2-D simulation model (one mesh in the circumferential direction) is established in a cylindrical coordinate system. The schematic structure and mesh division are shown in Figure 5, with 42 cells in the radial direction, 125 cells in the axial direction, and 1 grid in azimuthal direction (36°). Except for the three surfaces of internal side of the condensers, the other surfaces of the vessel are all set to be adiabatic. The spurious condensation including the condensation happened on the vessel wall, surface of sump, and external side of condensers is not modeled directly, the rate of spurious condensation (12% of the injected mass flow rate) is removed from the injected mass flow directly. Standard k-ε model with wall function is selected in this study.

FIGURE 5. Diagram of MISTRA test section and mesh. (A) Geometry. (B) Mesh.
As shown in Table 4, the original model underestimates the condensation rate at phase A steady state, and it overestimates the condensation rate at phase B steady state. The steam volume fraction is higher than 50% at phase A state (air as non-condensable gas) and it is higher than 35% at phase B state (helium and air as non-condensable gas), which is higher than that of COPAIN test cases. The comparison between the simulation results of the original model and experimental data of the gas temperature along R2 axis in phase A is shown in Figure 6A. The simulation results at the top of the vessel are in good agreement with the experiment. As the height decreases, the deviation gradually increases, and the simulation results are about 8 K higher than the experimental data in the lowest position, which reflects the underestimation of the condensation rate in phase A by the original model. With the injection of helium during 5400∼7226 s, the original model underestimated the inhibition of the increase of non-condensable gas on heat and mass transfer, therefore it overestimates the condensation rate, which makes the prediction result of the pressure in phase B is about 3.5% lower than the experiment data. The temperature along R0 axis in the vessel is lower than the experiment data, and the prediction results of the helium concentration along R4 axis are significantly higher than the experiment data, as shown in Figure 6B and Figure 6C. It can be concluded from the comparisons that the original condensation model should be improve to obtain more accurate prediction results of pressure and gas distribution.
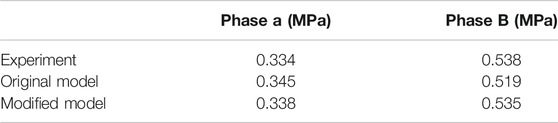
TABLE 4. Simulation and experimental pressure comparison of MISTRA ISP47 experiment.
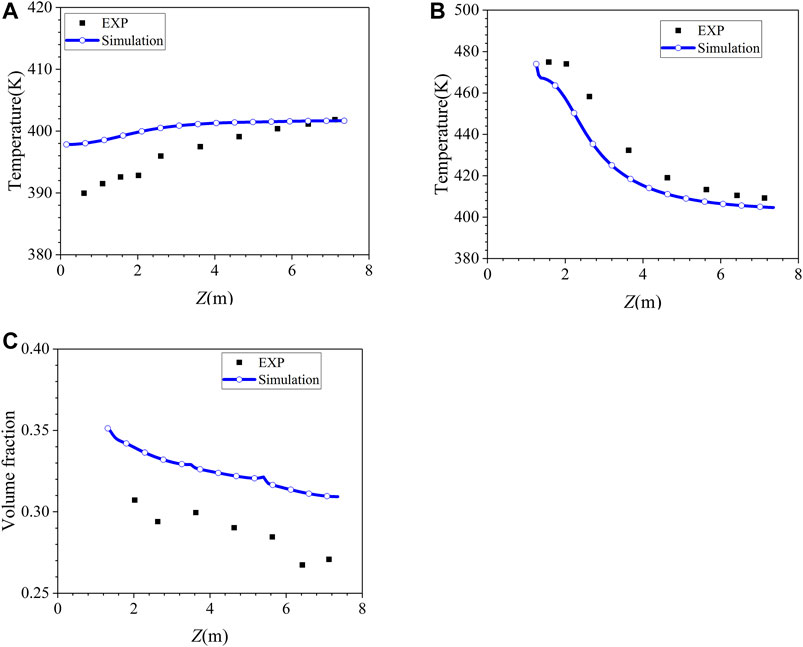
FIGURE 6. Assessment results of original model. (A) Temperature vertical profiles along R2 axis (Phase A, t = 4000 s). (B) Temperature vertical profiles along R0 axis (Phase B, t=9000 s). (C) Helium volume fraction along R4 axis (Phase B, t = 9000 s).
Modified Condensation Model and Reassessment
Modified Analogy Model
As discussed in MISTRA ISP 47 Problem, the original model underestimates the condensation heat transfer under complex flow field at phase A steady state. and it underestimates the inhibition of steam condensation by helium for the mixed injection of helium and steam, thus it overestimates condensation heat transfer rate at phase B steady state. For the original model in GASFLOW, the following points are summarized:
1) The calculation of convective heat transfer coefficient is significant for the calculation of condensation rate as shown in Eq. 12. The dimensionless distance y+ of the first cell near wall has a great influence on calculation of convection heat transfer coefficient as shown in Eqs. (8), (9). There is an optimal value range for y+. Due to the complexity of the geometric structure of the containment, it is difficult to ensure that y + falls within the required value range. Using wall functions to describe momentum, heat, and mass transfer requires further work when approaching stagnant conditions (Royl et al., 2009).
2) The flow regimes inside the containment during accidents are complicated, however, the wall function currently does not make any difference between forced convection and natural convection in GASFLOW. When the steam volume fraction is high and with or without the presence of helium, the prediction results of the original model for wall condensation process are overestimated or underestimated under complex flow field, which further affects the prediction accuracy of temperature and gas distribution in the space.
To avoid the deficiency of using wall function, semi-empirical correlations are added in GASFLOW to calculate convective heat transfer coefficient. The McAdams correlation is used to calculate Nusselt number for natural convection.
Where
Where g is the acceleration of gravity, ρ∞ is the mixture density of the bulk, ρi is the mixture density of the film surface, L is the characteristic length scale,
in which
where
Schlichting correlation is used to calculate Nusselt number for forced convection.
Where
The Richardson number,
When
Where a = 10, b = 1.
Therefore, the Nusselt number finally described as
The plus and minus signs pertain respectively to buoyancy assisting and buoyancy opposing flow cases. The modified model is based on Eq. (24) to calculate convective heat transfer and then uses Chilton-Colburn empirical analogy to calculate condensation heat transfer. In this model, the link between wall function and heat transfer is decoupled, therefore, there is no requirement for the value range of dimensionless distance y+ in heat and mass transfer calculation.
Reassessment of MISTRA ISP47 Problem
The MISTRA ISP47 problem is simulated based on the modified condensation model. The pressure simulation results comparison between the two steady-state stages is shown in Table 4. It can be concluded from the table that the modified model prediction results are in better agreement with the experimental data especially at phase B state. The density of the interface mixture,
Phase A
The condensation rate fraction of the three condensers at phase A state (t = 4000s) is shown in Table 5. The experimental results show that the condensation rate of the three condensation surfaces increases sequentially from bottom to top, which is due to the accumulation of the injected hot steam on the top of the vessel. After being injected from the center of the lower part of the vessel, the steam first migrates to the top of the vessel driven by jet and buoyancy, and then migrates horizontally after being blocked by the top wall, and then flows down along the condenser, that is, high-temperature steam first transfers heat to the upper condenser. When the airflow migrates to the middle and lower parts of the vessel, the temperature and steam concentration gradually decrease, therefore, condensation rate also gradually decreases. It may be that the flow field near the surface of the lower and the upper condensers deviate from the flat plate boundary layer as described by Eq. (9), as a result, the prediction results of the lower and upper condensers of the original model deviate greatly from the experiment data. The modified model uses semi-empirical correlations instead of using wall function to calculate the convection heat transfer coefficient, it avoids the dependence of the condensation heat transfer calculation on Eq. (9), which effectively improves the prediction results of the condensation rate of the lower and upper condensers, and the predictions of the condensation rate of middle condenser by the two models (original model and modified model) are in good agreement with the experiment data.
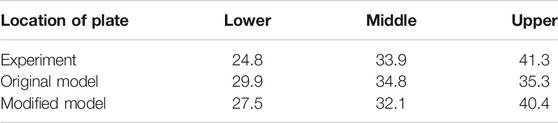
TABLE 5. Condensation rate fraction on the three condensers in Phase A of MISTRA ISP47 experiment (t = 4000 s).
The gas temperature distribution along R2 axis of the vessel at phase A state is shown in Figure 7. The experimental results show that a temperature difference of about 12 K is established in the vessel along the axial direction at phase A state. As the height increases, the gas temperature gradually increases. The modified model effectively improves the prediction effect of the original model which overestimates the temperature at the height of the middle and lower parts of the vessel with the same reason as condensation rate fraction. The difference between the gas temperature near the condenser and the corresponding steam saturation temperature under the steam partial pressure along R4 axis is shown as Figure 8. The steam superheat increases with the height. The modified model predicts better than the original model, the difference between the prediction results of modified model and the experimental data is within ± 2 K along the entire height.
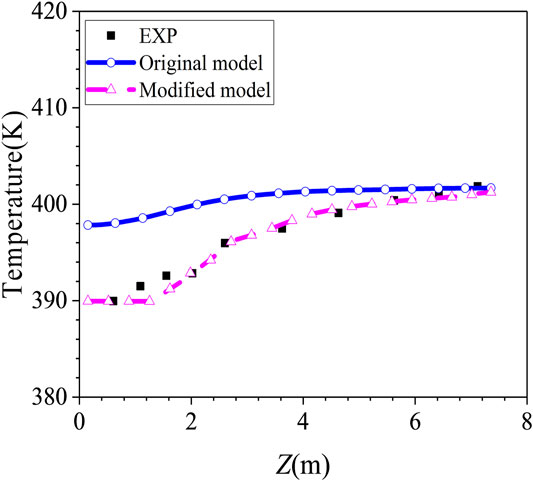
FIGURE 7. Temperature vertical profiles along R2 axis (Phase A, t = 4000 s).
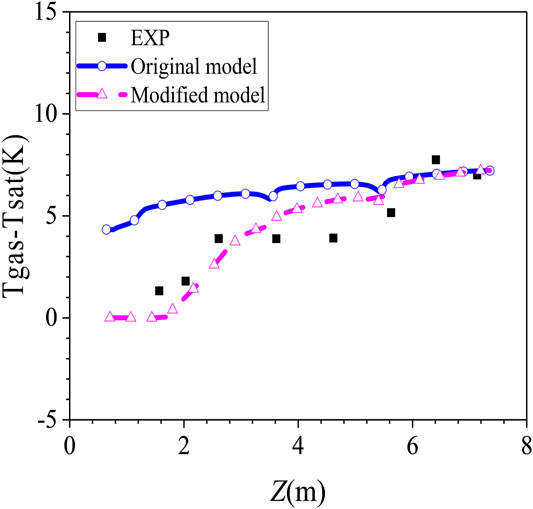
FIGURE 8. Saturation profiles along R4 axis (Phase A, t = 4000 s).
Phase B
The condensation rate fraction of the three condensers at phase B state is shown in Table 6. Similar to phase A, because the steam temperature is higher around the top condenser and the boundary layer is thinner, it will produce a stronger heat exchange effect, the steam condensation mainly occurs in the upper condenser. The simulation results of the condensation rate here have been improved by the modified model compared with original model at this state, which is also reflected in the steady-state gas temperature spatial distribution in the vessel, as shown in Figure 9 and Figure 10, the prediction result of the modified model is more close to the experiment data.
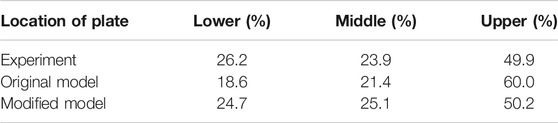
TABLE 6. Condensation rate fraction on the three condensers in Phase B of MISTRA ISP47 experiment (t = 9000 s).
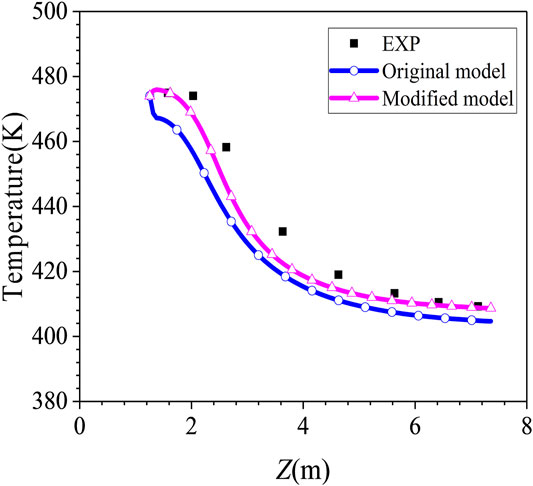
FIGURE 9. Temperature vertical profiles along R0 axis (Phase B, t = 9000 s).
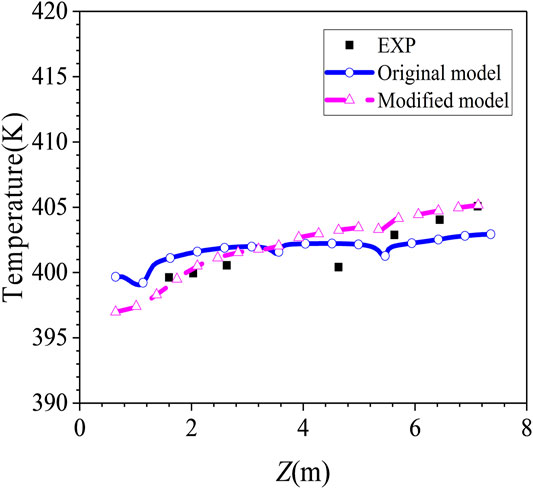
FIGURE 10. Temperature vertical profiles along R4 axis (Phase B, t = 9000 s).
Helium has a higher concentration in the lower part of the vessel than at the top part. The prediction result of the modified model for the whole height is closer to the experimental data as shown in Figure 11. The original Reynolds analogy heat transfer model is based on the flat plate boundary layer theory, and uses the gas flow velocity near the wall in the stagnation zone to carry out the analogy. As shown in Figure 12A, the airflow is blocked by the top wall and flows horizontally, forming an impact on the surface of the condenser, the flow near the wall of the top condenser is complicated which cannot be described as Eq. (9). Therefore, the local heat transfer is overestimated around upper condenser. The modified model based on semi-empirical correlations can improve this deficiency, therefore, the condensation rate fraction of upper condenser in Table 6 improved by 19%. Due to the natural convection caused by wall condensation, more light non-condensable gas (helium) migrates to the lower part of the vessel, as a result, the helium concentration is the highest around the axial position of the lower condenser as shown in Figure 12B.
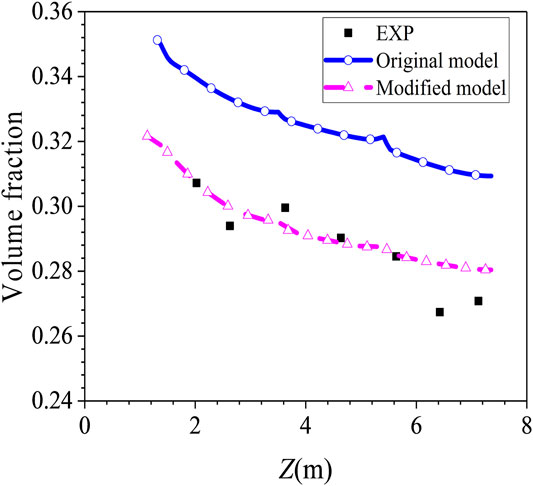
FIGURE 11. Helium volume fraction along R4 axis (Phase B, t = 9000 s).
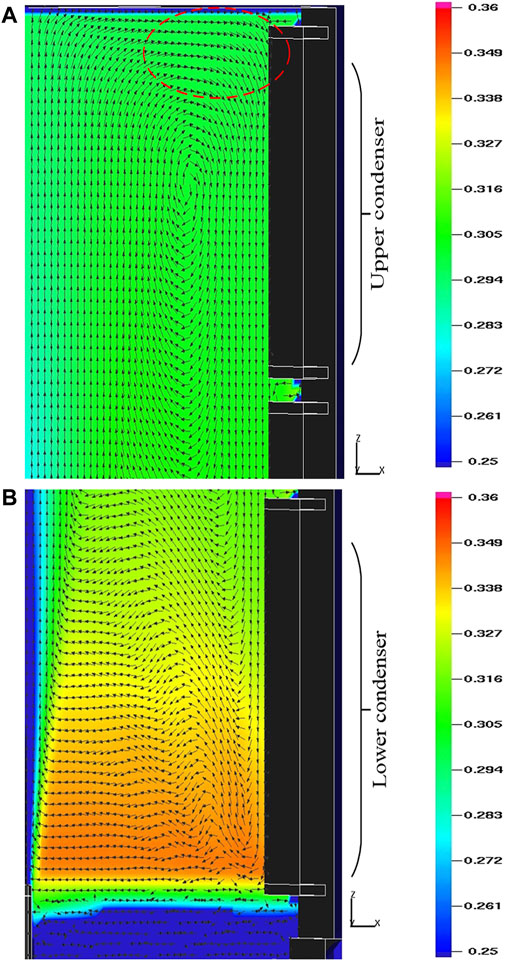
FIGURE 12. Flow field distribution and helium volume fraciton distribution (Phase B, t = 9000 s). (A) Upper condenser. (B) Lower condenser.
Reassessment of COPAIN Test
The modified HMTA model uses Eq. (24) to calculate the convective heat transfer coefficient instead of using the wall function, and then use Chilton-Colburn analogy to calculate the mass transfer process. Eq. (24) can handle different flow regimes. In order to show its effect more intuitively, calculations have been carried out with forced convection case P0441 and mixed convection case P0443. The natural convection heat transfer correlation (Eq. (17)) and the forced convection heat transfer correlation (Eq. (21)) is calculated for both cases, and the comparison result is shown in Figure 13. It can be concluded that in the two cases, only using one equation of Eq. (17) or Eq. (21) may overestimate or underestimate the heat flux while the mixed convection Eq. (24) can effectively improve the prediction results.
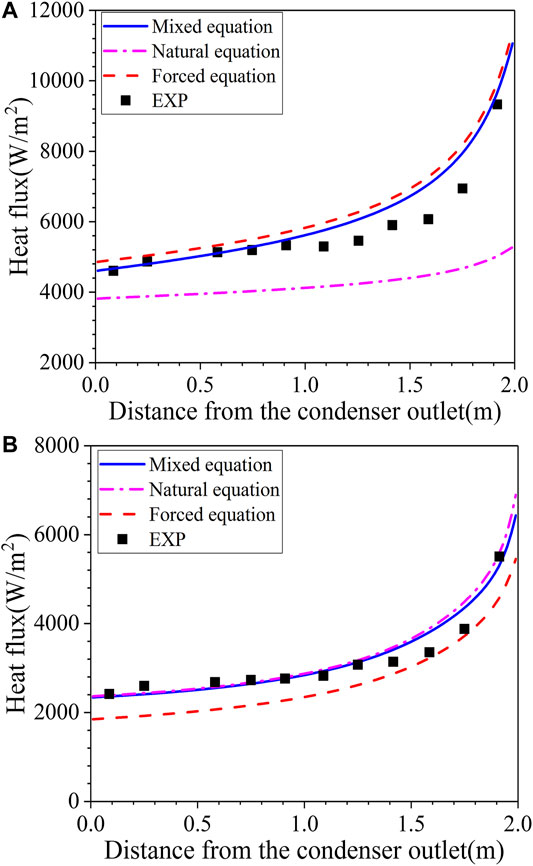
FIGURE 13. Comparisons with different heat transfer patterns. (A) case P0441. (B) case P0443.
In order to reflect that the modified model has good universality for the simulation of steam condensation, the COPAIN experiment is chosen to assess the modified model again. The result is given in Figure 14, the modified model also predicts all of the data within 25% error like the original model does. According to the comparison results, the modified condensation model can also provide reasonable prediction results.
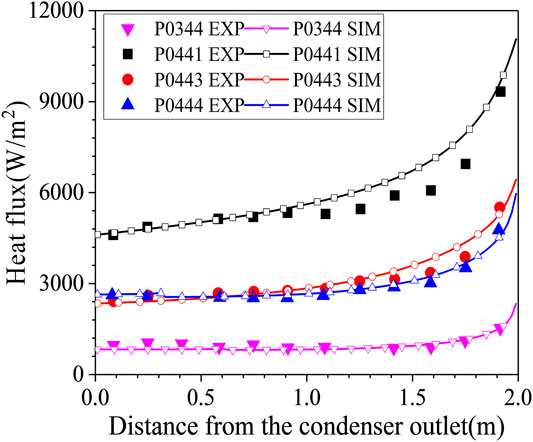
FIGURE 14. Modified HMTA model compared with COPAIN experimental data.
Conclusion
In this study, HMTA model of GASFLOW code is evaluated, the prediction results of the original model have obvious defects under complex environments when the steam volume fraction is higher than 35%. A modified model is established which uses semi-empirical correlations to calculate convective heat transfer coefficient instead of using wall function. The modified model is validated by MISTRA ISP47 problem and COPAIN test, and the main conclusions obtained are as follows:
(1) The modified HMTA model is decoupled from wall function, therefore, it is has no requirement for the dimensionless distance near the wall in heat and mass transfer calculation. The prediction results of condensation rate, temperature, pressure, and the light gas concentration of the modified model are in good agreement with MISTRA ISP 47 experiment data.
(2) Based on the semi-empirical correlations, a modified condensation model suitable for forced convection, natural convection, and mixed convection is established, and the modified model is validated by separate effect experiment COPAIN.
(3) The convection caused by wall cooling drives the light gas to migrate to lower part, and then the light gas accumulate a higher concentration. Under severe accident conditions of nuclear power plants, it is necessary to monitor the change of hydrogen concentration in the lower part of the containment, and take mitigation measures to prevent local hydrogen risk.
Data Availability Statement
The original contributions presented in the study are included in the article/Supplementary Material, further inquiries can be directed to the corresponding author.
Author Contributions
TW: Methodology, Software, Writing ‐ original draft, Writing ‐ review. DW: Investigation, Analysis. LT: Modeling, Writing ‐ original draft, Writing ‐ review and editing. XC: Conceptualization, Methodology, Supervision.
Funding
This work is financially supported by the National Key R&D Program of China (Grant No. 2019YFE03110002).
Conflict of Interest
Author DW works at one of the research departments in China Guangdong Nuclear Research Institute Co., Ltd. The research method applied in this paper has nothing to do with his company’s business field. Also, this work does not receive any financial support from his company or anyone else.
The remaining authors declare that the research was conducted in the absence of any commercial or financial relationships that could be construed as a potential conflict of interest.
References
Ambrosini, W., Forgione, N., Manfredini, A., and Oriolo, F. (2006). On Various Forms of the Heat and Mass Transfer Analogy: Discussion and Application to Condensation Experiments. Nucl. Eng. Des. 236 (9), 1013–1027. doi:10.1016/j.nucengdes.2005.10.009
Ambrosini, W., Forgione, N., Merli, F., Oriolo, F., Paci, S., Kljenak, I., et al. (2014). Lesson Learned from the SARNET Wall Condensation Benchmarks. Ann. Nucl. Energ. 74, 153–164. doi:10.1016/j.anucene.2014.07.014
Bird, R., Stewart, W. E., and Lightfoot, E. N. (2002). Transport Phenomena. New York, USA: Wiley and Sons, Inc.
Bucci, M. (2009). Experimental and Computational Analysis of Condensation Phenomena for the Thermal-Hydraulic Analysis of LWRs Containments. Doctoral dissertation, Ph. D. thesis, University of Pisa.
Churchill, S. W. (1986). Laminar Film Condensation. Int. J. Heat Mass Transfer 29 (8), 1219–1226. doi:10.1016/0017-9310(86)90154-7
Corradini, M. L. (1984). Turbulent Condensation on a Cold Wall in the Presence of a Noncondensable Gas. Nucl. Tech. 64 (2), 186–195. doi:10.13182/NT84-A33341
De la Rosa, J. C., Escrivá, A., Herranz, L. E., Cicero, T., and Muñoz-Cobo, J. L. (2009). Review on Condensation on the Containment Structures. Prog. Nucl. Energ. 51 (1), 32–66. doi:10.1016/j.pnucene.2008.01.003
Dehbi, A. A. (1991). The Effects of Noncondensable Gases on Steam Condensation under Turbulent Natural Convection Conditions. Doctoral dissertation, Massachusetts Institute of Technology.
Dehbi, A. (2013). On the Adequacy of Wall Functions to Predict Condensation Rates from Steam-Noncondensable Gas Mixtures. Nucl. Eng. Des. 265, 25–34. doi:10.1016/j.nucengdes.2013.07.014
Kawakubo, M., Aritomi, M., Kikura, H., and Komeno, T. (2009). An Experimental Study on the Cooling Characteristics of Passive Containment Cooling Systems. J. Nucl. Sci. Tech. 46 (4), 339–345. doi:10.1080/18811248.2007.9711539
Kim, M. H., and Corradini, M. L. (1990). Modeling of Condensation Heat Transfer in a Reactor Containment. Nucl. Eng. Des. 118 (2), 193–212. doi:10.1016/0029-5493(90)90057-5
Koh, J. C. Y., Sparrow, E. M., and Hartnett, J. P. (1961). The Two Phase Boundary Layer in Laminar Film Condensation. Int. J. Heat Mass. Transfer 2 (1-2), 69–82. doi:10.1016/0017-9310(61)90015-1
Kudriakov, S., Dabbene, F., Studer, E., Beccantini, A., Magnaud, J. P., Paillère, H., et al. (2008). The TONUS CFD Code for Hydrogen Risk Analysis: Physical Models, Numerical Schemes and Validation Matrix. Nucl. Eng. Des. 238 (3), 551–565. doi:10.1016/j.nucengdes.2007.02.048
Kuhn, S. Z., Schrock, V. E., and Peterson, P. F. (1997). An Investigation of Condensation from Steam–Gas Mixtures Flowing Downward inside a Vertical Tube. Nucl. Eng. Des. 177 (1-3), 53–69. doi:10.1016/S0029-5493(97)00185-4
Lee, J., Choi, C., Cho, H. K., Lee, K. W., and Cho, M. K. (2019). Assessment of the Wall Film Condensation Model with Non-condensable Gas in RELAP5 and TRACE for Vertical Tube and Plate Geometries (NUREG/IA-0491). U.S. Nuclear Regulatory Commission.
Lee, J., Park, G.-C., and Cho, H. K. (2015). Improvement of CUPID Code for Simulating Filmwise Steam Condensation in the Presence of Noncondensable Gases. Nucl. Eng. Tech. 47 (5), 567–578. doi:10.1016/j.net.2015.03.007
Li, W., Zhang, C., Chen, T., Min, J., Sénéchal, D., and Mimouni, S. (2019). A Unified Wall Function for Wall Condensation Modelling in Containment Multi-Component Flows. Nucl. Eng. Des. 348, 24–36. doi:10.1016/j.nucengdes.2019.04.012
Li, Y., Zhang, H., Xiao, J., Travis, J. R., and Jordan, T. (2018). Numerical Investigation of Natural Convection inside the Containment with Recovering Passive Containment Cooling System Using GASFLOW-MPI. Ann. Nucl. Energ. 114, 1–10. doi:10.1016/j.anucene.2017.11.047
Liu, H., Todreas, N. E., and Driscoll, M. J. (2000). An Experimental Investigation of a Passive Cooling Unit for Nuclear Plant Containment. Nucl. Eng. Des. 199 (3), 243–255. doi:10.1016/S0029-5493(00)00229-6
Royl, P., Travis, J. R., Breitung, W., Kim, J., and Kim, S. B. (2009). GASFLOW Validation with PANDA Tests from the OECD SETH Benchmark Covering Steam/air and Steam/helium/air Mixtures. Sci. Tech. Nucl. Installations 2009, 1–13. doi:10.1155/2009/759878
Royl, P., Travis, J. R., and Kim, J. (2014). GASFLOW-III: A Computational Fluid Dynamics Code for Gases, Aerosols and Combustion, Volume 3: Assessment Manual. Revision: Karlsruhe Institute of Technology Report, 1.
Sharma, P. K., Gera, B., Singh, R. K., and Vaze, K. K. (2012). Computational Fluid Dynamics Modeling of Steam Condensation on Nuclear Containment Wall Surfaces Based on Semiempirical Generalized Correlations. Sci. Tech. Nucl. Installations 2012, 1–7. doi:10.1155/2012/106759
Sparrow, E. M., and Gregg, J. L. (1959). A Boundary-Layer Treatment of Laminar-Film Condensation. J. Heat Transfer 81 (1), 13–18. doi:10.1115/1.4008118
Sparrow, E. M., Minkowycz, W. J., and Saddy, M. (1967). Forced Convection Condensation in the Presence of Noncondensables and Interfacial Resistance. Int. J. Heat Mass Transfer 10 (12), 1829–1845. doi:10.1016/0017-9310(67)90053-1
Studer, E., Magnaud, J. P., Dabbene, F., and Tkatschenko, I. (2007). International Standard Problem on Containment Thermal-Hydraulics ISP47. Nucl. Eng. Des. 237 (5), 536–551. doi:10.1016/j.nucengdes.2006.08.008
Vyskocil, L., Schmid, J., and Macek, J. (2014). CFD Simulation of Air-Steam Flow with Condensation. Nucl. Eng. Des. 279, 147–157. doi:10.1016/j.nucengdes.2014.02.014
Wang, D., Tong, L., and Cao, X. (2018). Numerical Study on the Influence of Steam Condensation on Hydrogen Distribution in Local Compartments. Ann. Nucl. Energ. 121, 468–478. doi:10.1016/j.anucene.2018.07.044
Wang, D., Tong, L., Liu, L., Cao, X., Zou, Z., Wu, L., et al. (2019). Preliminary Numerical Study on Hydrogen Distribution Characteristics in the Process that Flow Regime Transits from Jet to Buoyancy Plume in Time and Space. Nucl. Eng. Tech. 51 (6), 1514–1524. doi:10.1016/j.net.2019.05.002
Xiao, J., Jordan, T., Royl, P., Necker, G. A., Redlinger, R., Svishchev, A., et al. (2014). GASFLOW-III: A Computational Fluid Dynamics Code for Gases, Aerosols and Combustion, Volume 1: Theory and Computational Model. KIT Scientific Publishing.
Yadav, M. K., Khandekar, S., and Sharma, P. K. (2016). An Integrated Approach to Steam Condensation Studies inside Reactor Containments: A Review. Nucl. Eng. Des. 300, 181–209. doi:10.1016/j.nucengdes.2016.01.004
Yoo, J. M., Kang, J. H., Yun, B. J., Hong, S. W., and Jeong, J. J. (2018). Improvement of the MELCOR Condensation Heat Transfer Model for the Thermal-Hydraulic Analysis of a PWR Containment. Prog. Nucl. Energ. 104, 172–182. doi:10.1016/j.pnucene.2017.09.012
Yoon, D. S., Jo, H., and Corradini, M. L. (2017). Assessment of MELCOR Condensation Models with the Presence of Noncondensable Gas in Natural Convection Flow Regime. Nucl. Eng. Des. 317, 110–117. doi:10.1016/j.nucengdes.2017.03.018
Keywords: condensation model, GASFLOW, mixed flow, non-condensable gas, wall condensation
Citation: Wang T, Wang D, Tong L and Cao X (2021) Improvement of Condensation Model With the Presence of Non-Condensable Gas for Thermal-Hydraulic Analysis in Containment. Front. Energy Res. 9:671539. doi: 10.3389/fenrg.2021.671539
Received: 24 February 2021; Accepted: 04 May 2021;
Published: 14 May 2021.
Edited by:
Muhammad Zubair, University of Sharjah, United Arab EmiratesReviewed by:
Ivo Kljenak, Institut Jožef Stefan (IJS), SloveniaZhiwei Zhou, Tsinghua University, China
Copyright © 2021 Wang, Wang, Tong and Cao. This is an open-access article distributed under the terms of the Creative Commons Attribution License (CC BY). The use, distribution or reproduction in other forums is permitted, provided the original author(s) and the copyright owner(s) are credited and that the original publication in this journal is cited, in accordance with accepted academic practice. No use, distribution or reproduction is permitted which does not comply with these terms.
*Correspondence: Xuewu Cao, Y2FveHVld3VAc2p0dS5lZHUuY24=