 Aiswarya Krishnakumar Padinjarethil
 Fiammetta Rita Bianchi
 Barbara Bosio
 Anke Hagen1
94% of researchers rate our articles as excellent or good
Learn more about the work of our research integrity team to safeguard the quality of each article we publish.
Find out more
ORIGINAL RESEARCH article
Front. Energy Res. , 27 September 2021
Sec. Fuel Cells, Electrolyzers and Membrane Reactors
Volume 9 - 2021 | https://doi.org/10.3389/fenrg.2021.668964
Solid Oxide Fuel Cells (SOFCs) have emerged as an attractive alternative for efficient cogeneration of electricity and heat with reduced emissions during operation. High working temperatures result in optimized kinetics and higher efficiencies in comparison to other fuel cell types. Among different designs, Anode Supported Cells (ASCs) and Electrolyte Supported Cells are currently the most promising configurations on a commercial scale. This work analyses these two designs with a focus on electrochemical features as the main performance marker. The study was carried out using both theoretical and experimental approaches on planar single cells. A detailed test campaign at different operating conditions in terms of temperature, fuel and oxidant composition was designed. Electrochemical Impedance Spectroscopy and current-voltage (I-V) measurements were used to identify the contributions of different cell components. The electrochemical kinetics derived from the individual resistance terms was implemented in a 2D simulation tool (SIMFC-SIMulation of Fuel Cells) to obtain the detailed global cell behaviour and to understand local occurring mechanisms on anodic and cathodic cell planes. The model was validated for an anode supported cell consisting of Ni-YSZ/YSZ/LSCF-CGO and an electrolyte supported cell consisting of Ni-CGO/YSZ/LSCF-CGO, showing the possibility to tune the parameters depending on analysed cells.
Solid Oxide Fuel Cells (SOFCs) are a promising technology for an efficient transition into a cleaner and renewable energy economy favouring a reduced amount of greenhouse gas emissions (Buffo et al., 2020). These cells convert chemical energy from the reaction gases to electrical energy through an electrochemical route, thus not being limited by the Carnot cycle (Minh 1993; Williams and Vora, 2020). Advantages of this technology include modularity, zero emissions using a hydrogen feed, operability at part loads, fuel flexibility and optimal stack performance with greater than 60% electrical efficiency and reaching 90% CHP efficiency in cogeneration applications (Elmer et al., 2015). Moreover, the high temperature operation (usually more than 650°C) eliminates the need for noble metals as electrocatalysts, replacing them with solid oxide-based layers which are more resistant to impurities in inlet streams such as CO and CO2. In fact, carbon containing fuels are possible in addition to hydrogen due to the catalytic reforming activity of state-of-the-art fuel electrode materials. Moreover, the common backbone materials used in commercial SOFCs are less expensive in comparison to noble metals, as a quick comparison among main solutions for both configurations confirms: ∼15 $ kg−1 (NiO), ∼7 $ kg−1 (Y2O3) and ∼3.5 $ kg−1 (ZrO2) versus ∼20 k$ kg−1 (Pt) that is commonly used for low temperature operation (Mock et Schmid 2009; Dubois and Ricote, 2017). On the other hand, the high working temperatures might require more expensive balance of plant or stack materials. Considering the lack of pure hydrogen distribution grid, the possibility to feed light hydrocarbons into direct internal reforming configuration promotes a wider SOFC spread, also reducing the requested units in the balance of plant. Nevertheless, large temperature gradients on the cell plane and carbon deposition can significantly worsen the performance. For the first point, an optimised catalyst distribution decreases the mismatch between the heat required by endothermic reforming and the heat produced by the exothermic electrochemical reaction (Audasso and Bianchi, 2020). Alternatively, a pre-reformer can be used. Whereas the carbon deposition issue is overcome by increasing the steam to carbon ratio as well as avoiding an excessive fuel dilution that provokes the cell efficiency reduction (Aguiar and Adjiman, 2004).
The basic fuel cell structure consists of a combination of layers with different functions and hence used materials differ. Ceramics or metal ceramic composites are the primary choice due to their ability to withstand high temperatures; moreover, they have desirable properties under both reducing and oxidising atmospheres. Nickel is widely chosen as electrocatalyst at the fuel electrode due to its high electronic conductivity and activity for hydrogen evolution. Acceptable ion conductivity is achieved through the introduction of composites, consisting mainly of Yttria Stabilized Zirconia (YSZ) (Mogensen et at, 1993) or Scandia Stabilized Zirconia (SSZ) (Lyu et al., 2020). Studies have shown that also Cerium Gadolinium Oxide (CGO) can be an effective electrode material with a higher ionic conductivity at lower temperatures (600°C compared to 700°C for YSZ) (Anjaneya et al., 2013). Ni-CGO has shown better performance than Ni-YSZ due to reaction sites extended into double phase boundary (i.e., ceramic-gas interface) in addition to triple phase boundary (i.e., ceramic-metal-gas interface). It makes this type of cell also more resistant to carbon deposition and contaminant poisoning (Zhang et al., 2010; Riegraf et al., 2017). Moreover, also the microstructural degradation is different during long-term operations. Ni-coarsening has been identified as one of the main degradation causes in Ni-YSZ anode supported cells (Hauch and Mogensen, 2011). In Ni-CGO the agglomeration of Ni particles is still detected, but it has a lower influence on global cell performance (Zekri et al., 2017). As air electrode material, well-known catalysts for oxygen reduction are composites of electron and ion conducting phases, such as LSM (Lanthanum Strontium Manganite) and YSZ, or mixed ionic-electronic conductors as LSCF (LaSrCoFe perovskite) (Dusastre et at, 1999; Jørgensen and Primdahl, 1999) as single phase or with CGO. Some new alternatives consist of lanthanum nickelates or cobalt oxides, which show an excellent oxygen surface exchange coefficient but low stability with other cell materials (Ferkhi et at, 2016; Xia et al., 2016). As electrolyte, fluorite structures such as zirconia- and ceria-doped materials are widely used due to their high oxygen ion conductivity (Tsipis et at, 2008; Tanwar et al., 2016).
Among different SOFC design types, planar cells are widely adopted due to the ease of upscaling to large stacks at high power density. The structural stability is achieved by making 1 cell component thicker than the rest. Considering both mechanical strength and production cost, Anode Supported Cells (ASCs) and Electrolyte Supported Cells (ESCs) are commonly used in commercial applications (McPhail and Kiviaho, 2017). They differ in layer specifications as well as materials used, influencing individual resistance contributions and thus the overall cell performance. A thicker electrolyte favours easy manufacturing and good mechanical stability but, on the other hand, results in high ohmic losses due to longer paths for ion migration (Kusnezoff et al., 2016). The use of the anode as support layer allows for lowering ohmic losses using a thinner electrolyte and so reducing working temperature, although there is a higher probability of crack formation and gas diffusion issues (Irshad et al., 2016). A further alternative is the Metal Supported Cell (MSC) concept, which is a variant of ASC configuration where Ni-based cermet support is replaced by a ferritic steel porous layer. This is less expensive than zirconia and ceria ceramics that are used only in the thin anodic active layer for electrochemical reactions, allowing also for the working temperature reduction down towards 600°C (Leah et al., 2018; Blennow et al., 2019; Thaler et al., 2019; Udomsilp et al., 2019). Metallic ruggedness as well as higher thermal and redox cycle tolerance observed in some tests may incentivise metal support based SOFC use for portable applications (Tucker 2010).
This work focuses on understanding the differences in electrochemical behaviour in state-of-the-art solid oxide ASC and ESC planar configurations at global as well as local level. The study was based on both experimental and modelling approaches, allowing for a complete overview of SOFC operation. Firstly, the cells were characterised experimentally using electrochemical (I-V curves and EIS spectra) and microstructural (SEM) techniques. The experimental campaign was carried out at different temperatures and flow compositions. Furthermore, a Fortran based simulation tool which can be easily integrated within commercial process softwares for system optimization studies was used. The quantitative deconvolution of EIS spectra was performed using the same Equivalent Circuit Model (ECM) for both designs. In case of ASC with Ni-YSZ, it is a well-consolidated knowledge, whereas the study of ESC with Ni-CGO based fuel electrode was more challenging due to the peak shifts to low frequencies resulting in overlap of anodic and cathodic phenomena. This analysis was the basis for the tuning of electrochemical kinetics implemented into SIMFC (SIMulation of Fuel Cells) model. The model allowed for the evaluation of the global cell performance as a function of the local values of the different overpotential terms through specific maps developed along anodic and cathodic planes. With the aim to apply this tool for global power system simulation, the work found an optimised solution combining a reliable kinetics formulation and a fast model convergence. The model converges within few seconds, a shorter time than that of common computational fluid dynamic models. Moreover, the approach presented here for SOFC nominal operation could become the baseline for cell degradation analysis where the time evolution of detected kinetic and microstructural parameters are considered.
Simulation of cell voltage as a function of applied current is the first step to forecast the cell behaviour. Starting from rigorous theoretical formulations of the electrochemical kinetics, specific structural parameters are identified as affecting cell resistance dependence on reactant partial pressure and temperature. In addition, a detailed physical model can provide the description of cell operation in terms of temperature and gas concentration gradients. Different approaches studied in literature range from 0D to 3D models (Aguiar and Adjiman, 2004; Tang et al., 2016; Hauck and Herrmann, 2017). In 0D simulations, the global cell performance is evaluated neglecting local phenomena and needing minimal system information. On the other hand, 3D models provide a detailed description of all layers, resulting in higher computational times. 2D models are a good trade-off which permits to optimise computational efficiency without loss of important information (Ghorbani et at, 2018). In particular, ASC planar cells have been widely analysed, solving conservation equations along cell cross-section with a 2D approach. For instance, the CFD analysis was combined with a specific SOFC electrochemical model based on finite volume method and allowing for the evaluation of temperature, gas composition and velocity along both fuel and oxygen channel directions (Ni, 2010). A further improvement consisted of the addition of specific models to describe the direct internal reforming operation in dynamic state (Luo et at, 2016). Considering cell cross-section, thermal effects due to electrochemical reactions were evaluated through a local study highlighting high temperatures that characterised the anode-electrolyte interface (Zitouni et al., 2011). Based on material, charge and momentum balance resolution, a model was developed in COMSOL simulation environment to underline the dependences among applied current densities and structural conditions along both perpendicular and parallel flow direction (Shen et al., 2018). Following a 2D approach, studies forecast main physicochemical features on the cell plane, which become relevant for industrial scale applications. Indeed, high gradients can occur between inlet and outlet of a full-size cell. Focusing on this, a cell was modelled by assuming both anodic and cathodic gas sections as a series of continuous stirred tank reactors: material, energy and charge balances were solved for each of them. The interactions among the different units thus simulated the global system behaviour (Hosseini et al., 2011). In order to reduce computation efforts, this modelling work was implemented in Aspen Plus simulation software to study possible feeding configurations: co-, counter and cross flow (Amiri et al., 2015). Nevertheless, only a few studies have presented a simulation tool validated for both ASC and ESC designs. A 2D cross-section modelling was recently proposed, where mass, charge and heat transport phenomena were solved through finite element method. The model tuned for ASC single cells and stacks was adapted to ESC configuration assuming the use of the same electrocatalyst materials (Russner et al., 2020). Whereas, another study underlined temperature distributions along the cell thickness in feeding section of a Ni-YSZ/YSZ/LSM cell for both designs (Djamel et al., 2013).
In this framework, SIMFC-SIMultation of Fuel Cells is proposed as a valid example of modelling optimization, allowing a detailed local description with reduced computational efforts (Bianchi et al., 2020c). Based on physical principles, it models the system behaviour through the resolution of material, energy, momentum and charge balances on single cell plane. This analysis can be also extended to stack level: considering the interactions among different stack units, a local simulation can be performed for each of them in order to guarantee a detail control of operation. Its core is the electrochemical kinetics formulation adjusted in function of specific cell structure by distinguishing mechanisms which occur in support and functional layers.
For both ASC and ESC designs, commercial planar cells were laser cut to 5.3 cm × 5.3 cm with an active area of 16 cm2. These cells were tested in single cell alumina test houses described in detail elsewhere (Hauch et al., 2006). The cells were sealed only on the fuel electrode side through a gold seal, Ni and Au meshes were used as anodic and cathodic gas distribution layers and current collectors, respectively. Both configurations, ASC and ESC, used state-of-the-art commercial cells. The different layers of ASC are a Ni-YSZ anode acts as a support and a functional layer (∼250 µm), a dense YSZ electrolyte layer (8–10 µm), a CGO barrier layer (∼5 µm) and a LSCF-CGO air electrode (∼50 µm). In case of ESC, the cell consists of a thin Ni-CGO fuel electrode (∼25 µm) which consists of a CGO layer close to the electrolyte (∼2 µm), a Ni-CGO functional layer (15–20 µm) and a Ni contact layer (∼5 µm) which aids contacts with the Ni meshes. Other cell components are a dense YSZ electrolyte (80–85 µm), a CGO barrier layer and a LSCF-CGO air electrode (30–35 µm) and a LSMC contact layer (∼5 µm). The cells were laser cut to the desired size from larger full cells in both cases.
For the evaluation of electrochemical performance, a Solartron 1,260 frequency analyser was used to record EIS spectra. The spectra were recorded in a frequency range from 96.5 kHz to 0.1 Hz for ASC and 96.5 kHz to 0.01 Hz for ESC with an AC current perturbation of amplitude 0.06 A. The minimum frequency for ESC was chosen to be lower due to processes that were occurring at frequencies close to 0.1 Hz. Twelve points per decade were recorded to ensure good quality data.
For microscopic analysis, the cells were cut into roughly 1 × 1 cm2 samples along the flow direction. These pieces were then embedded in epoxy mixtures. Afterwards, they were polished using SiC grinding paper followed by fine polishing with diamond polish of around 1–9 µm. The samples were analysed using the Secondary Electron (SE) imaging technique at 15 keV to study surface features and through an in-lens SE detector for the percolation imaging technique at low accelerating voltages of about 1 keV (Thyden 2008). For the SE imaging the samples were further carbon coated to avoid drift due to high charge build up on the epoxy surface. The images were recorded using a Zeiss Ultra field emission SEM. For quantification purposes, up to 1,000 particles of each sample were taken to ensure a statistically accurate value of the different phases. An in-house developed semi-automated software, called ManSeg, based on Matlab environment was used for this purpose (Bowen, 2021).
In order to reduce the NiO in the fuel electrode, the cells were heated to 750°C for ASC and 850°C for ESC feeding Nitrogen to the fuel electrode and air to the air electrode. After reaching these reduction temperatures, the anodic gas was switched to 5% mol H2 in N2 for 2 h followed by 1 h under pure H2. The reduced cells were characterized through I-V curves and EIS spectra. In order to obtain the parameters for the simulation, measurements were recorded under variation of the following conditions: H2/H2O ratio to the fuel electrode (96/4, 80/20, 50/50 H2/H2O), O2 partial pressure to the air electrode (21/79, 100/0 O2/N2) and temperatures (750°C, 800°C, 850°C, 900°C) following manufacturer protocols. Since changes of the cell microstructure were observed at temperatures above 850°C, these results were not included in the further analysis. Total flow rates were maintained at 25 L h−1 to the fuel electrode and 140 L h−1 to the air electrode for all feed compositions. For the supply of the anodic steam, H2 and O2 were combusted within a chamber at the inlet of gas feed tube in order to produce a H2-H2O mixture as fuel electrode reactant (the complete system description is presented elsewhere (Barfod et al., 2003)). All impedance measurements were carried out at OCV conditions followed by I-V curve measurements. The design of experiment for both cell configurations is shown in Table 1.
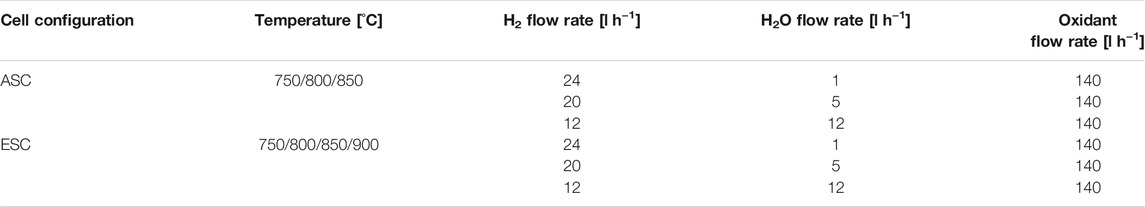
TABLE 1. Summary of different working conditions at which cell fingerprints were recorded.
An in-house developed Python-based software “Ravdav” was used to analyse the measured EIS spectra (Graves 2012). The data quality for individual spectra was checked through linearised Kramer Kronig tests. Nyquist plots, Bode plots and Distribution of Relaxation Times (DRT) deconvolutions were used for a qualitative interpretation at characteristic frequency ranges. However, the overlap of anodic and cathodic contributions at lower frequencies makes it difficult to distinguish accurately the peaks, specifically in ESC configuration. In order to aid the process identification, gas shift tests were carried out and Complex-Non-Linear-Squares (CNLS) fitting approach was applied for the quantification of individual physical-electrochemical phenomena using an appropriate ECM.
SIMFC (SIMulation of Fuel Cells) is an in-house built code to predict high temperature cell behaviour at local level (Audasso et al., 2017; Bianchi et al., 2020c). It was developed in Fortran due to ease of implementation in commercial simulation softwares such as Aspen Plus. To achieve the desired level of detail, the anodic and cathodic planes were divided into several sub-cells, considered as single CSTR units where conservation equations were applied in steady state working conditions (Conti et al., 2019). For this work, a 10 × 10 mesh was applied considering a co-feeding gas flow configuration where the x-axis represents the direction of both anodic and cathodic streams and the y-axis is the orthogonal direction on the cell plane, as shown in Figure 1. Local values of main system properties, such as molar flow rate N, gas partial pressure p, current density J and overpotential η, were evaluated in each sub-cell. Their averages allowed for identifying global cell parameters. The used equations are represented in Table 2; their rigorous formulation was described in detail in authors’ previous works (Bianchi et al., 2020a; Bianchi et al., 2020b). For each reactant gas stream (a H2-rich feed at fuel electrode and a N2-O2 mixture at air electrode), material balances along the feed flow directions were solved deriving the electrochemical reaction rate from Faraday’s law. In this way, the local bulk composition for every sub-element was evaluated. Gas composition at active sites related to diffusion losses was obtained solving 1-D material balance along the electrode thickness (z-axis direction), using the previously calculated bulk concentration as boundary condition. It was assumed as a Fick’s diffusion mechanism with redox reactions not limited only to electrode-electrolyte interfaces due to ions and electrons migrating inside the electrode structure in both ASCs and ESCs. In particular, the ASC configuration was divided in two zones, an functional layer and a support where no reaction occurs. Whereas in ESC the hydrogen evolution characterizes the whole fuel electrode volume due to its lower thickness. The diffusion coefficient was calculated as a combination of molecular and Knudsen terms corrected by introducing porosity and tortuosity values.
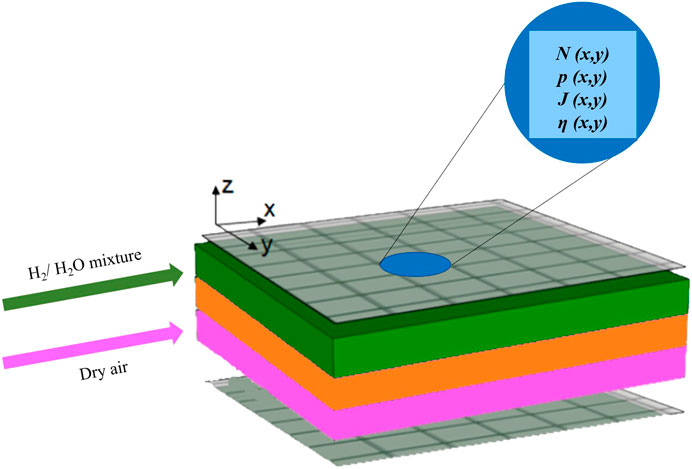
FIGURE 1. Cell structure consisting in fuel electrode (green), electrolyte (orange) and air electrode (violet), which is modelled through 2D discretization as anodic and cathodic side meshes allowing for local property calculation in each sub-cell.
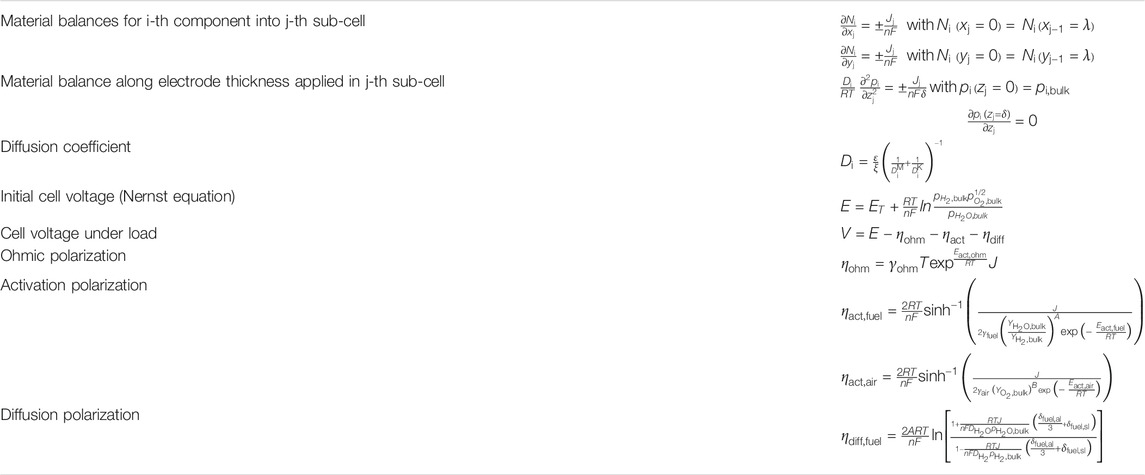
TABLE 2. Main equation used in SIMFC to evaluate cell performance.
The core of the code is the electrochemical kinetics (Table 2), specific for anionic-conductive electrolyte SOFC, where O2 is reduced at the air electrode producing oxygen ions that migrate to the fuel electrode where hydrogen gas is oxidized releasing two electrons to complete the circuit Eqs 1–3.
The initial cell voltage representing the maximum reachable value was evaluated through the Nernst equation. Under electric load, the cell is subjected to different polarizations depending on temperature, gas composition and materials structure. The ohmic resistance was calculated by an Arrhenius type equation (Leonide 2010), whereas activation and diffusion overpotentials were derived from the Butler-Volmer equation following a rigorous kinetic approach (Bosio 2003). A hyperbolic sine form was proposed for both anodic and cathodic activation terms (Noren et at, 2005). As diffusion term, only the fuel electrode contribution was considered relevant, indeed a high oxygen mobility is commonly evaluated by feeding air or higher O2 composition in perovskite base cathodes (Leonide 2010). The bulk partial pressures of hydrogen and water were obtained through material balances on cell plane, while the active site composition was an average value along the electrode thickness derived from a 1-D model. Since a local approach was followed, no specific term was needed to correct the resistances due to reactant gradients on the cell plane (i.e., Nernst overpotential) (Conti et al., 2019). Based on a semi-empirical approach, the required experimental parameters were derived by different resistance terms evaluated through EIS spectra and DRT analysis.
The electrochemical performances of the cells were obtained by pairing experimental observations with additional information provided by the simulation tool. Indeed, a detailed local behaviour description permits comparison of both configurations under similar working conditions. The analysis of EIS profiles, I-V curves and SEM images allowed the identification of initial performance parameters and a preliminary code tuning. Furthermore, model validation over a wide range of ASC and ESC operating cases was performed. The model was thus used to highlight the differences between these two configurations, focusing mainly on the dependence of polarization losses on cell behaviour.
The microstructures of the fuel electrodes of reduced ESC and ASC samples are shown in Figure 2. The images were captured using low accelerating voltages (1 keV) to highlight the percolating Ni (bright phase) from the non- or less percolating phases (dark phases). The high contrast between the different phases in the microstructure helped to distinguish the particle size distributions in each electrode. In case of ASC cells, all Ni particles have the same intensity of brightness in comparison to ESC cells where the Ni particles in the contact layer are seen to be brighter than in the bulk. This is a possible result of the differences in the percolating network in the 2 cells, where in ESC the Ni particles form the percolating network with CGO which is known to have a relatively lower electronic conductivity than metallic Ni and thus appearing darker in the images. In case of ASC, the microstructure is uniform with fine particles throughout the Ni-YSZ fuel electrode (∼2 µm). In the Ni-YSZ cermet of the ASC, the active electrode region is limited to a few microns (5–10 µm) from the interface based on the particle size and operating conditions (Brown and Primdahl, 2000). The cross section of the ESC shows bigger and non-uniform Ni as well as CGO particle sizes of several microns throughout the electrode thickness. The CGO in the fuel electrode also contributes to the hydrogen oxidation reaction and thus the active area expands further into DPB reaction sites in addition to TPB ones (Feng et al., 2014; Riegraf et al., 2017).
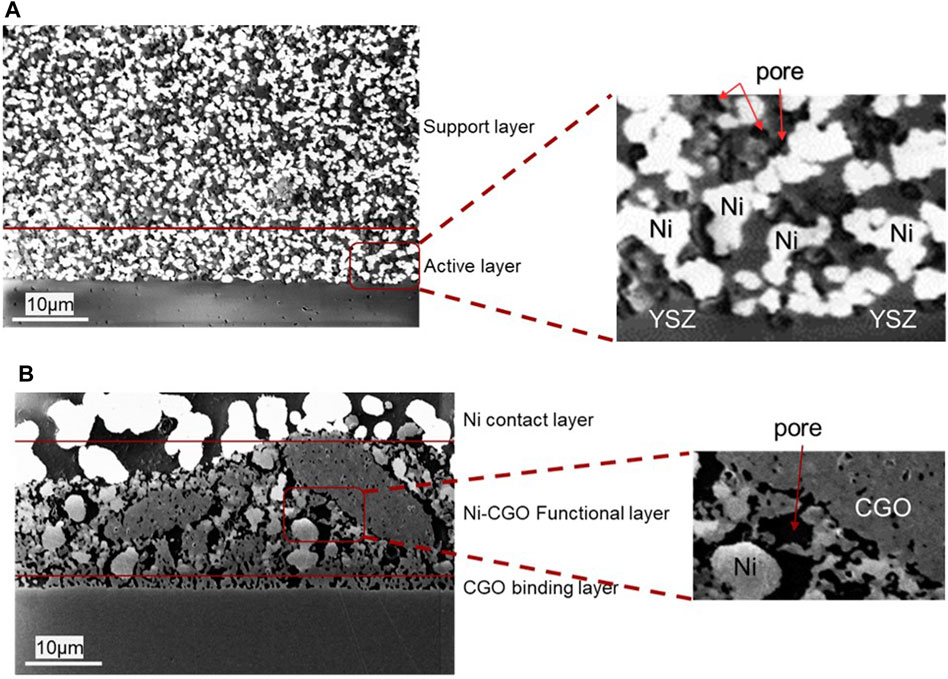
FIGURE 2. Fuel electrode microstructure recorded at 1 keV using an in-lens detector in SEM for (A) ASC composed of pores (black), percolating Ni (bright) and YSZ (grey) distributed uniformly and (B) ESC with the CGO binding layer close to the electrolyte, the active layer composed of Ni (bright), CGO (grey) and pores (black), and as the top layer a Ni contact layer consisting of larger percolating Ni particles.
Specific microstructure parameters such as layer thicknesses and porosities required to describe material transport mechanisms were evaluated through SEM images of cell cross-section. For this purpose, several in-lens SE images were recorded. An image width of 15 µm was selected as clear particle differentiation was obtained. Moreover, a high contrast between different phases was used for these images. Particle distributions and phase fractions were quantified on 1,000 particles of each phase on both samples for statistical accuracy. Thus, a porosity of about 35–40% was determined for electrodes, whereas 1% was indicative for the dense electrolyte. The tortuosity of fuel electrode was assumed equal to 4 in both designs following a reference value (Yoon and Gopalan, 2009).
Several working conditions were tested varying the cell temperature and reactant composition for both cell configurations. The raw impedance spectra as recorded at OCV and with changing H2/H2O ratios and oxidant gas at 850°C are shown in Figure 3 as an example. For the analysis of these data, the recorded spectra were corrected with the short circuit measurements. The inductance contribution due to wiring was thus removed using a Kramer-Kronig procedure. Experimental results recorded at other temperatures and feed compositions are provided in the Supplementary Figures S1, S3). The Nyquist and Bode plots were used to compare the different EIS spectra (Figures 3A–D, respectively) and the Analysis of Difference in Impedance Spectra (ADIS, (Jensen et al., 2007), was employed to inspect the changes occurring at different frequencies depending on applied gas composition (Figures 3E,F). EIS evaluation using the ADIS approach helps in understanding the electrode responses towards varying gas feed to the electrodes since it is based on the differences in derivative of the real part versus the natural logarithmic of frequency for the recorded spectra. (Jensen et al., 2007). The Kramer Kronigs linear test was performed on all spectra to ensure that the good quality data with low noise (<2%) was used for parameter identification.
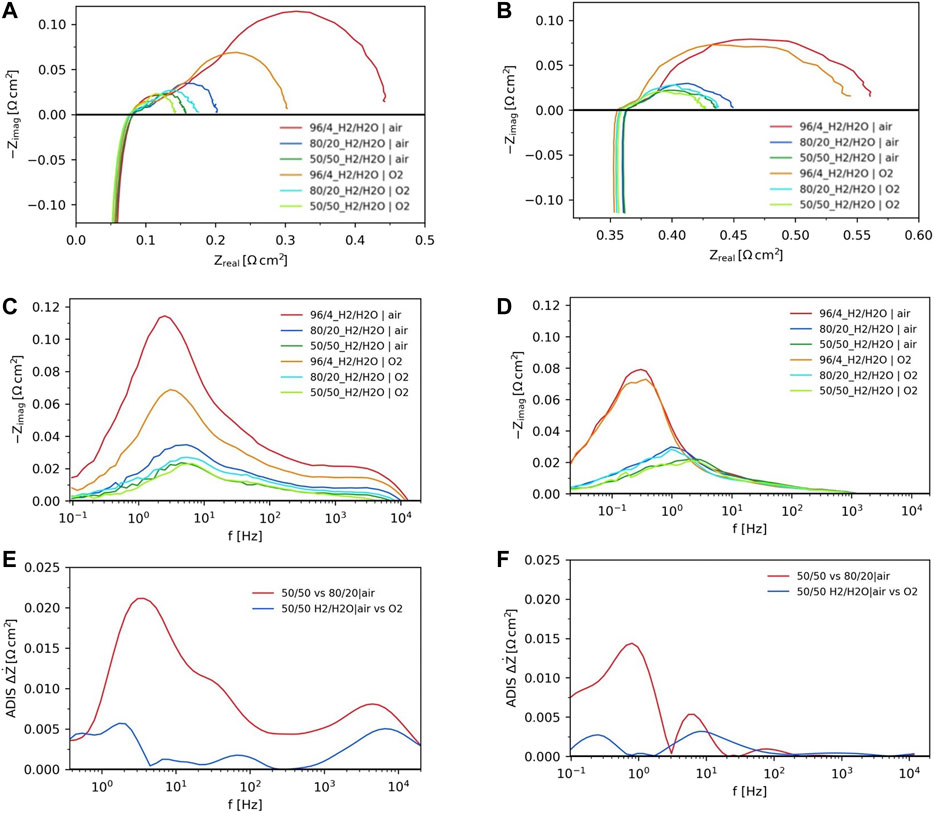
FIGURE 3. Nyquist and Bode plots under different H2/H2O ratios with variation of oxygen partial pressure at 850°C for ASC configuration (A,C) and ESC configuration (B,D), evaluation of dependences on fuel and oxidant composition through ADIS for ASC (E) and ESC (F).
In terms of ohmic resistances, the ESC has a value ∼6 times higher than the ASC at the same operating conditions (0.06 Ω cm2 for ASC and 0.35 Ω cm2 for ESC) at 850°C and different reactant compositions. Indeed, this lower number for the ASC design is directly linked to electrolyte thicknesses (8 and 80 µm for ASC and ESC respectively).
The change of H2/H2O ratio at the fuel electrode was studied to understand the different polarization contributions as well as the impact of steam composition on occurring phenomena. The increase of H2O partial pressure fed to the fuel electrode leads to a decrease of the polarization resistance for both ASC and ESC (Figures 3A,B). Previous studies indicated that steam favours electrode surface processes occurring on the fuel electrode (Vogler et al., 2009; Bessler et al., 2010). On Ni-YSZ cells, an improvement of ionic conductivity in the electrode was shown at high water partial pressure (Linderoth 2005). In the case of the Ni-CGO fuel electrode configuration, the steam can further have an autocatalytic effect accelerating oxidation processes through the formation of hydroxyl ions in the reaction environment (Athanasiou et al., 2020). The same trends with increasing steam to the fuel electrode was detected when using either air or oxygen to the air electrode.
A more detailed characterization of electrochemical behaviour was obtained looking into the specific frequencies in Bode and ADIS plots (Figures 3C–F) at which the different fuel electrode processes occur. There are significant differences between 2 cell configurations. For ASC design, the contributions are at both low and higher frequencies (1 Hz–10 kHz) as shown in Figure 3C. Lower frequencies are usually assigned to gas transport processes, whereas high frequencies are correlated to charge transfer on the TPB in Ni-YSZ electrode. From the ADIS plots (Figure 3E), when changing the steam content in hydrogen from drier to wetter conditions on the ASC, three peaks are observed. The low frequency change at ∼2–4 Hz is related to the fuel conversion, the change at ∼30–50 Hz depends on diffusion contribution and the change close to ∼2–6 kHz is due to the TPB process (Rao et al., 2019a). In case of ESCs (Figure 3D), electrochemical processes occur at even lower and in the middle frequency region (∼0.1–∼100 Hz). The lack of a high frequency contribution is due to material specific properties as CGO is known to have a large capacitance as compared to the YSZ based Ni cermet in ASCs (Riegraf et al., 2015). The low frequency contribution at 0.1–1 Hz is attributed to surface phenomena, mainly charge transfer, because of its variation with the steam in the fuel electrode. The middle frequency region (∼10 Hz) for the ESC configuration may be due to bulk processes, either the oxide transport across the CGO bulk to the surface or across the electrolyte and fuel electrode (Riegraf et al., 2015).
When changing from air to pure oxygen at air electrode side, responses at two to three frequencies change. In case of ASCs (Figure 3C), the observations at ∼0.3–10 Hz are attributed to gas cathodic diffusion in the pores, 10–100 Hz and 0.1–1 kHz to diffusion of oxygen ions in the bulk and oxygen surface kinetics (Leonide 2010; Rao et al., 2019b). Furthermore, as seen in Figures 3C,E a change in the high frequency region is shown which overlaps with the fuel electrode TPB contribution. This observation at ∼4–8 kHz is similar to a previous study using cells with the same air electrode and is related to the LSCF electrode (Rao and Sun, 2018). The question arises why such a large variation related to anode processes is observed when changing the air electrode gas at the same fuel composition. One possible explanation is the presence of small leaks leading to gas crossover from air to fuel electrode and thus to a change of the steam content when using either air or oxygen at the air electrode. Similar crossover from air to fuel electrode was already observed in previous tests (Rao et al., 2019a). This phenomenon may be attributed to crossover around the cell from uneven edges as a consequence of laser cutting larger cells into desired dimensions and the sealing concept with no sealant at air electrode side (gold sealing only at the fuel electrode side). Small pinholes within the electrolyte cannot be excluded as well.
In case of the ESC, when changing from air to oxygen to the air electrode side, two peaks are observed (Figure 3F). The low frequency peak (∼0.1–0.5 Hz) is attributed to gas transport mechanisms, whereas middle frequencies (∼5–30 Hz) are an indication of the activation polarization losses at the cathode. The occurrence of these peaks are in the range reported in literature for LSCF cathodes (Leonide 2010). It must be noted that the peak responses in case of gas shifts on both fuel and air electrodes are in the same frequency region which poses a challenge towards the deconvolution of the individual peaks.
Despite a similar overall reaction for both configurations as described above, the individual contributions are visible at different frequencies due to the specific catalytic activity of each used fuel electrode material (TPB active sites for Ni-YSZ and mainly DPB ones for Ni-CGO), as summarized in Table 3. Aiming at the validation of an equal approach, the same ECM was applied for both configurations under the assumption that the different cell contributions are comparable although evaluated at different frequencies for the studied cases. ECM model and the attribution of its terms to each cell layer are illustrated in Figure 4. Here, the cell behaviour was modelled using an inductance element (L) in series with an ohmic resistor (R1) and a polarisation resistance (Rp), which is composed of four circuits built up of a resistor (R) and a constant phase element (Q) in parallel. A single Gerischer element (G) was also used in series within the ECM. In case of the electrolyte, the dense ion conducting layer is known to be a pure resistor, so it can be represented by just R1 (without any capacitance) and hence it is correlated to the ohmic value (Leonide 2010). R2Q2 is the ionic rail contribution for ASC and ESC configurations. R3Q3 is significant above all in case of ASC due to charge transfer at Ni-YSZ fuel electrode, while this contribution is shifted in case of the ESC due to Ni-CGO fuel electrode composition. Thus, for ESCs, this contribution is coupled with R2Q2 as the ionic rail. The Gerischer element represents the activation polarization of the air electrode for both designs. R4Q4 and R5Q5 are correlated to gas conversion and diffusion contributions, namely the resistance due to the finite supply of gas, in case of ASC (Primdahl et at, 1998; Bessler 2006); while R4Q4 is dominated by charge transfer in ESC. Finally, R5Q5 for ESCs consists of diffusion polarisation at the air electrode. In the Supplementary Material ECM validation is presented through some examples showing the different cell contributions along with the total simulated fit for both configurations (Supplementary Figure S5).
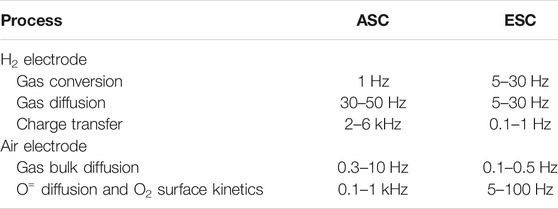
TABLE 3. Summary of different electrode processes occurring in both configurations evaluated through DRT gas shift analysis and available literature.
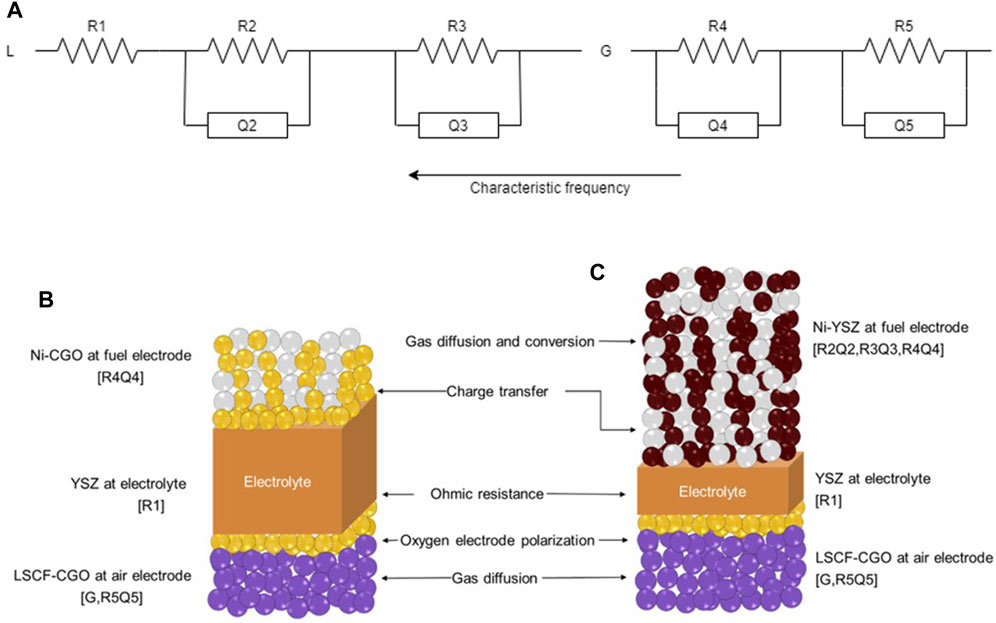
FIGURE 4. ECM used for the CNLS fit of recorded impedance data (A), moving from the lowest frequency (R5Q5) to the highest one (L) and their attribution to each cell layer for ESC (B) and ASC (C) configurations.
After the attribution of frequency-process pairs, each resistance contribution was evaluated from EIS spectra to identify the kinetics parameters of ohmic and activation overpotentials to be introduced into the simulation tool. In case of Ni-YSZ based ASCs, the different cell contributions have been widely studied (Leonide 2010). Whereas, for ESCs the distinction among different resistances is more challenging due to overlapping effects. Here, it was assumed that the cathodic terms would be comparable due to similar material composition and layer thicknesses, but they differ in specific microstructures. Through this assumption the contribution from the Ni-CGO based fuel electrodes could be identified more accurately. Focusing on temperature dependence, its effect on identified processes was studied through the comparison between data recorded at 800°C and 850°C feeding dry air as oxidant (Supplementary Figures S2, S4) The main significant changes occur in the ohmic contributions. While in ASC configuration the ohmic resistance changes from 0.1 to 0.08 Ω cm2, in case of ESC it drops from 0.5 to 0.36 Ω cm2 with the increase in temperature. As a large polarization arc in Nyquist plots shows, also polarization terms are temperature sensitive confirming faster kinetics at 850°C. Following these observations, both electrochemical reaction and charge transport are thermally activated processes, which can be modelled following an Arrhenius type relation. Focusing on the ohmic resistance Zreal,ohm, it was directly measured from EIS spectra considering the real values at the highest measured frequencies when the inductive part becomes vertical and unchanged (at frequencies close to ∼96 kHz). According to the following temperature dependences (Eq. 4), the activation energies Eact,ohm for ASC and ESC are 104 and 73 kJ mol−1 respectively, as shown in Figure 5A. Whereas the pre-exponential coefficients γohm differ three orders of magnitude changing from 1.3x10⁻⁷ Ω cm2 K−1 to 7.3 × 10⁻¹⁰ Ω cm2 K−1 for ESC and ASC samples, confirming a higher ohmic resistance in ESCs.
Focusing on anodic processes, the activation polarization is correlated to occurring reactions at TPB and DPB sites. In the case of Ni-YSZ based ASC, its value was obtained by EIS spectra through DRT and ECM analysis, which allowed for detecting the resistances due to anodic reaction path at TPB, resulting in the frequency range of around 2–6 kHz. Since all EIS measurements were evaluated at OCV conditions, the activation resistance Zreal,act,fuel derived from Butler-Volmer equation was simplified into a linear formulation and so the Eact, fuel value was determined considering only the temperature dependence (Eq. 5).
In Ni-YSZ anode configuration, Eact, fuel results equal to 107 kJ mol−1 which is in accordance with literature showing 100–116 kJ mol−1 as possible range (Zabihian et at, 2017). A similar approach was followed for the Ni-CGO based ESC case considering that here the processes of interest result shifted to a lower frequency. Moreover, a direct comparison with previous reference results is more difficult since the specific Gd content has a significant influence on the electrochemical performance and frequency ranges of the EIS resistance contributions (Anjaneya et al., 2013; Riegraf et al., 2017). A value equal to 86 kJ mol−1 was identified by EIS analysis for a Ni-CGO cell at around 0.1–1 Hz, detected frequency range for the reaction mechanism occurring at DPB, which is consistent with other experimental results ranging between 77 and 111 kJ mol−1 for a Gd doping of 10–40% (Iwanschitz et al., 2010). Here, a lower fuel electrode activation of ∼20% characterizes Ni-CGO anodic polarization compared to Ni-YSZ, confirming its more favoured kinetics based mainly on DPB reaction paths (Figure 5B).
FIGURE 5. Identification of temperature dependence based on the DRT analysis for both designs: (A) ohmic resistance of cell, (B) activation resistance of fuel electrode.
The overall cell behaviour was estimated under load through I-V curve profiles. Preliminarily the model was tuned to consider electrode dependences on reactant composition through both EIS outcomes and I-V slopes. In Figure 6 overpotential values are reported as derived from experimental I-V curves. Focusing on the global cell overpotential at 850°C and different fuel feed compositions, the slope reduces by increasing the fuel water content in both designs. It results in a stronger steam dependence at 96/4 H2/H2O, whereas there are quite linear trends for the other considered cases as previously shown in EIS profiles (Figures 3A,B). Despite that multistep processes characterise SOFC behaviour, the overall rate is mainly dependent on the rate-determining step that is much slower than others. This allowed for applying Butler-Volmer formulation which models a single-step charge transfer reaction (Kazempoor et at, 2014). In the case of Ni-YSZ based ASC the rate-limiting step is the charge transfer during hydrogen spillover between Ni and YSZ surface (Bessler and Warnatz, 2007). Looking at ESC design, the charge transfer involving hydroxyl ion species and Ce surface is the rate-limiting step for Ni-CGO fuel electrode (Feng et al., 2014). Consequently, by Butler-Volmer equation linearization the fuel electrode activation resistance Zreal,act,fuel at OCV was formulated as Eq. (6), where now the dependence on reactant compositions is underlined.
According to experimental observations and previously performed DRT analysis, the kinetic order, A was derived with respect to H2O/H2 ratio considering the dependence of anodic resistance on feed composition at OCV. Through this approach, both reactants have the same kinetic order as absolute value, i e; 0.3 and 0.45 for ASC and ESC respectively, which is an acceptable approximation for the tested conditions where stressed operation is avoided by working far away from the limiting current. This assumption results in a positive order regarding water and a negative order with respect to hydrogen, which was confirmed for a wide fuel composition range in previous studies (Boigues-Muñoz et al., 2015; Kooser et al., 2020). Following the same approach, also the kinetic order, B for oxygen was identified (Eq. 7). In this case the oxygen ion formation is the rate-determining step (Okamoto and Kawamura, 1983).
A value equal to 0.17 was identified for ASC configuration, considering cathodic resistance terms through DRT and ECM analysis; it was also validated for ESC case despite detected issues due to process overlapping as already previously discussed. This number considers the low cell dependence on oxidant percentage which characterizes I-V profiles. The activation energy at the air electrode was assumed to be 110 kJ mol−1 following a previous work (Zabihian et at, 2017). The pre-exponential coefficients correlated to the effective active site distribution in tested materials were derived by fitting I-V curves: rich feed conditions (i.e., 96/4 H2/H2O anodic mixture and pure O2 as cathodic feed) were considered in order to minimize the effect of an electrode when the other was under study. The detected parameters were 1.1 × 10⁵ A cm−2 and 2 × 10⁴ A cm−2 for Ni-YSZ and Ni-CGO electrode respectively. In both designs a common value of 3 × 10⁵ A cm−2 was evaluated as pre-exponential coefficient for LSCF-CGO electrode, following the previous assumption of a comparable resistance at cathodic side. Both values are within reference ranges for SOFC kinetics, resulting in 104–106 A cm−2 for fuel electrode and 104–105 A cm−2 for air electrode (Leonide 2010).
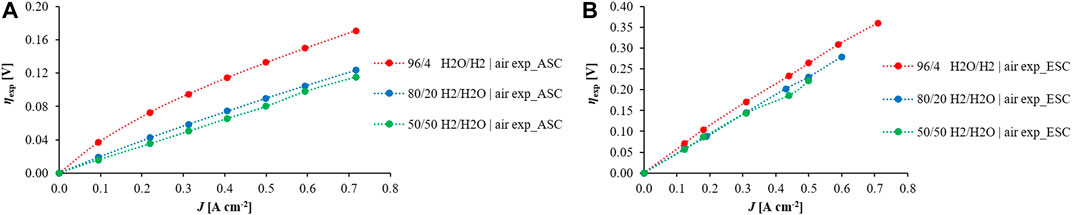
FIGURE 6. Overpotentials profiles at 850°C and air as oxidant, changing fuel compositions for (A) ASC and (B) ESC derived from experimental observations.
The proposed kinetics was validated for a wide range of working conditions as described in Table 1. The applied current density ranges from 0.1 to more than 1.5 A cm−2 according to I-V curve measurements. A good match between experimental and simulated data was obtained, reflected by a small average error of 1% in both ASC and ESC configurations (Figure 7).
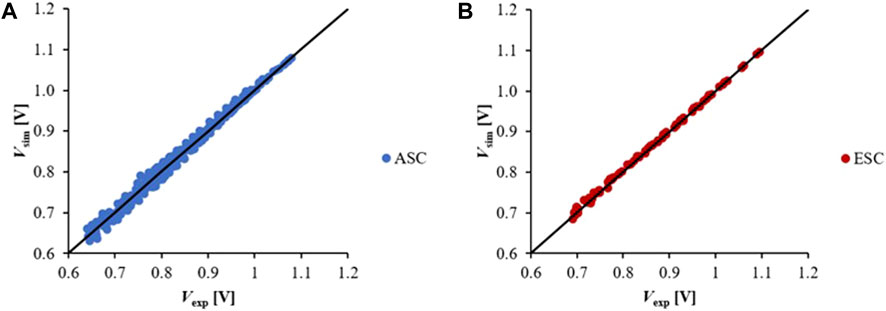
FIGURE 7. SIMFC model validation comparing measured voltages along I-V curve and simulated values at different working conditions for (A) ASC and (B) ESC configuration.
After successful validation with experimental values, the model was used to underline the system electrochemical performance considering design operation conditions. This aimed at understanding cell behaviour under desired reactant compositions and temperatures. Performing the simulations at similar operating conditions, ASCs and ESCs were compared in terms of global cell behaviour as well as local physicochemical parameter changes on the cell plane. Looking at I-V and current-power (I-P) curves, different profiles were evaluated by varying fuel compositions. Despite similar OCV values, higher voltages and consequently higher powers are obtained by increasing current density in the ASC case compared to the ESC one at equal feeding conditions. As example, Figure 8 shows how the cell performance changes in function of fed fuel and oxidant percentages at 800°C. Voltage and power profiles evaluated in other tests are provided in the Supplementary Figure S6. As preliminary observations, the I-V curve slope value is higher in ESC compared to ASC which results to be about a third of the first, due to higher internal resistance values evaluated through EIS spectra. In both, the kinetics depends on reactant compositions: higher powers are obtained with low water content and pure oxygen feed due to OCV increase in accordance with Nernst equation correlation (Table 2). Under load, ESC profiles are quite linear suggesting the main weight of the ohmic overpotential (Figure 8B), whereas in ASC a different trend is underlined above all for low current densities, where the quite rapid voltage decrease highlights also the effect of activation term (Figure 8A). This is more marked at a high hydrogen content when the polarization resistance is higher (compare to EIS spectra in Figures 3A,B).
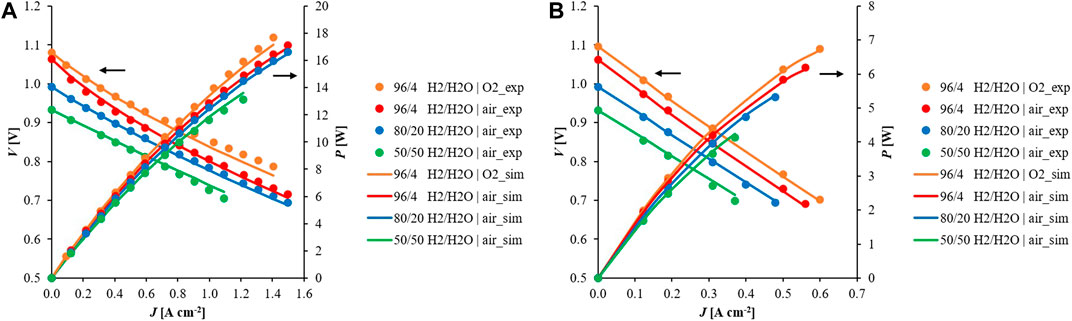
FIGURE 8. Comparison between (A) ASC and (B) ESC voltages at 800°C feeding different fuel and oxidant compositions at anodic and cathodic sides, respectively.
Through the proposed electrochemical kinetic formulations (Table 2), different cell contributions were evaluated dividing total overpotential into ohmic, activation and diffusion terms for different electric loads (Figure 9). In all working conditions, the ohmic overpotential has the main role in the ESC configuration with a weight more than 80%, as confirmed by the quite linear profile of cell total overpotential (Figure 6B). It is almost double of ηohm in ASC case which has a lower electrolyte thickness. In both designs, its percentage increases slightly with the current density value following Ohm law (Table 2). At low loads, the activation polarization is more significant than at high current for both cell configurations. It is the predominant loss in ASC case, where ηact reaches the ∼60% in dry anodic feed (4% steam), whereas it does not overcome 20% in ESC (Figure 9B). In view of specific fuel electrode materials, indeed the Ni-CGO anode shows lower values of activation overpotential since the reaction occurs also at DPB sites. On the contrary, in the Ni-YSZ configuration the electrochemical reaction is limited to the TPB into the active layer. In ASC cell type the activation and ohmic values become comparable with steam content increase, due to the positive effect that steam has on electrochemical kinetics (Figure 9D). The same trend occurs to a lesser extent also in ESC, reaching the minimum of ∼10% at 50/50 H2/H2O mixture feed. Looking at oxidant influence on activation overpotential, the pure oxygen causes a reduction of only one percentage point compared to air case in both designs, so there is a lower dependence, as also suggested by small oxygen kinetic order detected. Since all chosen working conditions avoid high fuel utilizations, the weight of ηdiff is always minimum. In ESC, the diffusion term has a decrease of more than 90% in comparison with the ASC design due to a thin anode (δNi-YSZ is about ten times δNi-CGO), so it can be neglected. Increasing the working temperatures until 850°C, some variations are underlined. The main difference is a higher contribution of diffusion overpotential, above all for ASC case where it reaches also ∼7%. Indeed, a high temperature worsens the resistance, partly due to gas density reduction (Ni and Leung, 2007). In both configurations, ηact decreases favouring the reactions; this effect is again more evident for Ni-YSZ based cell considering its high sensitivity on temperature as suggested by higher activation energy values. The complete results at 850°C are available in the Supplementary Figure S7.
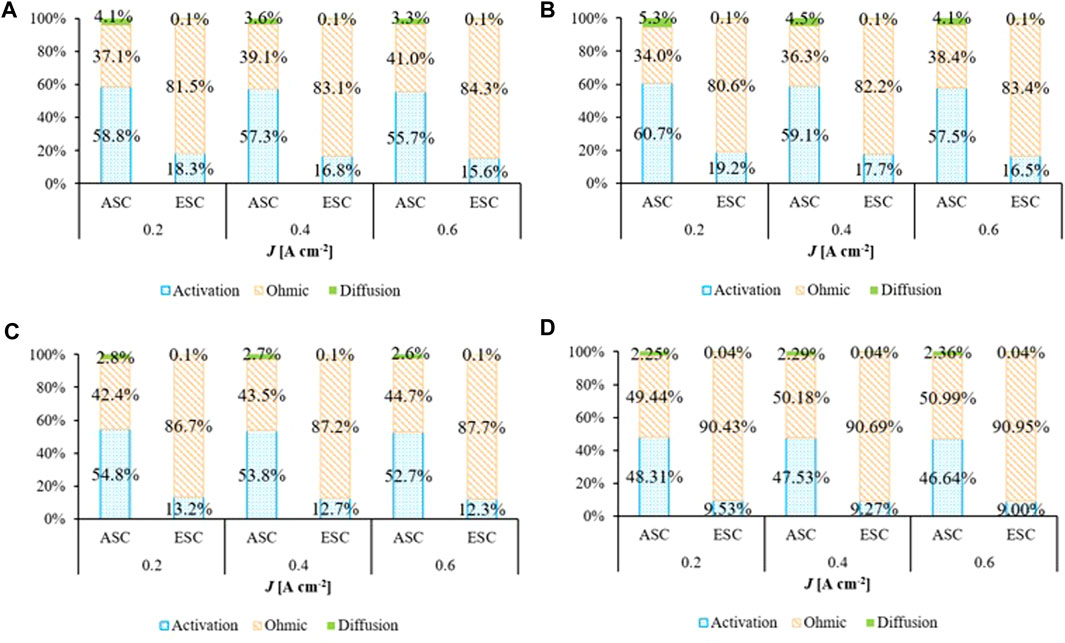
FIGURE 9. Polarization loss weight feeding (A) 96/4 H2/H2O mixture and pure oxygen, (B) 96/4 H2/H2O mixture and dry air, (C) 80/20 H2/H2O mixture and pure oxygen and (D) 50/50 H2/H2O mixture and pure oxygen at 800°C according to SIMFC results.
Applying an electric load of 0.3 A cm−2 and a feed composition of 80/20 H2/H2O and dry air as a sample SOFC working point, the global cell performances are compared in Table 4. The ASC power is ∼10% higher than the ESC one working at both 800°C and 850°C, mainly due to the difference between ohmic overpotentials which have one order of magnitude as mismatch. Comparing the voltage increase with temperature rise, ASC and ESC show an improvement of 10 and 40 mV respectively. The evaluated discrepancy of cell polarization depends on fuel electrode materials. Indeed, its value is higher in Ni-YSZ based cell, reaching 0.037 V at 800°C. Whereas it does not overcome 0.025 V in ESC at the same temperature, having a value lower than ∼30–40% compared to ASC configuration. The observed behaviour is correlated to both higher activation and diffusion resistances of Ni-YSZ fuel electrode. Indeed, in this case the reactions are limited to TPB active sites and mass transfer is also unfavoured due to a thicker anode.
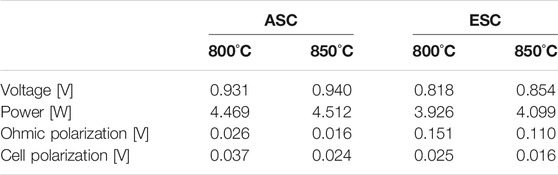
TABLE 4. Comparison of electrochemical performance at 0.3 A cm−2 feeding 80/20 H2/H2O mixture at fuel electrode and dry air at air electrode for 800 and 850°C as working temperatures: simulated average values on the cell plane.
Through the local modelling approach, the description of cell behaviour comprises of more details providing the changes over the cell plane. Fixing a SOFC operation at 800°C with a feed of 80/20 H2/H2O and dry air, Figure 10 shows ohmic and fuel activation overpotentials for both designs (diffusion terms have been previously demonstrated as negligible). Working in co-flow configuration, electrochemical processes go forward along the flow direction resulting in higher detected resistances in the inlet section where the reaction is faster. Significant gradients occur between inlet and outlet area. This point is highlighted considering anodic activation overpotentials due to the fuel composition gradient occurring over the cell plane. Indeed, the water content along the flow direction increases causing a polarization reduction. In ESCs, the inlet to outlet difference is ∼23% compared to ∼30% in case of ASCs when feeding 80/20 H2/H2O mixture (Figures 10A,B). Nevertheless, it can reach ∼80% considering a 96/4 H2/H2O fuel mixture underlining a higher kinetics dependence at low steam percentages. Moreover, the decrease in current density to the outlet also favours lower loss values. Studying the rate of overpotential reduction at local level, it is noticed that higher variations occur close to feed section for both cell designs. For instance, in Ni-YSZ electrode the reduction rate between inlet sub-cells overcomes the ∼41%, whereas at outlet zones it is ∼36%. In Ni-CGO case, the variation is again higher in the initial area: ∼32% inlet vs. ∼26% outlet. Indeed, the reaction develops above all in the first cell sections working in co-flow feeding configuration, so more relevant gas composition changes occurring favour a faster polarization decrease. Looking at ohmic terms, a minor gradient characterises this loss (Figures 10C,D). In ASC configuration, the variation is quite negligible due to small values measured, while it is worthy that a difference of 0.01 V occurs between ESC inlet and outlet section. The fuel utilization profiles are quite similar as represented in Figure 10E. The conversion rate along the flow direction is comparable in two configurations, which differ mainly in terms of the available power.
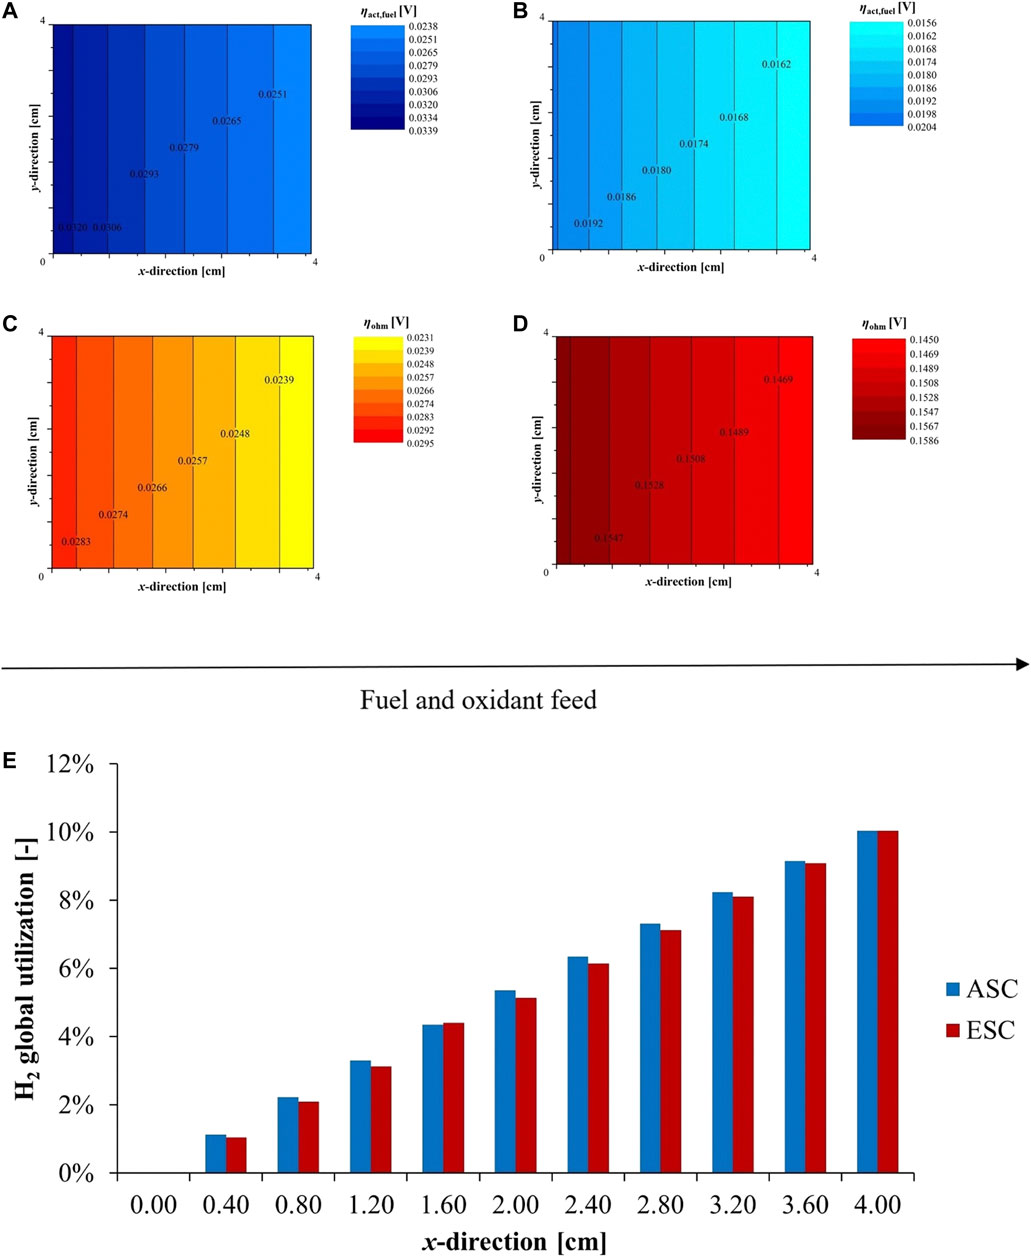
FIGURE 10. Local cell performance feeding 80/20 H2/H2O mixture and dry air at 800°C - (A) ASC and (B) ESC activation overpotential at fuel electrode, (C) ASC and (D) ESC ohmic overpotential–and (E) H2 cumulative conversion along flow direction according to SIMFC outcomes.
Through local maps at 800°C (Figure 10A–D) and 850°C (Figure 11), specific thermal dependences are underlined. Focusing on ohmic overpotential, both cells have a reduction of losses, which is ∼38% for the ASC and only 27% for the ESC due to its lower activation energy (Figure 5A). According to local analysis at 850°C, ηohm can decrease until ∼0.013 V at ASC outlet, whereas in ESC the minimum is ∼0.1 V (Figures 11C,D). Here, the Ni-YSZ based design results to be more temperature sensitive. Also, the activation contribution at ASC fuel electrode is slightly more influenced by temperature increase, indeed Ni-YSZ overpotential reduces by ∼38% moving from 800 to 850°C vs. by ∼32% in Ni-CGO (Figures 11A,B). All discussed outcomes are referred to cell nominal conditions, a further step will focus on degradation tests verifying for how long ASCs and ESCs can maintain a stable operation, in order to have a complete characterization of these two configurations and validate their use in industrial scale applications.
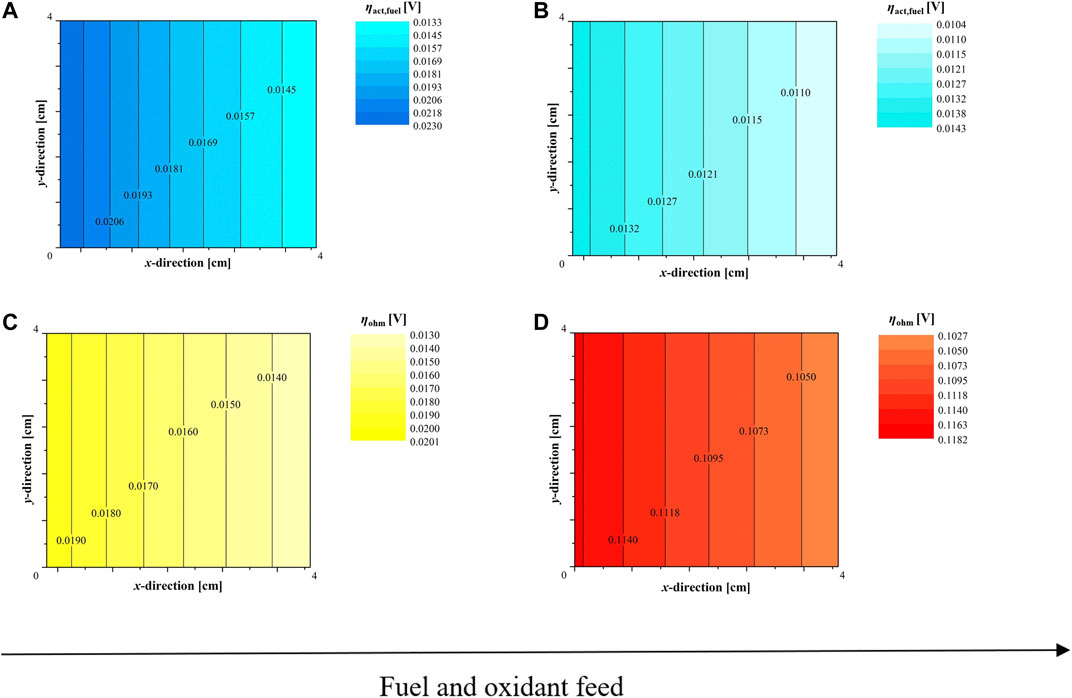
FIGURE 11. Local cell performance feeding 80/20 H2/H2O mixture and dry air at 850°C: (A) ASC and (B) ESC activation overpotential at fuel electrode, (C) ASC and (D) ESC ohmic overpotential according to SIMFC outcomes.
Two commercial SOFC configurations, anode and electrolyte supported cells, were compared through both experimental and theoretical approaches. The tested cell designs also differ in anodic material: Ni-YSZ and Ni-CGO. Experimental work performed in co-flow configuration on planar single cells consisted of a detailed characterization of the electrochemical performance through EIS spectra and I-V curves, providing the requested parameters for modelling. A 2D Fortran code, based on resolution of conservation equations on the cell plane, was developed to understand occurring phenomena during fuel cell operation at both global and local level. After successful model validation reaching 1% as average error, it was used to highlight the similarities and differences between 2 cell configurations. In ESCs the ohmic contribution to the total cell resistance was found to be the largest (>80%) owing to the thickness of the electrolyte being 10 times higher than in case of ASCs. Whereas the main resistance weight of ASC is correlated to the activation overpotential, which can overcome 55% in case of H2-rich feed mixture, resulting to be the triple of the value on the ESC. This mismatch is not only due to specific layer thicknesses, but it also most likely due to the material composition differences as confirmed by specific cell dependences on working parameters. Looking at the diffusion term, it is negligible for all tested working conditions in the ESC case, whereas it shows a major influence in ASC, above all at low water feeding content. In both designs, the current density increase reduces the activation resistance contribution at the expense of the ohmic resistance. Temperature variation evaluated in the range 800–850°C has a higher impact in the case of the ASC configuration due to higher activation energies of both ohmic and activation losses. Moreover, in such design the diffusion overpotential shows a higher contribution compared to ESC design. In terms of reactant composition changes, ASC end ESC show a positive influence of steam in hydrogen, as underlined by EIS spectra and I-V curve slopes. The studies on local maps provided more detailed information of polarization phenomena distributions. The analysis on the flow direction suggests similar conversion rates in both configurations; nevertheless, the same reactant composition gradients provoke a different evolution of overpotential contributions. For instance, a higher reduction of activation overpotential was observed between inlet and outlet sections in the ASC compared to the ESC confirming their different dependences on reactant composition. This local approach also allows for a better control of cell behaviour, aiding to identify possible causes of degradation distinguished across cell plane. This work has laid the bases for a forthcoming analysis focusing on long-term cell operation, where the validated modelling approach will be improved by introducing time influence on kinetic parameters.
The original contributions presented in the study are included in the article/Supplementary Material, further inquiries can be directed to the corresponding author.
AP and FB contributed to the conceptualization of the study. AP and AH performed the formal analysis and data investigation. FB and BB proposed the modelling methodology and developed the simulation softwares. AP and FB wrote the original draft. All authors contributed to manuscript revision, read, and approved the submitted version.
The research leading of these results has received funding from the European Horizon 2020—Research and Innovation Framework program (H2020-JTI-FCH-2018-1) under grant agreement n°825027 (AD ASTRA project).
The authors declare that the research was conducted in the absence of any commercial or financial relationships that could be construed as a potential conflict of interest.
All claims expressed in this article are solely those of the authors and do not necessarily represent those of their affiliated organizations, or those of the publisher, the editors and the reviewers. Any product that may be evaluated in this article, or claim that may be made by its manufacturer, is not guaranteed or endorsed by the publisher.
The Supplementary Material for this article can be found online at: https://www.frontiersin.org/articles/10.3389/fenrg.2021.668964/full#supplementary-material
act, Activation; ADIS, Analysis of Difference in Impedance Spectra; air, Air electrode; al, Active layer; ASC, Anode Supported Cell; bulk, Bulk value; CGO, Cerium Gadolinium Oxide; diff Diffusion; DPB, Double Phase Boundary; DRT, Distribution of Relaxation Times analysis; ECM, Equivalent Electric Circuit Model; EIS, Electrochemical Impedance Spectroscopy; ESC, Electrolyte Supported Cell; exp, Experimental; fuel, Fuel electrode; LSCF, Lanthanum Strontium Cobalt Ferrite; OCV, Open Circuit Voltage; ohm, Ohmic; sim Simulated; SIMFC, SIMulation of Fuel Cells; sl, Support layer; SOFC, Solid Oxide Fuel Cell; TPB, Triple Phase Boundary; YSZ, Yttrium Stabilized Zirconia.
Aguiar, P., Adjiman, C. S., and Brandon, N. P. (2004). Anode-Supported Intermediate Temperature Direct Internal Reforming Solid Oxide Fuel Cell. I: Model-Based Steady-State Performance. J. Power Sourc. 138 (1–2), 120–136. doi:10.1016/j.jpowsour.2004.06.040
Amiri, A., Vijay, P., Tadé, M. O., Ahmed, K., Ingram, G. D., Pareek, V., et al. (2015). Solid Oxide Fuel Cell Reactor Analysis and Optimisation through a Novel Multi-Scale Modelling Strategy. Comput. Chem. Eng. 78, 10–23. doi:10.1016/j.compchemeng.2015.04.006
Anjaneya, K. C., Nayaka, G. P., Manjanna, J., Govindaraj, G., and Ganesha, K. N. (2013). Preparation and Characterization of Ce1−xGdxO2−δ (x=0.1-0.3) as Solid Electrolyte for Intermediate Temperature SOFC. J. Alloys Comp. 578, 53–59. doi:10.1016/j.jallcom.2013.05.010
Athanasiou, M., Niakolas, D. K., Bebelis, S., and Neophytides, S. G. (2020). Steam Effect on Gerischer Impedance Response of a Ni/GDC|YSZ|LSM Fuel Cell/Anode. J. Power Sourc. 448, 227404. doi:10.1016/j.jpowsour.2019.227404
Audasso, E., Bianchi, F. R., and Bosio, B. (2020). 2D Simulation for CH4 Internal Reforming-SOFCs: An Approach to Study Performance Degradation and Optimization. Energies 13 (16), 4116. doi:10.3390/en13164116
Audasso, E., Nam, S., Arato, E., and Bosio, B. (2017). Preliminary Model and Validation of Molten Carbonate Fuel Cell Kinetics under Sulphur Poisoning. J. Power Sourc. 352, 216–225. doi:10.1016/j.jpowsour.2017.03.091
Barfod, R., Koch, S., Liu, Y.-L., Larsen, P. H., and Hendriksen, P. V. (2003). Long-Term Tests of DK-SOFC Cells. ECS Proc. Vol. 2003-07 (7), 1158. doi:10.1149/200307.1158PV
Bessler, W. G. (2006). Gas Concentration Impedance of Solid Oxide Fuel Cell Anodes. J. Electrochem. Soc. 153 (8), A1492. doi:10.1149/1.2205150
Bessler, W. G., Vogler, M., Störmer, H., Gerthsen, D., Utz, A., Weber, A., et al. (2010). Model Anodes and Anode Models for Understanding the Mechanism of Hydrogen Oxidation in Solid Oxide Fuel Cells. Phys. Chem. Chem. Phys. 12 (42), 13888. doi:10.1039/c0cp00541j
Bessler, W., Warnatz, J., and Goodwin, D. (2007). The Influence of Equilibrium Potential on the Hydrogen Oxidation Kinetics of SOFC Anodes. Solid State Ionics 177 (39–40), 3371–3383. doi:10.1016/j.ssi.2006.10.020
Bianchi, F. R., Baldinelli, A., Barelli, L., Cinti, G., Audasso, E., and Bosio, B. (2020a). Multiscale Modeling for Reversible Solid Oxide Cell Operation. Energies 13 (19), 5058. doi:10.3390/en13195058
Bianchi, F. R., Bosio, B., Baldinelli, A., and Barelli, L. (2020b). Optimization of a Reference Kinetic Model for Solid Oxide Fuel Cells. Catalysts 10 (1), 104. doi:10.3390/catal10010104
Bianchi, F. R., Spotorno, R., Piccardo, P., and Bosio, B. (2020c). Solid Oxide Fuel Cell Performance Analysis through Local Modelling. Catalysts 10 (5), 519. doi:10.3390/catal10050519
Blennow, P., Hjelm, J., Klemenso̸, T., Persson, A., Brodersen, K., Srivastava, A., et al. (2019). Development of Planar Metal Supported SOFC with Novel Cermet Anode. ECS Trans. 25 (2), 701–710. doi:10.1149/1.3205585
Boigues-Muñoz, C., Pumiglia, D., McPhail, S. J., Santori, G., Montinaro, D., Comodi, G., et al. (2015). More Accurate Macro-Models of Solid Oxide Fuel Cells through Electrochemical and Microstructural Parameter Estimation - Part II: Parameter Estimation. J. Power Sourc. 286, 321–329. doi:10.1016/j.jpowsour.2015.03.129
Bosio, B. (2003). Concentration Polarisation in Heterogeneous Electrochemical Reactions: A Consistent Kinetic Evaluation and its Application to Molten Carbonate Fuel Cells. J. Power Sourc. 115 (2), 189–193. doi:10.1016/S0378-7753(02)00729-2
Bowen, J. (2021). ManSeg. MATLAB Central File Exchange. Available at: https://www.mathworks.com/matlabcentral/fileexchange/75347-manseg (Accessed 01 17, 2021).
Brown, M., Primdahl, S., and Mogensen, M. (2000). Structure/Performance Relations for Ni/Yttria-Stabilized Zirconia Anodes for Solid Oxide Fuel Cells. J. Electrochem. Soc. 147 (2), 475. doi:10.1149/1.1393220
Buffo, G., Ferrero, D., Santarelli, M., and Lanzini, A. (2020). Energy and Environmental Analysis of a Flexible Power-To-X Plant Based on Reversible Solid Oxide Cells (RSOCs) for an Urban District. J. Energ. Storage 29, 101314. doi:10.1016/j.est.2020.101314
Conti, B., Bosio, B., McPhail, S. J., Santoni, F., Pumiglia, D., and Arato, E. (2019). A 2-D Model for Intermediate Temperature Solid Oxide Fuel Cells Preliminarily Validated on Local Values. Catalysts 9 (1), 36. doi:10.3390/catal9010036
Djamel, H., Hafsia, A., Bariza, Z., Hocine, B. M., and Kafia, O. (2013). Thermal Field in SOFC Fed by Hydrogen: Inlet Gases Temperature Effect. Int. J. Hydrogen Energ. 38 (20), 8575–8583. doi:10.1016/j.ijhydene.2013.01.004
Dubois, A., Ricote, S., and Braun, R. J. (2017). Benchmarking the Expected Stack Manufacturing Cost of Next Generation, Intermediate-Temperature Protonic Ceramic Fuel Cells with Solid Oxide Fuel Cell Technology. J. Power Sourc. 369, 65–77. doi:10.1016/j.jpowsour.2017.09.024
Dusastre, V., and Kilner, J. A. (1999). Optimisation of Composite Cathodes for Intermediate Temperature SOFC Applications. Solid State Ionics 126 (1–2), 163–174. doi:10.1016/S0167-2738(99)00108-3
Elmer, T., Worall, M., Wu, S., and Riffat, S. B. (2015). Emission and Economic Performance Assessment of a Solid Oxide Fuel Cell Micro-combined Heat and Power System in a Domestic Building. Appl. Therm. Eng. 90, 1082–1089. doi:10.1016/j.applthermaleng.2015.03.078
Feng, Z. A., El Gabaly, F., Ye, X., Shen, Z.-X., and Chueh, W. C. (2014). Fast Vacancy-Mediated Oxygen Ion Incorporation across the Ceria-Gas Electrochemical Interface. Nat. Commun. 5 (1), 4374. doi:10.1038/ncomms5374
Ferkhi, M., and Yahia, H. A. (2016). Electrochemical and Morphological Characterizations of La 2-x NiO 4±d (X = 0.01, 0.02, 0.03 and 0.05) as New Cathodes Materials for IT-SOFC. Mater. Res. Bull. 83, 268–274. doi:10.1016/j.materresbull.2016.06.009
Ghorbani, B., and Vijayaraghavan, K. (2018). 3D and Simplified Pseudo-2D Modeling of Single Cell of a High Temperature Solid Oxide Fuel Cell to Be Used for Online Control Strategies. Int. J. Hydrogen Energ. 43 (20), 9733–9748. doi:10.1016/j.ijhydene.2018.03.211
Graves, C. (2012). RAVDAV Data Analysis Software, Version 0.9. 7. Roskilde, Denmark: Technical University of Denmark.
Hauch, A., Jensen, S. H., Ramousse, S., and Mogensen, M. (2006). Performance and Durability of Solid Oxide Electrolysis Cells. J. Electrochem. Soc. 153 (9), A1741. doi:10.1149/1.2216562
Hauch, A., Mogensen, M., and Hagen, A. (2011). Ni/YSZ Electrode Degradation Studied by Impedance Spectroscopy - Effect of p(H2O). Solid State Ionics 192 (1), 547–551. doi:10.1016/j.ssi.2010.01.004
Hauck, M., Herrmann, S., and Spliethoff, H. (2017). Simulation of a Reversible SOFC with Aspen Plus. Int. J. Hydrogen Energ. 42 (15), 10329–10340. doi:10.1016/j.ijhydene.2017.01.189
Hosseini, S., Danilov, V. A., Vijay, P., and Tadé, M. O. (2011). Improved Tank in Series Model for the Planar Solid Oxide Fuel Cell. Ind. Eng. Chem. Res. 50 (2), 1056–1069. doi:10.1021/ie101129k
Irshad, M., Siraj, K., Raza, R., Ali, A., Tiwari, P., Zhu, B., et al. (2016). A Brief Description of High Temperature Solid Oxide Fuel Cell's Operation, Materials, Design, Fabrication Technologies and Performance. Appl. Sci. 6 (3), 75. doi:10.3390/app6030075
Iwanschitz, B., Sfeir, J., Mai, A., and Schütze, M. (2010). Degradation of SOFC Anodes upon Redox Cycling: A Comparison between Ni/YSZ and Ni/CGO. J. Electrochem. Soc. 157 (2), B269. doi:10.1149/1.3271101
Jensen, S. H., Hauch, A., Hendriksen, P. V., Mogensen, M., Bonanos, N., and Jacobsen, T. (2007). A Method to Separate Process Contributions in Impedance Spectra by Variation of Test Conditions. J. Electrochem. Soc. 154 (12), B1325. doi:10.1149/1.2790791
Jørgensen, M. J., Primdahl, S., and Mogensen, M. (1999). Characterisation of Composite SOFC Cathodes Using Electrochemical Impedance Spectroscopy. Electrochimica Acta 44 (24), 4195–4201. doi:10.1016/S0013-4686(99)00134-6
Kazempoor, P., and Braun, R. J. (2014). Model Validation and Performance Analysis of Regenerative Solid Oxide Cells for Energy Storage Applications: Reversible Operation. Int. J. Hydrogen Energ. 39 (11), 5955–5971. doi:10.1016/j.ijhydene.2014.01.186
Kooser, K., Käämbre, T., Vestli, M., Joost, U., Urpelainen, S., Kook, M., et al. (2020). Operando High-Temperature Near-Ambient Pressure X-Ray Photoelectron Spectroscopy and Impedance Spectroscopy Study of Ni − Ce0.9Gd0.1O2−δ Solid Oxide Fuel Cell Anode. Int. J. Hydrogen Energ. 45 (46), 25286–25298. doi:10.1016/j.ijhydene.2020.06.228
Kusnezoff, M., Trofimenko, N., Müller, M., and Michaelis, A. (2016). Influence of Electrode Design and Contacting Layers on Performance of Electrolyte Supported SOFC/SOEC Single Cells. Materials 9 (11), 906. doi:10.3390/ma9110906
Leah, R., Bone, A., Hammer, E., Selcuk, A., Rahman, M., Clare, A., et al. (2018). Proceedings of the 13th European SOFC & SOE Forum, Lucerne, Chap. 2, A0302, 13.
Leonide, A. (2010). “SOFC Modelling and Parameter Identification by Means of Impedance Spectroscopy,” in Schriften Des Instituts Für Werkstoffe Der Elektrotechnik, Karlsruher Institut Für Technologie (Karlsruhe: KIT Scientific Publishing), 18.
Linderoth, S. (2005). “Risø International Symposium on Materials Science, e Forskningscenter Risø, Solid State Electrochemistry,” in Proceedings of the 26th Risø International Symposium on Materials Science (Roskilde, Denmark: Risø National Laboratory), 4–8.
Luo, X. J., and Fong, K. F. (2016). Development of 2D Dynamic Model for Hydrogen-Fed and Methane-Fed Solid Oxide Fuel Cells. J. Power Sourc. 328, 91–104. doi:10.1016/j.jpowsour.2016.08.005
Lyu, Y., Xie, J., Wang, D., and Wang, J. (2020). Review of Cell Performance in Solid Oxide Fuel Cells. J. Mater. Sci. 55 (17), 7184–7207. doi:10.1007/s10853-020-04497-7
McPhail, S. J., Kiviaho, J., and Conti, B. (2017). The Yellow Pages of SOFC Technology, International Status of SOFC Deployment. Finland: VTT Technical Research Centre of Finland Ltd, P.O. Box 1000, 02044 VTT.
Minh, N. Q. (1993). Ceramic Fuel Cells. J. Am. Ceram. Soc. 76 (3), 563–588. doi:10.1111/j.1151-2916.1993.tb03645.x
Mogensen, M., and Lindegaard, T. (1993). “Kinetics of Hydrogen Oxidation on a Ni-YSZ SOFC Electrode at 1000°C. Solid Oxide Fuel Cells”,in Proc. 3rd Int. Symp. Honolulu (Pennington, NJ: Electrochemical Society), 484–493.
Ni, M. (2010). 2D Thermal-Fluid Modeling and Parametric Analysis of a Planar Solid Oxide Fuel Cell. Energ. Convers. Manag. 51 (4), 714–721. doi:10.1016/j.enconman.2009.10.028
Ni, M., Leung, M., and Leung, D. (2007). Parametric Study of Solid Oxide Steam Electrolyzer for Hydrogen Production. Int. J. Hydrogen Energ. 32 (13), 2305–2313. doi:10.1016/j.ijhydene.2007.03.001
Noren, D. A., and Hoffman., M. A. (2005). Clarifying the Butler–Volmer Equation and Related Approximations for Calculating Activation Losses in Solid Oxide Fuel Cell Models. J. Power Sourc. 152, 175–181. doi:10.1016/j.jpowsour.2005.03.174
Okamoto, H., Kawamura, G., and Kudo, T. (1983). Study of Oxygen Adsorption on Platinum through Observation of Exchange Current in a Solid Electrolyte Concentration Cell. Electrochimica Acta 28 (3), 379–382. doi:10.1016/0013-4686(83)85137-8
Primdahl, S., and Mogensen, M. (1998). Gas Conversion Impedance: A Test Geometry Effect in Characterization of Solid Oxide Fuel Cell Anodes. J. Electrochem. Soc. 145 (7), 2431–2438. doi:10.1149/1.1838654
Rao, M., Jensen, S. H., Sun, X., Hagen, A., and Mogensen, M. (2019b). Effect of Leaks in Solid Oxide Electrolysis Cells Tested for Durability under Co-electrolysis Conditions. World Acad. Sci. Eng. Tech. Int. J. Energ. Power Eng. 13 (4), 208–214. doi:10.5281/ZENODO.2643840
Rao, M., Jensen, S. H., Sun, X., and Hagen, A. (2019a). Unwinding Entangled Degradation Mechanisms in Solid Oxide Electrolysis Cells through Electrode Modifications and Impedance Analysis. Fuel Cells, fuce 19, 445–457. doi:10.1002/fuce.201800166
Rao, M., Sun, X., and Hagen, A. (2018). A Comparative Study of Durability of Solid Oxide Electrolysis Cells Tested for Co-electrolysis under Galvanostatic and Potentiostatic Conditions. J. Electrochem. Soc. 165 (10), F748–F755. doi:10.1149/2.0151810jes
Riegraf, M., Schiller, G., Costa, R., Friedrich, K. A., Latz, A., and Yurkiv, V. (2015). Elementary Kinetic Numerical Simulation of Ni/YSZ SOFC Anode Performance Considering Sulfur Poisoning. J. Electrochem. Soc. 162 (1), F65–F75. doi:10.1149/2.0471501jes
Riegraf, M., Yurkiv, V., Costa, R., Schiller, G., and Friedrich, K. A. (2017). Evaluation of the Effect of Sulfur on the Performance of Nickel/Gadolinium-Doped Ceria Based Solid Oxide Fuel Cell Anodes. ChemSusChem 10 (3), 587–599. doi:10.1002/cssc.201601320
Russner, N., Dierickx, S., Weber, A., Reimert, R., and Ivers-Tiffée, E. (2020). Multiphysical Modelling of Planar Solid Oxide Fuel Cell Stack Layers. J. Power Sourc. 451, 227552. doi:10.1016/j.jpowsour.2019.227552
Shen, S., Kuang, Y., Zheng, K., and Gao, Q. (2018). A 2D Model for Solid Oxide Fuel Cell with a Mixed Ionic and Electronic Conducting Electrolyte. Solid State Ionics 315, 44–51. doi:10.1016/j.ssi.2017.11.028
Tang, S., Amiri, A., Vijay, P., and Tadé, M. O. (2016). Development and Validation of a Computationally Efficient Pseudo 3D Model for Planar SOFC Integrated with a Heating Furnace. Chem. Eng. J. 290, 252–262. doi:10.1016/j.cej.2016.01.040
Tanwar, K., Jaiswal, N., Kumar, D., and Parkash, O. (2016). Synthesis & Characterization of Dy and Ca Co-doped Ceria Based Solid Electrolytes for IT-SOFCs. J. Alloys Comp. 684, 683–690. doi:10.1016/j.jallcom.2016.05.223
Thaler, F., Nenning, A., Bischof, C., Udomsilp, D., de Haart, L. G. J., Opitz, A. K., et al. (2019). Optimized Cell Processing as the Key of High Electrochemical Performance of Metal-Supported Solid Oxide Fuel Cells. ECS Trans. 91, 887. doi:10.1149/09101.0887ecst
Thyden, K. (2008). Microstructural Characterization of SOFC Ni–YSZ Anode Composites by Low-Voltage Scanning Electron Microscopy. Solid State Ionics 178 (39–40), 1984–1989. doi:10.1016/j.ssi.2007.12.075
Tsipis, E. V., and Kharton, V. V. (2008). Electrode Materials and Reaction Mechanisms in Solid Oxide Fuel Cells: A Brief Review: I. Performance-Determining Factors. J. Solid State. Electrochemistry 12 (9), 1039–1060. doi:10.1007/s10008-007-0468-0
Tucker, M. C. (2010). Progress in Metal-Supported Solid Oxide Fuel Cells: A Review. J. Power Sourc. 195 (15), 4570–4582. doi:10.1016/j.jpowsour.2010.02.035
Udomsilp, D., Thaler, F., Menzler, N. H., Bischof, C., de Haart, L. G. J., Opitz, A. K., et al. (2019). Dual-Phase Cathodes for Metal-Supported Solid Oxide Fuel Cells: Processing, Performance, Durability. J. Electrochem. Soc. 166, F506. doi:10.1149/2.0561908jes
Vogler, M., Bieberle-Hütter, A., Gauckler, L., Warnatz, J., and Bessler, W. G. (2009). Modelling Study of Surface Reactions, Diffusion, and Spillover at a Ni/YSZ Patterned Anode. J. Electrochem. Soc. 156 (5), B663. doi:10.1149/1.3095477
Williams, M. C., Vora, S. D., and Jesionowski, G. (2020). Worldwide Status of Solid Oxide Fuel Cell Technology. ECS Trans. 96 (1), 1–10. doi:10.1149/09601.0001ecst
Xia, L. N., He, Z. P., Huang, X. W., and Yu, Y. (2016). Synthesis and Properties of SmBaCo2−xNixO5+δ Perovskite Oxide for IT-SOFC Cathodes. Ceramics Int. 42 (1), 1272–1280. doi:10.1016/j.ceramint.2015.09.062
Yoon, K. J., and Gopalan, S., (2009). Analysis of Electrochemical Performance of SOFCs Using Polarization Modeling and Impedance Measurements. J. Electrochem. Soc. 156 (3), B311. doi:10.1149/1.3046158
Zabihian, F., and Fung, A. S. (2017). Macro-Level Modeling of Solid Oxide Fuel Cells, Approaches, and Assumptions Revisited. J. Renew. Sust. Energ. 9 (5), 054301. doi:10.1063/1.5006909
Zekri, A., Herbrig, K., Knipper, M., Parisi, J., and Plaggenborg, T. (2017). Nickel Depletion and Agglomeration in SOFC Anodes during Long-Term Operation. Fuel Cells 17 (3), 359–366. doi:10.1002/fuce.201600220
Zhang, L., Jiang, S. P., He, H. Q., Chen, X., Ma, J., and Song, X. C. (2010). A Comparative Study of H2S Poisoning on Electrode Behavior of Ni/YSZ and Ni/GDC Anodes of Solid Oxide Fuel Cells. Int. J. Hydrogen Energ. 35 (22), 12359–12368. doi:10.1016/j.ijhydene.2010.08.067
Zitouni, B., Andreadis, G. M., Hocine, B. M., Hafsia, A., Djamel, H., and Mostefa, Z. (2011). Two-Dimensional Numerical Study of Temperature Field in an Anode Supported Planar SOFC: Effect of the Chemical Reaction. Int. J. Hydrogen Energ. 36 (6), 4228–4235. doi:10.1016/j.ijhydene.2010.07.141
A, B Kinetic orders for different reactants [-]
D Global diffusion coefficient [m2 s−1]
DM Molecular diffusion coefficient [m2 s−1]
DK Knudsen diffusion coefficient [m2 s−1]
E Initial voltage [V]
Eact Activation energy [J mol−1]
ET Reversible voltage [V]
F Faraday constant [C mol−1]
f Frequency [Hz]
J Current density [A m−2]
L Inductance in ECM [H]
N Specific molar flow rate [mol s−1 m−2]
n Charge number [-]
P Power [W]
p Pressure [atm]
Q Constant phase element in ECM [F]
R Resistance in ECM [Ω]
R Ideal gas constant [J mol−1 K−1]
T Temperature [K]
V Cell voltage under load [V]
Y Molar fraction [-]
x,y,z Spatial directions [m]
Z Impedance [Ω m2]
Greek letters
γ Pre-exponential coefficient [A m−2]
δ Thickness [m]
ε Pore fraction [-]
η Overpotential [V]
λ Sub-cell dimension [m]
ξ Tortuosity factor [-]
Keywords: solid oxide fuel cell, anode supported cell, electrolyte supported cell, fuel cell microstructure, local modelling, EIS analysis, semi-empirical kinetics
Citation: Padinjarethil AK, Bianchi FR, Bosio B and Hagen A (2021) Electrochemical Characterization and Modelling of Anode and Electrolyte Supported Solid Oxide Fuel Cells. Front. Energy Res. 9:668964. doi: 10.3389/fenrg.2021.668964
Received: 17 February 2021; Accepted: 09 September 2021;
Published: 27 September 2021.
Edited by:
Gianfranco Dell'Agli, University of Cassino, ItalyReviewed by:
Matencio Tulio, Federal University of Minas Gerais, BrazilCopyright © 2021 Padinjarethil, Bianchi, Bosio and Hagen. This is an open-access article distributed under the terms of the Creative Commons Attribution License (CC BY). The use, distribution or reproduction in other forums is permitted, provided the original author(s) and the copyright owner(s) are credited and that the original publication in this journal is cited, in accordance with accepted academic practice. No use, distribution or reproduction is permitted which does not comply with these terms.
*Correspondence: Fiammetta Rita Bianchi, ZmlhbW1ldHRhcml0YS5iaWFuY2hpQGVkdS51bmlnZS5pdA==
Disclaimer: All claims expressed in this article are solely those of the authors and do not necessarily represent those of their affiliated organizations, or those of the publisher, the editors and the reviewers. Any product that may be evaluated in this article or claim that may be made by its manufacturer is not guaranteed or endorsed by the publisher.
Research integrity at Frontiers
Learn more about the work of our research integrity team to safeguard the quality of each article we publish.