 Mar Pérez-Fortes
 Victoria He
 Arata Nakajo1
 Jürg Schiffmann
 François Maréchal
 Jan Van herle
- 1Group of Energy Materials (GEM), École Polytechnique Fédérale de Lausanne (EPFL), Sion, Switzerland
- 2Laboratory for Applied Mechanical Design, École Polytechnique Fédérale de Lausanne (EPFL), Neuchâtel, Switzerland
- 3Industrial Process and Energy Systems Engineering (IPESE), École Polytechnique Fédérale de Lausanne (EPFL), Sion, Switzerland
With a growing energy demand in a carbon-constrained society, fuels cells powered by renewable fuels, and specifically solid waste, are seen as interesting contributors to the energy portfolio. The alternative energy industry needs to reduce costs, enhance efficiency, and demonstrate durability and reliability to be economically feasible and attractive. This paper addresses biomass waste gasification in distributed energy systems, using a solid oxide fuel cell (SOFC) to produce electricity and heat. The potential and optimal plant efficiency and layout (i.e., anode off-gas (AOG) recirculation point via small-scale turbomachinery and heat exchanger network) are analyzed through a multi-stage approach that includes scenario evaluation and multi-objective optimization via a hybrid optimization strategy with heuristics and mathematical programming. The results in this paper summarize the most convenient operating conditions and provide an optimized heat exchanger network (HEN). The AOG recirculation toward the gasifier combustor is the preferred option; the electrical and thermal efficiencies can separately go up to 49 and 47%, respectively. The combined total efficiency ranges between 76 and 82%, and the area of heat exchange, which corresponds to an amount of heat exchanged between 91 and 117 kW, is within 6–14 m2.
Introduction
Two important issues that current and future societies must address are energy demand and waste disposal. In this context, the deployment of renewable and waste-derived energy sources could reduce emissions and secure energy access by diversifying supply. Among the waste streams that are available, organic wastes are quite amenable to pre-treatment and further use in biomass-based processes to produce electricity and/or heat. The traditional scheme for electricity production uses large and centralized power plants that inject electricity to the grid. Renewable and locally available sources such as biomass waste are better matched to distributed energy systems, which should be properly designed to cope with population needs and disposable residue resources and their geographical location. The dispersed production and relatively low energy density of waste streams may not allow them to be transported over long distances or aggregated sufficiently for use in central power generation unless co-fired with traditional fuels. In addition, population needs may involve rural development or electricity injection to the grid that is required to alleviate the pressure on large fossil fuel power plants.
In Doty and Turner (2009), the term “distributed generation” (for complete independence from a centralized grid) refers to the generation of combined heat and power (CHP) ranging from several kW’s to 25 MWe. Decentralization of energy production is part of the new energy generation measures, and CHP, for instance, for domestic applications and low dense areas, is an efficient option being explored for at least 20 years (Smith and Few, 2001; Schneider et al., 2021). In particular, Cockroft and Kelly (2006) and Thiers et al. (2010) identified small fuel cell (FC) stationary installations (called “micro-CHP”) that can produce power up to 50 kWe, while large stationary FC systems can be well over 100 kWe in size. Technologies that compete with FCs at a distributed generation scale of power and/or heat include reciprocating engines, Stirling engines, steam engines, air source heat pumps, photovoltaics, wind turbine systems, and micro-gas turbines. Fuel cell systems comprise the lowest pollutant emissions and highest electrical efficiency options for fueled and dispatchable distributed generation. Stationary FC and biomass gasification systems are seen as more efficient and cleaner options than traditional technologies that can address the combined need to re-use residues while producing electricity and heat (Cottrell et al., 2011).
Biomass as Raw Material
A portfolio of technologies has been advanced to convert biomass into electricity and/or heat. The conversion technology selected depends on the composition and amount of the resource, the desired final product, environmental standards, and economic and project-specific conditions (Faaij, 2006). Mainly, methane- and hydrogen-rich gases can be used most directly in an FC system. The challenging fuels are solid waste and biomass fuels that require additional processes to be used in combination with the FC, such as gasification, pyrolysis, digestion, and fermentation. These processes can produce syngas or producer gas, pyrolysis gas, biogas, and/or ethanol that can each be used in the FC system. Recent research works refer to other bio-hydrogen production concepts that are still in their infancy, such as light-dependent methods of bio-photolysis and photo-fermentation and dark fermentation and water–gas shift (WGS) reaction mediated by photoheterotrophic bacteria. These methods consume CO2 and mainly use organic waste as the raw material (Kapdan and Kargi, 2006; Kothari et al., 2012). All biomass raw materials need some form of pre-treatment process that depends upon fuel properties to accommodate the inlet material to the processing conditions. The main challenges in the biomass gasification field are tar formation and ash reactivity. A thermochemical treatment option such as gasification followed by FC conversion can both destroy pathogenic bacteria from waste and produce a gas amenable to an electricity generation process.
Fuel Cells for Co-Generation
Current stationary FC systems transform hydrogen-rich gaseous fuels by an electrochemical reaction producing electricity. The hydrogen-rich gaseous fuel can be produced from natural gas, coal, and/or biomass, via steam reforming, partial oxidation or gasification, pyrolysis, digestion, fermentation, etc. Fuel cell systems can incorporate internal fuel processing components that provide flexibility to the inlet raw fuel stream. Most current systems are designed to directly operate on natural gas and anaerobic digester gas combined with gas cleanup. Additional hardware is usually required to operate on other fuels such as ethanol, methanol, landfill gas, or other biomass and biogas fuels. Pure hydrogen storage, transportation, and delivery from centralized production is of special concern in terms of 1) the need for a well-established pipeline and/or tractor–trailer networks to secure fuel supply, 2) storage challenges associated with low volumetric energy density, and 3) pumping, transmission, and distribution losses (Dougherty et al., 2009). Onsite hydrogen production and use may overcome these challenges as a short-term solution. Even if an FC can achieve an electrical efficiency greater than 60% (Doherty et al., 2009), if it requires pure hydrogen, then hydrogen production and distribution may negatively influence the whole supply chain and life cycle efficiency depending upon the used feedstock supply, transformation processes, and distribution processes. While integrated high-temperature FC systems can directly operate on natural gas and most biogases, significant challenges in the FC domain include the development of proper materials to bear high temperatures, and integrated operation on biomass-derived fuels in a plant, while increasing cell and stack durability. The selected FC type in this work is a solid oxide fuel cell (SOFC), which, due to its tolerance to CO and CO2 and high operating temperatures, is well suited for integration with gasification. To date, only a small number of biomass gasification systems in combination with an SOFC have been demonstrated in small scale (Ud Din and Zainal, 2016; Radenahmad et al., 2020).
SOFC Systems and Anode Off-Gas Management
SOFCs are generally implemented in co-generation plants and hybrid (or combined cycle) power plants and for transportation applications. The system efficiency, operating range, and behavior vary depending on the fuel type, energy management, and auxiliary equipment. System studies are therefore of great interest, with investigations using a plurality of approaches such as numerical simulations, experimental analyses, and multi-objective optimizations.
An SOFC is a good candidate to integrate into CHP systems, as the SOFC can provide both electricity and heat, namely, the waste heat from exothermic reactions and from utilization of the high-temperature exhaust gases [anode off-gas (AOG) and cathode off-gas (COG)]. For the latter, the AOG and COG are commonly fed into a burner downstream of the SOFC (AOG containing reactive gases) to generate heat. SOFC-CHP systems are therefore suitable for energy supply at small scale and micro-scale. The overall efficiency (electricity and heat) can reach up to 85–90%. Typical components of SOFC-CHP systems are a gas-cleaning unit, a fuel processor (e.g., steam reformer), an SOFC module, heat exchangers (HEXs), and pressure rise units as well as a DC–AC converter. Heat sinks in SOFC systems are typically fuel and air preheaters, the reformer, and, if existing, also the steam generator and other heat-exchanging units (Choudhury et al., 2013; Buonomano et al., 2015). The selection of an SOFC plant layout therefore depends on different design parameters, such as the operating temperature and pressure of the SOFC stack (pressurized or ambient), the fuel type and necessary fuel-processing units (e.g., internal or external reforming), heat supply for reforming and/or for other heat sinks (e.g., via heat recovery or fuel burning), or the steam production method (e.g., through AOG recirculation or external steam generation).
Appropriate off-gas management is of high importance to the overall system efficiency and operation safety and has to be taken into account for the SOFC system design. Generally, the off-gas at the SOFC outlet has high temperatures between 725 and 850°C. The AOG is also high in steam and CO2 content, as they are the main products of the electrochemical reactions. Other components are H2, CO, and unreacted educts or fuel gases. Those characteristics make the AOG very suitable for heat recovery, recirculation, or integration into downstream processes. As previously mentioned, the AOG and COG can be burned for heat generation and recovery, or for electricity generation in a downstream micro-gas turbine (Brayton cycle). Another possibility is to recirculate part of the AOG back toward the reformer and stack inlet using turbomachinery or an ejector. AOG recirculation was first implemented by Siemens-Westinghouse in an SOFC-GT system (Hassmann, 2001). The main motivation for AOG recirculation is the coverage of the reformer steam demand by the steam content in the recirculated AOG, omitting the need for external steam supply. This way, the overall system efficiency and simplicity can be improved (Hassmann, 2001; Halinen et al., 2012). In addition, both the recirculated CO2 and H2O mitigate the risk for carbon deposition at the SOFC stack inlet (Colpan et al., 2007). Another commonly mentioned reason for AOG recirculation is its potential to increase the electrical output of the stack by recirculating unreacted fuel back to the inlet, hence “increasing the overall fuel utilization” (Dietrich et al., 2011; Peters et al., 2013; Engelbracht et al., 2015; Torii et al., 2016). However, there is a trade-off, as recirculating the AOG can also lead to fuel dilution and thus negatively impact the stack performance, depending on the fuel type, system layout, and operating conditions (Lee et al., 2011; Rokni, 2017).
AOG recirculation and integration is currently not predominantly applied in commercial SOFC-CHP systems, as most of the AOG is thermally converted for heat generation. However, positive effects of AOG recirculation and integration in small-scale SOFC-CHP systems have been determined via modeling activities (Zhang et al., 2017; Park et al., 2019), showing the potential and need for further investigations and experimental realizations of AOG integration in SOFC-CHP systems.
In SOFC systems, turbomachinery can be used either as auxiliary systems (e.g., air blower) or to enhance the performance of the system (e.g., AOG recirculator in SOFC-CHP systems and micro-gas turbine for additional power production in SOFC-GT hybrid systems). Here, the focus of turbomachinery lies on the recirculator, as the general goal of the current work is to improve the performance of SOFC systems to make them more attractive and competitive with existing power generation solutions. There are currently only few commercial small-scale gas-bearing–supported turbomachinery systems available, which are suitable for SOFC applications.
The current work focuses on the design of an innovative, highly efficient, and fuel-flexible micro-CHP plant that uses biomass waste as the raw material, and an SOFC to produce electricity and heat, with AOG recirculation. The purpose is to support the design of a pilot plant within the framework of the EU H2020 project BLAZE (Biomass Low cost Advanced Zero Emission small-to-medium scale integrated gasifier-fuel cell combined heat and power plant) via process flow modeling and multi-objective (MO) optimization. The results of the current work will be used within the framework of the project to further propose the Bio-SOFC pilot plant process flow diagram (PFD). The results in this paper summarize the most convenient operating conditions and provide an optimized heat exchanger network (HEN). Future research will focus on the role of the recirculator with regard to the SOFC performance and the turbomachinery specificities. Hazelnut shells were preferred in the BLAZE project among different types of residual feedstocks to be used as the raw material. Fifteen types of residual biomass were selected and analyzed based on their availability, physical and chemical properties, and selling and transportation costs. Hazelnut shells were cleaner compared to the other biomass types: lower ash content (1–2%), lower chlorine and sulfur contents, lower moisture content (below 10%), and an adequate shape for gasification (as obtained from the local area where the pilot plant is based in the Abruzzo region at the center of Italy)1.
Novelty
The current work is a step forward toward the construction of a novel and highly efficient bio-waste-based gasification plant combined with an SOFC, at a pilot scale of 25 kWe. The boundaries of the study are placed at the pilot plant. The aim is to achieve an overall 90% of plant combined efficiency (50% of electric efficiency, 40% of thermal efficiency). As a reference, small biomass gasification CHP plants using downdraft gasifiers (10–200 kWe), and small-to-large scale systems using fluidized bed gasifiers (up to 1000 kWe) coupled with gas engines, have electric efficiencies of up to 25% and combined efficiencies of up to 80% (Bocci et al., 2014). The presented layout counts with a slightly pressurized gasifier, hot syngas–cleaning units, and the AOG recirculated via small-scale turbomachinery. This turbomachinery will use steam produced within the plant. The hybrid optimization approach uses a combination of an evolutionary algorithm and mathematical modeling to find the most suitable plant layout and working conditions to reach the target plant efficiency, which can be applied to any other process.
Process Description
The Bio-SOFC plant uses a dual bubbling fluidized bed gasifier (DBFBG), where steam gasification is separated from combustion, and an SOFC large stack module (LSM) as main technologies. It gasifies biomass waste to produce electricity, at the selected scale of 25 kWe, and steam. The DBFBG includes ceramic filter candles filled with commercial Ni-catalyst pellets (thus, hot gas cleaning) for particle removal and decomposition of tar and ammonia (Savuto et al., 2019). The heat is transferred from the combustion to the gasification reactor by a sand bed, which acts as a heat carrier (for instance, olivine). Flue gas is produced in the combustor and can act as a heat source in the plant (not only for the gasification process). The hot gas–cleaning units (GCUs), including chloride and sulfur compound separators and tar reformer, together with the previously mentioned catalytic filter candles at the outlet of the gasification chamber, are crucial. They keep the levels of slow tars, fast tars, and sulfur, halogen, and alkali compounds low, to avoid carbon deposition, fouling, and corrosion, specifically as needed by the SOFC LSM. The heat of the gasification process, in the current pilot gasifier, is provided by burning LPG and residual char from gasification in the gasification–combustion reactor. One of the purposes of the current design work is to elucidate the conditions under which the amount of LPG can be minimized, so as to produce electricity completely free (or with minimal use) of fossil fuels.
The syngas stream moves toward the GCU, after some cooling. The clean syngas is then preheated to the required SOFC LSM inlet temperature. The air supply to the gasifier and the fuel cell is controlled by two blowers; both streams are preheated to the desired gasification and fuel cell temperatures. The temperature gradient across the SOFC module is a critical design parameter that is tightly controlled. This determines the mass flowrate of the cathodic air. The COG, before being released, is used to produce hot water. See a simplified block flow diagram (BFD) of the Bio-SOFC plant in Figure 1, pointing out the three AOG recirculation options specified hereafter. The turbomachinery, a fan turbine unit (FTU), aims to use the AOG in the Bio-SOFC plant through the best layout configuration, by consuming steam produced in the system. The three main locations where the AOG can be recirculated are 1) the SOFC LSM anode inlet, 2) the gasifier combustor, and 3) the biomass gasification chamber. The main inlet streams are biomass, water, and air; the main outlet streams are flue gas, COG, AOG, hot water, and steam (when produced by heat integration).
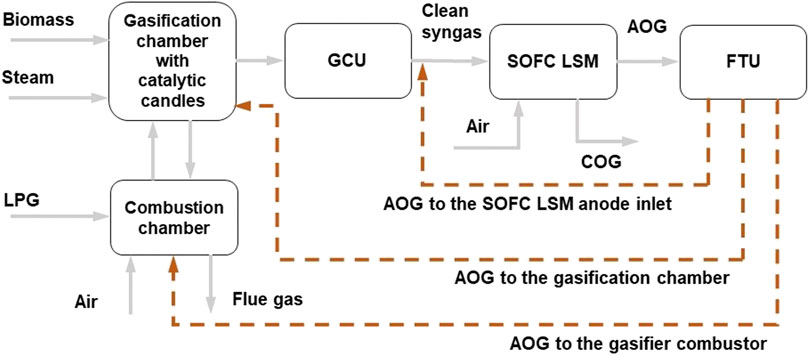
FIGURE 1. Simplified block flow diagram of the Bio-SOFC plant, pointing out the three recirculation options evaluated. GCU: gas-cleaning units, LSM: large stack module, FTU: fan turbine unit, AOG: anode off-gas, COG: cathode off-gas, and LPG: liquefied petroleum gas.
The gasifier and the SOFC LSM have to meet specific pressure conditions. In order to use a pressurized gasifier in the Bio-SOFC plant, an ad hoc screw feeder is needed, which has to be appropriately designed to avoid inner hot gas to flow back in the feeder, pyrolyzing inlet biomass. In the SOFC LSM, the anode pressure should always be above the cathode pressure, in a range of 5–30 mbar; it should ideally operate above atmospheric pressure. The maximum absolute pressure that the cathode can tolerate is 1.09 bar. Pressure management in the overall plant affects the design of the FTU, as the recirculation pressure can change and depends on the recirculation point. Table 1 summarizes the pressure losses per unit in the Bio-SOFC plant. Table 2 summarizes the conditions or constraints that the Bio-SOFC plant should meet. These conditions, as explained in Methodology, are checked via filtering in the MO optimization approach.
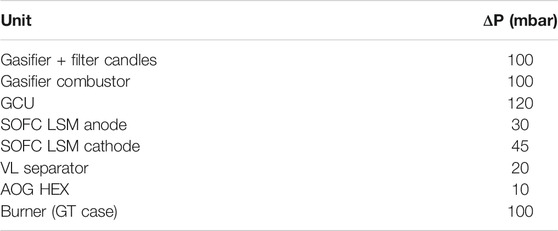
TABLE 1. Pressure losses per unit in the Bio-SOFC plant (consortium data). VL: vapor–liquid.
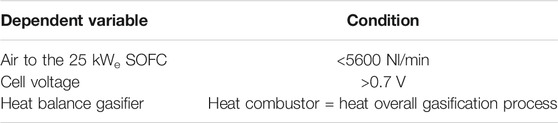
TABLE 2. Constraints, i.e., range of Bio-SOFC plant modeling values that have to be met (consortium data).
Methodology
A systematic approach is used to evaluate several candidate design options of the Bio-SOFC plant (named here “scenarios”) and to identify the optimal system configurations. System modeling, optimization, and sensitivity analysis are used as evaluation tools. The methodology can be divided into two steps:
1. Scenario evaluation. The six scenarios defined take into account the three possible recirculation points, i.e., 1) AOG to the SOFC LSM anode inlet, 2) AOG to the gasifier combustor, and 3) AOG to the gasification chamber (see Figure 1), the use of an AOG gas turbine (GT), the possibility of not taking advantage of the AOG calorific value, and the option of not using the FTU for recirculation, but a conventional blower.
2. MO optimization. In the scenario evaluation step, one plant layout is selected for optimization. The results of the current step indicate the advised operating conditions from a list of decision variables, and the HEN of the Bio-SOFC plant, according to selected conflictive objectives: electrical and thermal efficiencies (Effel and Effth) and area of heat exchange. Theoretically, the electrical and thermal efficiencies will increase, if the area of heat exchange (cost) increases. The thermal efficiency will decrease, if the available heat is used to generate electricity instead of producing steam.
Process simulation is used to solve the plant mass and energy balances of the Bio-SOFC plant, and it is the starting point of the scenario evaluation and of the process optimization. The selected performance indicators describe not only the objective functions but also all the different metrics considered in the scenario evaluation. Process optimization includes process simulation and process heat management, to elucidate the most suitable operating conditions and HEN for the Bio-SOFC plant, as these are highly influencing aspects of the process performance. See more details in the following paragraphs.
Process Simulation
The mass and energy balance calculations are performed in Aspen Plus V10 software. The Bio-SOFC plant model is zero-dimensional and at the steady state and uses the software in-built library models combined with ad hoc models coded in Fortran. In order to confirm the validity of the Bio-SOFC plant model along its operating conditions, specific technology experts were consulted within the project consortium to provide advice on model parameters, such as efficiencies. Otherwise, literature modeling data were used, as in the case of the gas turbine. The two most important units, the fluidized bed gasifier and the SOFC, were validated by comparison over a range of data that were contrasted with (gasifier model) and derived from (SOFC operation maps) experimental measurements.
In the scenario evaluation, heat integration is assessed by the calculation of the problem table (the feasible heat cascade) and its graphical representation, the grand composite curve (GCC), of the Bio-SOFC plant, at fixed inlet conditions. The problem table is solved in Excel (Kemp, 2007; Towler and Sinnott, 2013). It gives as a result the maximum energy recovery (MER), which is the minimum value of utilities needed.
In the optimization, heat integration is assessed by mixed integer linear programming (MILP) in AMPL (A Mathematical Programming Language, a specific modeling environment for the formulation and solution of mathematical programming models), where variable temperature levels and cooling/heating needs of the Bio-SOFC plant (calculated in the Aspen Plus model) are used as input data. The adapted “SYNHEAT temperature-stage” HEN superstructure of Yee and Grossmann (1990) in Martelli and co-workers (2017) is used in the optimization. The results pinpoint the most efficient combination of cold and hot streams by minimizing the number of connections.
The results of the scenario evaluation, i.e., a preferred layout and the essential trade-offs among the selected performance indicators, are the starting point of the optimization. As overall contextual conditions, it is assumed that inlet streams (air, water, biomass, LPG) are available at 25°C and 1.01325 bar.
Performance Indicators
The list of performance indicators below is used to evaluate the six selected scenarios.
The cold gas efficiency (CGE) calculates the performance of the gasifier by considering the lower heating value (LHV) of the involved streams—the syngas after the filter candles, in the numerator, and the inlet biomass, LPG, and AOG (when available, depending on the scenario) to the gasifier combustor, in the denominator:
where
The SOFC efficiency (EffSOFC) takes into account the gross SOFC LSM power produced (Pprod in kW), divided by the inlet fuel, which is the syngas after the GCU (when available, after AOG mixing):
The electrical efficiency (Effel) considers the net power produced in the system (that is, the gross power from the SOFC LSM Pprod minus the power consumed by the system’s compressors and pumps, in kW) divided by the total inlet calorific value into the system, provided by the biomass and LPG streams:
The thermal efficiency (Effth) considers the total amount of heat used to produce hot water at 1.01325 bar and 65°C (Qhw in kW) using the COG stream (from 140 to 50°C), the total amount of heat that is absorbed by the cold utility (Qcu in kW), which in this case is steam produced at 5 bar and 220°C (i.e., the steam conditions needed at the turbine of the FTU), and the thermal power consumed by the turbine of the FTU (Qturb in kW). It is therefore assumed that all the heat absorbed by the cold utility is used to generate steam with a commercial value (at 5 bar and 220°C), even after powering the turbine (at 2.5 bar and around 180°C):
The CHP performance, or total efficiency (Efftot), is the sum of Effel and Effth. Note that, in the Bio-SOFC plant, not only biomass (in the gasification reactor of the gasifier) but also LPG (in the combustion reactor of the gasifier) is used as a fuel. As mentioned before, one of the main purposes of the plant design is to decrease as much as possible the consumption of the LPG fossil fuel, so as to prioritize the production of renewable electricity.
The selected objective functions used in the optimization are as follows:
1. Effel
2. Effth
3. HEN area
The first two objectives are maximized; the last one is minimized. The HEN area is selected as a direct potential variable metric that influences the capital cost of the plant (as the main capital intensive units, sizes and characteristics of the SOFC LSM and gasifier are already fixed and are input conditions in the BLAZE project).
The heat integration problem determines the structure and design variables. The AMPL model solution specifies which cold and hot streams are connected with each other, specifically: 1) at which stage (as defined in the SYNHEAT superstructure), 2) the need for cold and/or hot utilities, 3) the inlet and outlet temperatures of each stream at every stage, and 4) the value of the exchanged heat (Qtotal in W). From this information, the HEN area is calculated as the sum of all the individual HEXs’ areas (Aex, in m2), as follows:
The calculation of the logarithmic mean temperature difference (LMTD) takes into account the inlet and outlet HEX temperatures of the hot (T) and cold (t) streams (Towler and Sinnott, 2013):
The calculation of the corrected overall heat transfer coefficient (Uoverall_cor, in W/m2°C) takes into account the film transfer coefficient of each pair of hot and cold streams (h, W/m2°C), as a simplification. The heat transfer coefficient is corrected by two factors: a factor of 0.95 that corresponds to a temperature adjustment (Towler and Sinnott, 2013) and a factor of 1.1 that accounts for 10% of area increase due to fouling (Green and Perry, 1999). The film transfer coefficients for each cold and hot stream of the process are estimated based on bibliographic data (non-exhaustive estimation):
Process Optimization
A sequential and systematic approach is used to design and optimize the Bio-SOFC plant. The present work adapts the multi-period approach described by Pérez-Fortes et al. (2019) to consider one unique period, and the queuing MO optimization (QMOO) algorithm is replaced by ev-MOGA, an elitist MO evolutionary algorithm developed by the Predictive Control and Heuristic Optimization Group (CPOH) at Universitat Politècnica de València (Spain), which is available via the MATLAB central file exchange (Herrero, 2020). Evolutionary algorithms are heuristic methods that base the optimization strategy on the exploration of the search space (defined by the decision variables and their range of variation); thus, they allow for the optimization of a non-linear and non-continuous system of equations. The sequential steps of the MO optimization methodology consist of 1) the calculation of the mass and energy balances, 2) the system energy integration, and 3) the evaluation of the performance indicators. The ev-MOGA constitutes the master or upper optimization level of the iterative solution process, with the subsequent steps 1), 2), and 3) acting as the slaves or within the lower optimization level. The algorithm is used to identify the most appropriate input values of the defined decision variables, which are varied according to the resulting values of the objective functions. Figure 2 outlines the main steps of the MO optimization methodology used in the current project. Ten relevant plant variables (see Input Data) are selected, and the three objective functions mentioned above (electrical and thermal efficiencies and the total HEX area) are considered. In an evolutionary algorithm, the constraints (or conditions that must be fulfilled) are not enforced but verified by filtering (last step before the loop). In the current project, four constraints are considered, according to SOFC requirements and the heat balance of the allothermal gasifier (see Input Data).
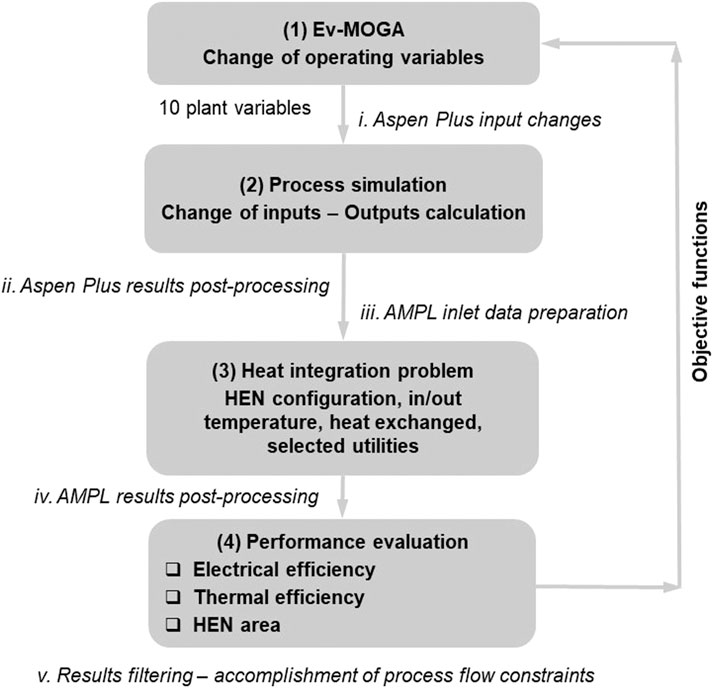
FIGURE 2. Sequential multi-objective optimization approach for the Bio-SOFC process and HEN design.
In order to keep the mathematical problem (heat management) linear (MILP), the approach considers the optimization of the design specifications (decision variables; among them, temperatures) at the ev-MOGA upper level and the calculation of the HEX areas at a lower level, after solving the optimal matching of streams using the AMPL simultaneous approach. The structure of the HEN is proposed via integer variables (binary), considering all the possible matches of hot and cold streams of a stage. The problem is linear by solving the superstructure arrangements: heat transfer flow and energy balances. MATLAB software is used to develop the needed routines for data pre- and post-processing (calculation of the objective functions, filtering, and communication between the software programs Aspen Plus and AMPL). The followed procedure complies with the OSMOSE structure (Industrial Process and Energy Systems Engineering Group, 2020), which is the optimization platform developed by the Industrial Process and Energy Systems Engineering (IPESE) group from EPFL.
As a result of the optimization, the Pareto fronts will allow the decision-maker to visualize the consequences of the selected choice, in terms of performance of one criterion at the expense of the others. Among the selected objectives, maximization of Effel and maximization of Effth are conflictive between them, as, in general, one increases if the other decreases (i.e., ideally, Effth = 1 – Effel). The third objective, the HEN area, acts as an economic criterion (capital cost), as the size of the pilot plant is fixed. In this specific case, the operating costs allocated to the utilities are not relevant to optimization, as a unique utility has been selected, the steam that can be used in the process or be sold into the market. In Selection of Optimum Designs, the selected non-dominated solutions reported correspond to the extremes of the Pareto frontier and to a weighted distance solution (Euclidean distance to the utopian point—0.4 of Effth and 0.5 of Effel, and the minimum HEN area found during the optimization).
Summarizing, the aim of the optimization is twofold: 1) to optimize the process design specifications and 2) to propose an HEN structure. This second point is further described in the next section.
Heat Management
The heat integration problem determines the structure and design variables (inlet and outlet temperatures and HEX areas) of the HEN. The procedure applied here uses as a starting point the work by Pérez-Fortes et al. (2019), which based its approach on the original works by Mian and co-workers (Mian et al., 2016; Martelli et al., 2017). The SYNHEAT algorithm from Martelli et al. (2017) was modified to take into account the multi-period optimization strategy from Mian et al. (2016) in Pérez-Fortes et al. (2019). The same sequential framework idea (upper/lower optimization levels) from Mian et al. (2016) is further adapted here, with different intermediate steps and different upper level algorithms and objective functions, and for a unique period. Another difference as well is that the minimum temperature difference between a hot and a cold stream (ΔTmin) is not considered for optimization but is given as input (30°C).
It was mentioned in Process Simulation that two different heat management approaches are used for the scenario evaluation and for the process optimization: pinch analysis and SYNHEAT superstructure, respectively. Pinch analysis using the problem table method was already proposed by Linnhoff and Hindmarsh (1983), where all the streams are combined within temperature intervals to provide a perfect process integration and the minimum external energy requirements. The graphical representation of the problem table is the GCC, and it is used here in Scenario Evaluation to analyze the heat management of the Bio-SOFC plant in general and to compare scenarios in particular (i.e., to estimate the cold utility needs).
The SYNHEAT superstructure is used to determine the HEN layout. It stands for the type of stream connection and overall outline, originally proposed by Yee et al. (1990). Parallel and series HEXs can be considered. It assumes constant heat capacities, constant heat transfer coefficients, counter-current HEXs, and isothermal mixers. The proposed representation stands for a “stage-wise” superstructure that allows for matching of different streams; within each stage, potential exchanges between hot and cold streams can happen. In the problem table based on the heat cascade, the number of stages is equal to the number of energy intervals (requiring a large number of exchangers) (Yee et al., 1990). In general, the number of stages will be lower than the maximum number of hot and cold streams, owing that an optimal and practical HEN design should not require a large number of HEXs (i.e., a particular stream should not exchange heat with many streams) (Yee et al., 1990). Overall, the minimum number of HEXs to install is usually the number of process streams and utilities, minus one (Linnhoff and Hindmarsh, 1983). Accordingly, in the current work, three stages have been selected. The total number of cold streams in our process is 4, the total number of hot streams is 8 (without considering the overall evaporation process of the steam needed for the FTU, as is included in the utility), and one utility is considered; the minimum number of HEXs to install is 12. Note that the evaporation process of the utility/steam generation may comprise three bodies—economizer, evaporator, and superheater (thus, for practical purposes, 14 HEXs is the minimum number). Moreover, not all the hot and cold streams can be combined among them; we take into account the forbidden match between air- and fuel-rich streams. As part of the algorithm developed by Martelli et al. (2017), also restricted matches and no-splitting streams are possible.
The Bio-SOFC plant results in a threshold problem, i.e., only requiring a cold utility (the plant produces enough heat for its own process consumption and still has excess of it). In the calculation of Effth, it is considered that all the system’s heat that needs to be released via the cold utility is used to produce steam at 5 bar and 220°C (i.e., the steam conditions needed at the turbine of the FTU). The scenario evaluation and the optimization differ in the following:
- In the scenario evaluation, the FTU is modeled, and its ad hoc steam needs and generation are taken into account for every considered layout.
- In the optimization, with the aim of being as flexible as possible with the Bio-SOFC plant possibilities, the FTU is not modeled, but the overall amount of steam produced (and which is available for the turbomachinery) is considered, via the SYNHEAT algorithm. Methodologically, inside step (3) in Figure 2, there is one more iteration, where the results of the AMPL model are read, and specifically, the cold utility needs are taken into account to calculate the specific amount of steam produced via an Aspen Plus model of an evaporator (therefore, there is a flow of information between AMPL and Aspen Plus). As a shortcut in the SYNHEAT algorithm (i.e., to calculate the area of heat exchange), the h value of the cold utility is the one of an evaporator (not distinguishing between the economizer, the evaporator, and the superheater). The specific turbine steam needs have been determined for only the selected Pareto cases. The use of a commercial blower to recirculate the AOG toward the combustor was modeled and evaluated. This device was included in the model used for optimization; with its power consumption, the impact of the flow and temperature of the AOG recirculation toward the combustor in the Effel is considered.
The AMPL MILP problem solves the minimum number of connections among streams using CPLEX, which is the MILP solver by IBM.
Process Modeling
The mass and energy balances are performed in Aspen Plus V10 software. The model uses the Peng–Robinson–Boston–Mathias property method, which applies the Peng–Robinson cubic equation of state with the Boston–Mathias alpha function for the calculation of the thermodynamic properties and steam tables. The model is zero-dimensional, and reactors and HEXs’ heat losses are neglected (except in the SOFC LSM). International system units are used.
Table 3 summarizes the selected cases for simulation and comparison, so as to conclude the final layout to be optimized. In these cases, biomass feedstock flow was adapted to produce, in each particular case, 25 kWe nominal in the SOFC LSM. Supplementary Table S1 summarizes the default operating conditions and modeling assumptions of the Bio-SOFC plant model. These correspond specifically to the modeling input in Cases 1 to 6. The details of each unit model are described in the following paragraphs.
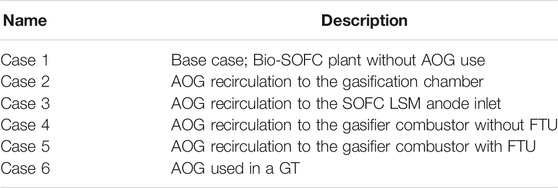
TABLE 3. Cases analyzed in Scenario Evaluation. Pressurized gasifier, not fixed HEN, global FU = 0.75, and, when present, VL separation at 20°C (see the corresponding Supplementary Figures S1–S6).
Fluidized Bed Gasifier
In the indirectly heated gasifier, the gasification chamber was modeled separated from the combustion chamber to take into account the heating needs (i.e., fuel needed) to have a balanced gasifier. The bibliographic sources used as a reference are Doherty et al. (2013) and Marcantonio et al. (2019). It is assumed that the gasifier works at 1.29325 bar, that it is isothermal (per separate gasifier chamber and combustion chamber), that char is 100% carbon, and that the overall heat needed in the gasification process (the steps that take place in the initial decomposition block, together with RStoic—N, S, and Cl compound formation, RYield—tar production, RGibbs—gasification, and RStoic that simulates the reactions in the filter candles) is provided by the gasifier combustor. The feeding system is not modeled.
The inlet streams to the gasifier are biomass waste, steam (to the gasification chamber), air, LPG (modeled as propane), and AOG in Cases 2–5 (to the combustion chamber). Internally, also a fraction of char, from the gasification process, is burnt into the combustor. The amount of biomass is controlled by a design specification block that varies the amount of inlet waste to reach a gross power output in the SOFC LSM of 25 kWe. Once the amount of biomass is calculated, the amount of inlet water (which is circulated via a pump and converted into steam in an evaporator—sum of the economizer, evaporator, and superheater) is calculated by a calculator block, reaching the specified steam-to-biomass ratio (STB) of 0.5. The amount of LPG is calculated by a design specification block, based on the balance of heat mentioned in the previous paragraph. The amount of inlet air to burn all the fuels in the combustor is calculated in a calculator block that considers a 1.12% excess of air.
The biomass stream, hazelnut shell, is modeled as an unconventional stream (non-conventional solid) that is converted into its elements (conventional components: carbon graphite, H2, N2, O2, S, Cl2, ash) via an RYield reactor (definition of component yields), which uses the ultimate analysis of the considered biomass type. A calculator block is defined for this purpose. Ash is also defined as a non-conventional solid. The decomposed stream goes to an RStoic reactor that simulates the production of H2S, HCl, and NH3 from the conversion of the overall amounts of N2, S, and Cl2:
Afterward, the char, inorganics, and volatiles are separated.
- 11% of char is separated and sent toward the gasifier combustor (consortium discussion), together with the ashes (Akhlas et al., 2015). The rest is divided into two streams: 92% going to the gasifier and 8% going to the tar production reactor (Marcantonio et al., 2019).
- The inorganics directly go to the mixing step, before the filter candles.
- The volatile stream, in turn, is also divided into two streams: the main one goes to the gasification block and a fraction of H2 that is used to produce tar to the tar production reactor.
Tar production, in an RGibbs reactor, considers the synthesis of toluene (C7H8), benzene (C6H6), and naphthalene (C10H8), as tar representatives, from H2 and C. The needed stoichiometric amount of H2 is calculated based on the following tar synthesis reactions and the aim of obtaining a molar proportion of 60% of benzene, 20% of naphthalene, and 20% of toluene:
The gasifier, whose inlet streams are steam, volatiles, and a little fraction of char, is modeled with RGibbs, a Gibbs free energy minimization reactor applying the restricted quasi-equilibrium approach via Data-Fit from experimental data, from Marcantonio et al. (2019). The gasification reactions are
The temperature approach for each reaction is −0.81°C, 1.09°C, −5.27°C, 1.12°C, and −233.4°C, respectively (Marcantonio et al., 2019). The last value has been adapted in the current model to adjust better to the results obtained from the gasifier model in MATLAB (first principle model developed for the existing gasifier). After the gasifier and the tar production, all separated streams are mixed (Marcantonio et al., 2019).
The gasifier combustor is modeled as an isothermal reactor with complete combustion. The inlet air is compressed and heated up to 400°C (600°C in Case 5) before entering the unit. The filter candles (described in the next section) are placed inside the gasifier. The temperature of the syngas going out of the gasifier takes into account this step; it is considered that the filter candles decrease the gasification temperature by 70°C. Before the filter candles, in the pilot plant reactor, there is an in-bed gas-cleaning step that uses calcined dolomite to adsorb tars, NH3, H2S, and HCl (Marcantonio et al., 2020). This reactor is not modeled in the current approach (taking into account that this unit does not have a significant contribution to the overall gasifier balance, i.e., mass—syngas composition—and energy balances, except for the contaminant separation), and as an alternative, the contaminants are assumed to be appropriately separated from the main syngas in the downstream GCU. The results of the model (before the filter candles) have been contrasted with the results of the MATLAB model (see Supplementary Table S2), with an acceptable agreement (with the larger discrepancy in CH4 composition estimation).
Gas-Cleaning Units
The gas-cleaning units in the Bio-SOFC plant include (Marcantonio et al., 2020) the in-bed gas cleaning by a calcined dolomite bed, the catalytic filter candles, the sorbent reactor that separates S compounds, the alkali-based sorbent reactor that separates Cl compounds, and the tar reformer.
As a simplification in the Bio-SOFC plant model, the syngas-cleaning units are the following:
- An RStoic reactor simulating the catalytic filter candles, where methane, toluene, benzene, and naphthalene react with water to produce CO and H2. These reactions are considered to take place at a temperature that is 70°C lower than the gasification temperature.
- Two heat exchangers that adapt the temperature to 400°C and 550°C, the two selected operating temperatures for S and Cl separation and for tar reforming, respectively.
- The HCl adsorber, H2S adsorber, and tar reformer that are simply modeled as a component separator that splits all the contaminants from the syngas before the SOFC LSM.
The following reactions take place in the catalytic filter candles, with the specified fractional conversions of methane (0.9), toluene (0.95), benzene (0.92), and naphthalene (0.9) (Marcantonio et al., 2020). These conversion factors belong to an STB of 0.5:
Solid Oxide Fuel Cell Large Stack Module
The SOFC LSM model compiles the modeling approaches in Van herle et al. (2003); EG and G Technical Services, I (2004); Doherty et al. (2009); Pérez-Fortes et al. (2019). In the selected pressurized gasifier configuration, and taking into account the pressure losses in Table 1, the anode inlet pressure is 1.07325 bar and cathode inlet pressure is 1.05825 bar. The model is 0D and considers that the inlet gases are heated to a temperature of 700°C, that the outlet temperature (AOG and COG) is 790°C, and that the electrochemical and chemical reactions occur at an average reactor temperature (calculated as an average of the inlet and outlet temperatures—i.e., 745°C with base conditions). The SOFC module is balanced: the outlet power is calculated (see below) and the heat that needs to be evacuated is the result of a heat balance. The model consists of an anode block that is modeled by two RGibbs reactors, one that simulates an internal reformer and another one, downstream the first one, which simulates the combustion step. Both of them, based on inlet species, calculate the phase and chemical equilibriums. Thus, the outlet gas composition is at equilibrium. The second RGibbs receives O2 from the cathode block, simulated as a component separator that splits O2 required for the electrochemical reaction. The streams that go out from the anode and cathode are mixed for the heat balance step. The AOG and COG are separated (knowing that all remaining O2 and N2 belong to the COG) after the heat balance step (downstream the second RGibbs). The heat loss for the LSM is 2.5 kW (Pérez-Fortes et al., 2019). The inlet amount of air is controlled via a design specification block to obtain the desired outlet temperature.
Given the local fuel utilization (FU), the model calculates the needed amount of O2 in the anode to perform the electrochemical reaction. Note that the local FU is 0.75 when no recirculation affecting the LSM is taking place. As a matter of comparison among the scenarios, a global FU of 0.75 has been fixed. The equivalent amount of H2 is calculated as in the equations below, considering the overall hydrogen reaction. H2(eq) comprises the inlet syngas H2 amount and the H2 quantity that could be produced from the syngas fractions of CO and CH4 by the water–gas shift and methane-reforming reactions. It is common to assume that CH4 is reformed and that CO is shifted to H2 and, therefore, that only H2 participates in the electrochemical reaction. To calculate O2 (needed) and the current density (J), the inlet syngas composition is taken into account:
The current (I) (“shortcut value” and not representative, as the current depends on the cell connection), current density, and voltage (Vmax or ideal) are calculated as follows (Van herle et al., 2003; EG and G Technical Services, 2004):
Here, z = 2 (number of electrons transferred) and F = Faraday’s constant = 96,485 C/mol.
The calculation of the ΔH and TΔS of the hydrogen oxidation reaction (W) accounts for the difference between the outlet and the inlet steam’s enthalpy and entropy values, to estimate the Gibbs free energy (ΔG):
The calculation of the ASR (Ω/cm2) considers the overall governing equations from Nakajo et al. (2011), simplified to be included in the current 0D model. It is composed by its activation, ohmic, and concentration loss terms. Therefore, the final power produced in the SOFC LSM takes into account the Vcell, which includes the potential losses. The calculated power is an input variable to the SOFC heat balance, as mentioned at the beginning of the section. The results of the SOFC LSM model have been contrasted with the values of an operation map provided by the company SOLIDpower (SP), as summarized in Supplementary Table S3.
Fan Turbine Unit
This unit is modeled using the compressor and turbine units from Aspen Plus. The (micro)steam turbine of the FTU has to provide all the power needed by the AOG fan, which indeed depends on the flowrate and the composition of the recirculated stream. Depending on the density of the recirculated stream, the needs of the recirculator vary, and thus, the steam expanded in the turbine varies accordingly.
It is assumed that the turbine has an isentropic efficiency of 0.4 and the inlet steam is at 5 bar and 220°C. The discharge pressure is 2.5 bar. The turbofan is assumed to work with an isentropic efficiency of 0.6. The power transfer among devices, emulating the mechanical efficiency, has a factor of 0.8. The used efficiencies are based on the performance of a thermally driven high-speed gas-bearing–supported turbofan first demonstrated by Wagner et al. (2020).
Pressure Changers, Heaters, and Coolers
The balance of plant (BoP) components such as pumps for water supply, blowers for air supply and gas circulation, and heaters and coolers are modeled using standard Aspen Plus library components. The performance of the blowers is determined based on the isentropic efficiencies of 0.6 and mechanical efficiencies of 1. The pumps’ efficiencies are 0.8. Coolers and heaters are usually modeled without pressure loss (except otherwise indicated in Table 1). For the design of the HEN, a ΔTmin of 30°C is assumed. See Table 4 for a summary of all the HEXs considered, characterized by their temperature range and film transfer coefficients; these data are introduced in the SYNHEAT algorithm.
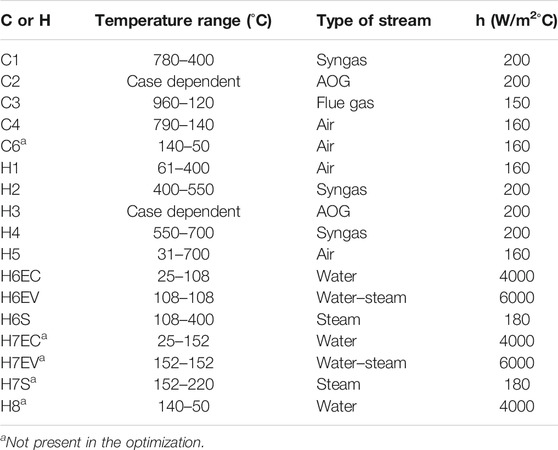
TABLE 4. List of the heating and cooling needs of the Bio-SOFC plant (H: heater, C: cooler), their fixed temperature, type of stream, and estimated film transfer coefficient (h, in W/m2°C) (Smith, 2005; Towler and Sinnott, 2013). In order to calculate the exchange area linked to the cold utility, h = 6000 W/m2°C was assumed.
Gas Turbine
As an AOG alternative, its burning and use in a GT are also considered based on the promising results reported by Facchinetti et al. (2012); Caliandro et al. (2014); Facchinetti et al. (2014), even if the authors already pointed out in Facchinetti et al. (2012) (evaluation of hydrothermal gasification–SOFC) that there is a trade-off between increased system performance and increased system complexity. In that work, the electrical efficiency can go up to 63% by considering a sub-atmospheric inverted Brayton cycle with oxy-combustion, two GTs (one at the anode side and another one at the cathode side), and CO2 separation via steam condensation and one steam production—one utilization level in a steam turbine. In Caliandro et al. (2014), the electrical efficiency of a non-pressurized small-scale gasifier–SOFC system, using an indirect circulating fluidized bed gasifier, goes up to 64.5%, when using a GT and a steam turbine.
All the AOG is therefore sent to a downstream combustor in Case 6. The burner has a stoichiometric (and complete) combustion. The burner has three inlet streams: AOG, air, and steam (in order to increase the expanding mass flow and control the combustion chamber temperature). The AOG enters the unit at 790°C and 1.04325 bar. Air enters at the same pressure and temperature, while steam enters at atmospheric pressure. The inlet amount of steam corresponds to an steam excess ratio of 3 (toward the inlet mass flow of fuel) (Facchinetti et al., 2014). The burner is adiabatic, and the outlet temperature results in 1176°C. This is the turbine inlet temperature. The pressure at the turbine outlet is 0.2029 bar. Between the GT and the downstream compressor, water is condensed so as to decrease compression power: in that way, water is pumped separately. Flue gas and water are compressed up to atmospheric pressure. The flue gas is vented at 140°C.
Results
Scenario Evaluation
The resulting GCCs for the different cases are presented in Figure 3 (see the detailed hot and cold streams’ temperatures and loads in Supplementary Table S4). It is clearly seen that the Bio-SOFC plant has a threshold problem, i.e., only cold utility is needed. The regions where the GCC bends back on itself represent regions where net heat can be exchanged between the different temperature intervals (process heat exchange). The different GCCs of the different cases differ in the amount of heat that can be exchanged within the process, the amount of required cold utility (as explained in Methodology, in our case, steam at 5 bar, to power the turbine of the FTU unit, which can be produced), and its temperature. See that Case 2 needs notably more heat to produce steam to power the FTU. The main gas responsible for the different “widths” of the GCC is the flue gas from the gasifier combustor, with more or less heat available (different streams’ mass flowrate and difference of temperatures). As a consequence, when the flue gas has a higher heat load, the value of the cold utility is higher. Note the difference between Case 1 and Cases 2, 3, and 4. Case 5 needs less cold utility because the AOG and air streams to the combustor are heated up (thus, the available heat is already used within the process). Case 6 has the largest GCC length, as heat is not only produced in the gasifier combustor via LPG but also produced in the GT combustor via AOG combustion (with its own streams of inlet air and steam). The less integrated scenarios may have a higher thermal efficiency, as they need more cold utility. However, this is not a situation to be favored, as, in general, higher cold utility needs imply higher LPG demand. Thus, the heat integration results of Case 5 pinpoint the positive effect of decreasing LPG consumption at the expense of higher AOG combustion inlet temperature and steam condensation.
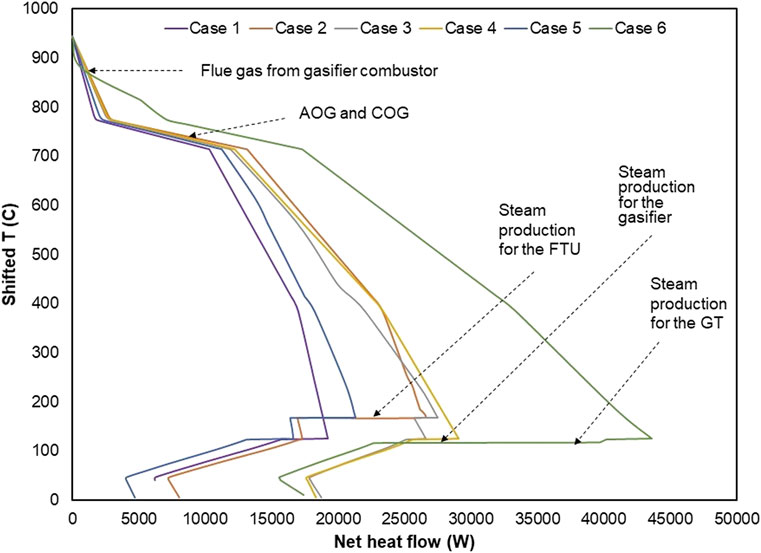
FIGURE 3. GCCs of Cases 1 to 6.
The results of the evaluation of the six cases are summarized in Supplementary Table S5. The amount of biomass is controlled to produce 25 kWe of gross electricity. The net electricity produced is around 24 kWe in all cases, except when using the GT, the electricity produced goes up to 31.7 kWe. Case 2 counts with the lowest inlet biomass stream; this is a positive effect of recirculating the AOG toward the gasifier. Lower biomass is needed as, together with the required steam (the AOG in Case 2 has 40% of H2O in mole basis), the AOG also has carbonaceous species. When the AOG is not used in the gasifier combustor, the inlet amount of LPG is 16.22 kWth (Cases 1 and 6). Case 2, however, needs a higher amount of LPG to close the heat balance in the gasifier. The reason is the higher amount of gas that has to be heated up. The amount of LPG considerably decreases in Cases 3, 4, and particularly 5; when the recirculation ratio toward the inlet stream of the SOFC (RR) is 0.5 (Case 3); and in the last case when the temperature of the AOG and air to the gasifier combustor is increased. In order to calculate the Effel value, it is seen from the discussed numbers that the larger difference is marked by the remarkable decrease in LPG needs in Case 5 (compared to the biomass inlet decrease in Case 2 and the inlet LPG amounts in Cases 3 and 4).
The syngas produced in the fluidized bed gasifier has the same quality in all the cases (the same inlet biomass and STB), except in Case 2, where the use of AOG instead of steam contributes to produce a larger mass flowrate of syngas, but with a LHV due to dilution (larger CO2 and H2O fractions). However, the calorific power of the syngas in Case 2 is overall higher than that for the other cases.
The AOG composition changes in Case 2, when it is recirculated back to the gasifier (higher fractions of CO2 and H2O), and changes in Case 3, when it is recirculated back to the SOFC LSM anode inlet (higher fractions of H2, CO, and CO2 and lower portion of H2O). With the Aspen Plus model, voltage is quite similar in all cases, whereas in Case 2, voltage is lower (worst SOFC performance). The amount of air needed is similar as well, except in Cases 2 and 3, where, indeed, AOG composition also changes. However, in order to know more accurate SOFC LSM operating values, it is advised to execute a more exhaustive SOFC stack model.
Note that the largest power consumer in the plant is the air compressor for the SOFC LSM, followed by the air compressor for the gasifier needs. The AOG compressor is used in Cases 2, 3, and 4, whereas in Case 5, only the FTU is considered to completely recirculate the AOG to the gasifier combustor.
The CGE is higher in Case 2 (due to a large calorific power of the overall syngas produced) and in Case 5 (because of the lower amount of LPG needed). The SOFC efficiency is similar in all cases, except in Case 2 (in agreement with its lower operating voltage). The electrical efficiency is 10% larger in Case 5 than in Case 1, revealing the clear benefit of using the AOG within the plant. The electrical efficiency is 45% in Case 6, compared to 44% in Case 5, when the GT is used. The cooling water that can be generated via COG cooling is also evaluated. The value of cold utility reported, as explained in Methodology, assumes that all the heat that needs to be evacuated from the system is useful heat to produce marketable steam. From the results obtained, Effth’s are higher in Cases 3, 4, and 6. The total efficiency is higher in Case 6, followed by Cases 3 and 4, Case 5, and Cases 2 and 1. However, as mentioned before, thermal efficiency will always be higher when more LPG is consumed. Therefore, as a criterion for scenario selection for optimization, the Effel is considered overall; the AOG use in the gasifier combustor decreases the use of LPG, and more if inlet temperatures are increased. The recirculation of the AOG to the gasifier and to the SOFC results in more diluted syngas entering the SOFC LSM (thus, in a worse overall system performance). The results of Effel of Cases 5 and 6 are very similar. However, Case 6 has a more complex layout and consumes more LPG than Case 5.
The larger compression pressure requirement in the FTU happens in Case 5. However, the steam needs are lower than those in Case 2 as, hypothetically, it is assumed that the AOG can be compressed at 20°C (vs. 200°C that so far has been demonstrated in the technology, since the steam in the turbine is at 220°C, to avoid large temperature gradients and steam condensation in the gas bearings). If compression is at 200°C, the total power needed from the turbine is 209 W instead of 162 W, 16.5 kg/h instead of 10.16 kg/h of steam consumed. Note that it is still less than that in Case 2 (even though all the AOG stream is of concern), as steam has been separated from the AOG (thus resulting in less flowrate to compress).
As a conclusion of this evaluation, Case 5 is the selected layout for optimization. The internal use of AOG in the Bio-SOFC plant proves to be positive to increase the Effel while decreasing the amount of LPG, pursuing the green production of electricity. The use of the FTU is also strategically selected for optimization, as it can use steam generated within the plant to compress the AOG, thus not decreasing the amount of net electricity produced (Case 4 AOG fan consumption—0.129 W vs. 10.19 kg/h of steam needed). The steam released after the turbine expansion is still marketable steam.
Within the BLAZE project context, the net present value of the base Case 5 was studied, considering pilot plant values. Among the overall investment, the SOFC LSM contributes the most, followed by the gasifier and feeding system, HEN, reactors, and vessels. Operating costs overcome revenues. The most influencing variable in the net present value is the inside battery limits investment. Further R&D is needed to decrease it2.
Optimization
Supplementary Figure S7 presents the Bio-SOFC plant layout to be optimized, including the variables considered for optimization, in red. The optimization variables are summarized in the next section, whereas the process constraints are listed in Table 2. The forbidden matches correspond to prohibited hot–cold stream connections in the HEN design due to possible flammability issues.
Input Data
The generation of green electricity is a design priority. Thus, the AOG recirculation toward the gasifier combustor was the preferred recirculation option. The temperatures of inlet air (TH1) and AOG to the combustor (TH3) were identified as key to achieve zero LPG. Moreover, the lower the amount of steam in the AOG (which depends on TC2), the better towards zero LPG consumption, to consume less compression power and to require less combustion heat in the gasifier combustor. The main operating variables of the gasifier, i.e., the STB, the temperature of the inlet steam (TH6S), and the gasification temperature (TGasif), as well as the main operating variables of the SOFC LSM, i.e., fuel cell inlet temperature (Tin SOFC, the same for the anode and cathode) and FU, are considered decision variables. The hot GCU works at a range of temperatures, with a fixed and complete contaminants’ separation fraction, which is assumed not to vary. The chloride and sulfur compounds’ abatement units and the tar reformer operating temperatures are therefore optimized. Table 5 summarizes the decision variables and their possible range of variation.
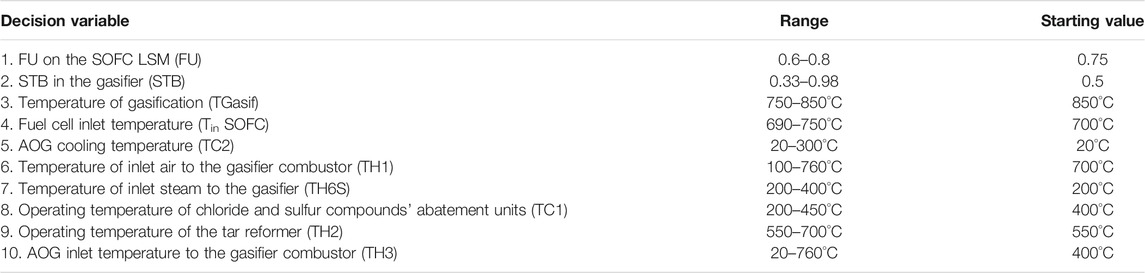
TABLE 5. Decision variables for optimization (between brackets, reference in Supplementary Figure S7).
The forbidden matches are heat exchange connections to avoid, in the Bio-SOFC plant, between fuel-rich and oxygen-rich streams to prevent explosion. In the Bio-SOFC plant, these streams correspond to the following heaters (H) and coolers (C):
- C1: Syngas cooling down after the gasifier
- C2: AOG cooling down for steam separation
- C4: COG cooling down
- H1: Air inlet to the burner
- H2: Syngas between cleaning units
- H3: AOG going to the gasifier combustor
- H4: Syngas going to the SOFC
- H5: Air inlet to the SOFC
The flammability limits are defined as the lowest and highest concentrations of combustibles in air at normal conditions of pressure and temperature (at 1 bar and 20°C); within these limits, the mixture will be burnt if ignited (Towler and Sinnott, 2013). Selecting as a reference the values from Case 5, the compositions of the fuel gases and oxygen-rich gases of the Bio-SOFC system affected by H’s and C’s mentioned above are summarized in Table 6 and Table 7. The possible mixtures of combustible and oxygen-rich streams are calculated in Table 8. The possible flammable mixtures are marked in bold and underlined in the table. The forbidden matches are therefore (C4,H4), (C4,H2), (C1,H5), (C1,H1), and (C2,H1).
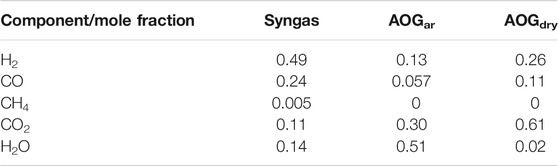
TABLE 6. Composition of fuel gases in the Bio-SOFC plant.
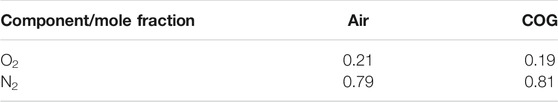
TABLE 7. Air and COG compositions in the Bio-SOFC plant.
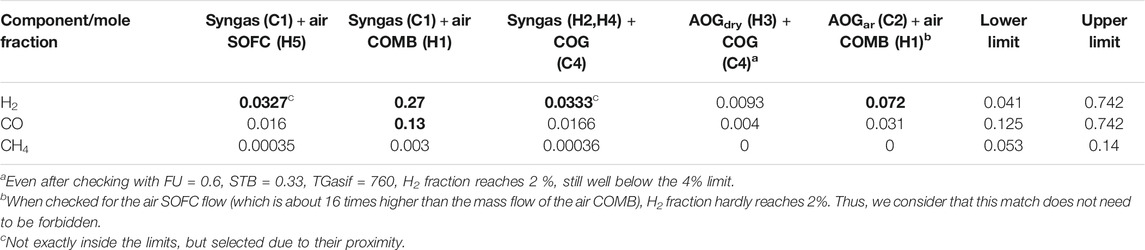
TABLE 8. Combustible and oxygen-rich stream mixtures, compared to the upper and lower flammability limits in air (Towler and Sinnott, 2013).
Influence of Variables
The output data generated while performing the optimization (independent and control variable values) provide an amount of information that can be used to analyze the variable’s impact on the selected optimization objectives. The electrical efficiency is higher when FU, inlet AOG temperature, and air temperature (TH3 and TH1) to the gasifier combustor increase. On the contrary, Effel increases when the STB and the gasification temperature decrease. Regarding FU, electricity production is certainly improved as a larger fuel conversion is considered. As widely analyzed in the scenario evaluation, the temperature of the inlet gasifier combustor stream tends to be higher to decrease LPG consumption. In relation to the gasifier operation, see Supplementary Tables S6, S7 for the effects of the STB and TGasif on relevant gasifier output values. The gasification reactions where steam is involved are endothermic, so the heat of combustion increases as the STB raises. The consumptions of LPG and biomass raise with the STB. The higher the STB, the higher the steam fraction in the syngas. The steam content affects the performance of the SOFC LSM. The more the steam in the SOFC, the more the biomass is needed to produce the same amount of power. Therefore, lower STBs are favored in the optimization.
Analogously, a higher steam fraction in the SOFC LSM is avoided when selecting lower gasification temperatures (moreover, in dry composition, H2 and CO fractions are higher at lower temperatures). Furthermore, LPG and biomass consumptions increase when the gasification temperature raises. In the variables analysis, it is seen that the higher the CGE, the better the Effel. The lower the inlet LPG and amount of air to the combustor, the better the Effel. These last three are dependent variables that are linked to the aimed LPG consumption reduction.
The thermal efficiency is “biased” by a worse system integration, as all the cold utility heat can be used to produce marketable steam, thus increasing the Effth. Influencing and conflicting variables compared to Effel are TGasif, TH1 and TH3, and gasifier combustor inlet LPG and air (thus, an increased consumption of LPG would need more steam as the cold utility). Lower Tin SOFC and TC2 improve Effth, as less heat is integrated (needed) within the process.
The HEN area is fairly independent of the influence of the selected decision and control variables (see also the Pareto shape in the next section). Nevertheless, it slightly depends on the Tin SOFC; the largest HEX in the Bio-SOFC plant corresponds to H5 (inlet SOFC warming up).
Selection of Optimum Designs
Figure 4 shows the Pareto front and its projection on different planes. The optimization process was executed several times, obtaining a total of 38,028 points. This total number of executed scenarios was filtered, first to only keep the cases that converged in Aspen Plus and AMPL and second to only consider the cases that respect the constraints listed in Table 2. The Pareto front and its projections reveal that there exists a trade-off between Effth and Effel and between Effel and HEN area. On the contrary, a higher Effth requires less HEN area.
FIGURE 4. Pareto front of the Bio-SOFC plant (Case 5) optimization. Trade-off among Effel, Effth, and HEX area.
From these results, the extremes of the Pareto front are selected (see the columns Effel, Effth, and HEN area in Table 9). Moreover, the utopian point is used as an ideal of the criteria values to find the closer solutions from the Pareto front. The utopian coordinates are Effel = 0.5, Effth = 0.4, and for the HEN area, the minimum area found in the whole range of executed scenarios was selected. The weighted distance to the utopian point is considered in the colored scale of Figure 5. Marked by yellow squares are the 20 closer points to the utopian point. The weight given to the Effel and Effth is the same (i.e., 1), while the weight given to the HEN area is 1/100 (considered a less critical objective in the BLAZE project, so as to favor the other two criteria). See the first column of Table 9 for the data corresponding to the closest point to the utopian point.
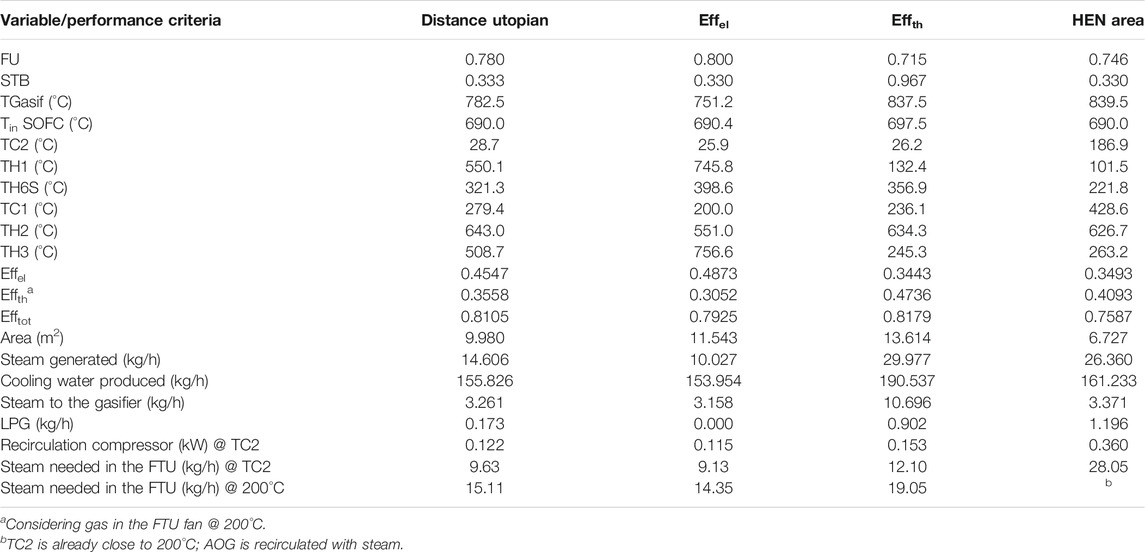
TABLE 9. Selected optimal process designs (extremes of the Pareto front and closest point to the utopian point) and performance.
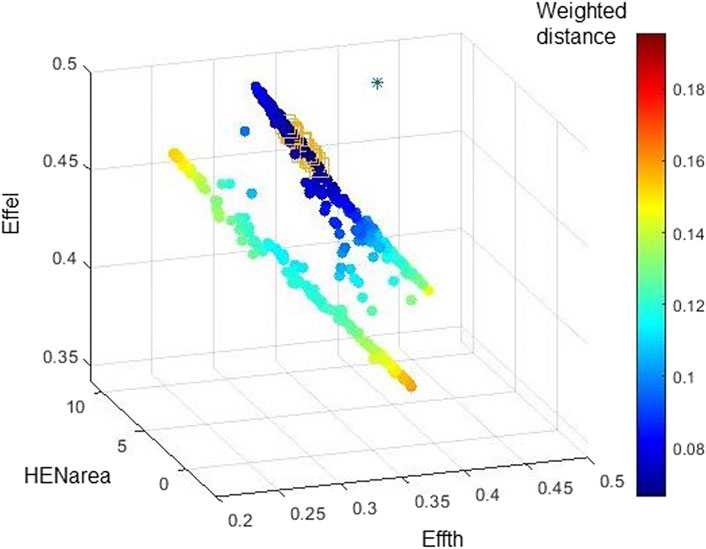
FIGURE 5. Pareto front and sorting of solutions based upon the utopian point (star point).
In Supplementary Figure S8, the values of the optimization variables (Table 5) of the Pareto points are plotted, sorted by distance (from closer to further) from the utopian point. The most important variables in the Bio-SOFC plant are (in order) as follows:
- FU (var1), which tends to be on the upper limit (above 0.75).
- The AOG cooling temperature (var5), which is low enough to separate steam (below 40°C).
- The SOFC inlet temperature (var4), which tends to be on the lower limit (690–700°C).
- The STB (var2), which tends to be on the lower limit (below 0.4).
- The gasification inlet temperature (var3), which tends to be on the lower limit (around 750–780°C).
- The inlet air temperature to the combustor (var6), usually closer to the upper limit (above 500°C).
- The inlet AOG temperature to the combustor (var10), which tends to be above 100°C.
The selected ranges of temperature for the gasification steam (var7) and the chloride and sulfur compounds’ abatement units (var8) and tar reformer (var9) have no impact on the results. The latter is particularly interesting, as it reveals that, for the specific case of the Bio-SOFC plant, the temperature of the GCU is not crucial for the final efficiency of the plant. However, it was assumed that the efficiency of the GCU units was independent of temperature, and moreover, in the Bio-SOFC plant, production of waste heat is not an issue, as the high-temperature heat is a valuable stream that generates profitable steam. At equality of performance, and in exergy terms, it is not advised to go further down in temperature for the GCU, when the needed temperature downstream is around 700°C.
The results in Table 9 reveal a total efficiency around 80%. For the solution that is closer to the utopian point, the electrical efficiency is 45%, the thermal efficiency is 36%, and the HEN area is 10 m2. LPG consumption is zero in the case where Effel is maximized. In the case where the HEN area is minimized, the LPG consumption is not a crucial variable. Note that the steam consumption of the FTU turbine is below the steam generated in the plant when the AOG is at TC2. However, as explained before, the AOG cannot have such a low temperature. At 200°C, the steam needs could be only covered by the optimum configuration with the largest Effth. As an alternative, if the FTU is not used, the power consumed by a commercial fan used to provide the ΔP required by the AOG is in the row “Recirculation compressor (kW) @ TC2” in Table 9.
The results presented are the extremes of the Pareto front and the utopian point, based on the reported weights above. However, other Pareto solutions from the Pareto front can be selected depending on the decision criteria of the decision-maker, for instance, zero LPG consumption or the calculated exergy efficiency, if priority is given to energy degradation. For instance, for the selected Pareto solutions, the exergy efficiency varies between 34 and 52%, being higher when the electrical efficiency is higher (note that, in the Bio-SOFC plant, the temperatures of the hot and cold utilities were fixed).
Heat Exchanger Network Design
The HEN structures for each of the reported optimum points are summarized in Supplementary Tables S8–S11. The reported variables in the tables follow the nomenclature described in the methodology, with capital T corresponding to the hot source (and 1 referring to the inlet, 2 to the outlet). The fourth and fifth columns refer to the stage where heat exchange takes place (as defined in the SYNHEAT algorithm). Therefore, a stream with different stages (which is the case for several hot streams in the current results, not for the cold ones) means that this stream counts with series (up to 3) HEXs. A stream with the same stage several times means that parallel HEXs are considered. End-CU refers to a connection with the cold utility (in this case, generating steam at the conditions required by the FTU).
As general characteristics, the Bio-SOFC plant may count with 12 HEXs with C4–H5 being the most important HEXs (exchange between inlet and outlet air streams of the SOFC LSM). C3 (flue gas) can be combined in many ways, as it is the largest hot source of the Bio-SOFC plant. When combined with H5 (Tin SOFC), the HEN area decreases considerably (see Supplementary Table S11). C4 (COG) and C3 (flue gas) are indeed the main hot sources.
Conclusion
This paper summarizes the different scenario evaluations and the optimization performed to propose a micro-CHP bio-waste gasification–SOFC plant layout and working conditions within the framework of the EU H2020 project BLAZE. Two particularities of this plant are 1) the AOG recirculation and 2) the use of small-scale turbomachinery to make it possible. The main locations where the AOG could be recirculated were 1) the SOFC LSM anode inlet, 2) the gasifier combustor, and 3) the gasification chamber. The AOG recirculation toward the gasifier combustor was selected as the preferred layout for implementation. The optimization of this layout pinpointed the most important plant variables for plant operation: FU (above 0.75), AOG cooling temperature (which has to be low enough to allow steam condensation), SOFC inlet temperature (between 690 and 700°C), STB (below 0.4), gasification inlet temperature (which tends to be on the lower limit), and inlet air temperature to the combustor and inlet AOG temperature to the combustor (which tend to the upper limits). Four optimum designs were selected, i.e., the extremes of the Pareto front (maximum Effel, maximum Effth, and minimum HEN area) and the nearest design to the utopian point. The HEN of selected optimal solutions was described (in total, 15 HEXs are foreseen), with a total area of heat exchange between 6 and 14 m2, which corresponds to an amount of heat exchanged between 91 and 117 kW. The COG and flue gas are the main hot sources, and the consumption of LPG can be avoided, or at least minimized. The most important HEX is the one that exchanges heat between the inlet and outlet air streams of the SOFC LSM. The electrical and thermal efficiencies went up to 49 and 47%, respectively. The combined total efficiency ranges between 76 and 82%. For comparison, current small biomass gasification CHP plants coupled with gas engines have electric efficiencies of up to 25%, and combined efficiencies of up to 80%. The final pilot plant implementation decision will come from the adjustment and consideration as baseline of the optimization results to the strategic decision of the project consortium in terms of steam and LPG consumptions, and, of course, of practical implementation considerations.
Data Availability Statement
The original contributions presented in the study are included in the article/Supplementary Material, and further inquiries can be directed to the corresponding author.
Author Contributions
MP-F conceptualized the idea. MP-F and AN performed the methodology. MP-F, VH, and AN were involved in modeling and result analysis. MP-F and VH wrote the paper. MP-F edited the paper. MP-F, VH, AN, JS, FM, and JV discussed about the results and reviewed the paper. FM and JV obtained the resources, and JS and JV acquired the funding.
Funding
The BLAZE project has received funding from the European Union’s Horizon 2020 Research and Innovation Programme under Grant Agreement No. 815284.
Conflict of Interest
The authors declare that the research was conducted in the absence of any commercial or financial relationships that could be construed as a potential conflict of interest.
Acknowledgments
Thanks are due to Andrea Di Carlo for gasifier modeling sharing and the biomass- and gasification-related discussions, to Ligang Wang, Jan Pieter Ouweltjes, and Gabriele Prosperi for the provision of data for SOFC validation, to Ilaria Mirabelli and Robert Makkus for the GCU provision of data, to Prof. Enrico Bocci and Prof. Jack Brouwer for the fruitful discussions, and to Alberto Mian for his support during the development of the modeling approach.
Supplementary Material
The Supplementary Material for this article can be found online at: https://www.frontiersin.org/articles/10.3389/fenrg.2021.665585/full#supplementary-material
Footnotes
1BLAZE project public deliverables can be checked at https://www.blazeproject.eu/resources/.
2BLAZE project public deliverables can be checked at https://www.blazeproject.eu/resources/.
Glossary
Aex Heat exchanger area (m2)
AMPL A Mathematical Programming Language
AOG Anode off-gas
ar as-received basis
BLAZE Biomass Low cost Advanced Zero Emission small-to-medium scale integrated gasifier-fuel cell combined heat and power plant
BoP Balance of plant
CX Cooler (X corresponds to a number; nomenclature in the PFD)
CGE Cold gas efficiency
CHP Combined heat and power
COG Cathode off-gas
DBFBG Dual bubbling fluidized bed gasifier
Effel Electrical efficiency
Effth Thermal efficiency
EffSOFC SOFC efficiency
Efftot Total (CHP) efficiency
ev-MOGA Multi-objective evolutionary algorithm developed by the Predictive Control and Heuristic Optimization Group (CPOH) at Universitat Politècnica de València (Spain)
FC Fuel cell
FTU Turbine-driven fan unit or fan turbine unit
FU Fuel utilization
GCC Grand composite curve
GCU Gas-cleaning unit
GT Gas turbine
h Film transfer coefficient (W/m2°C)
HEN Heat exchanger network
HEX Heat exchanger
HX Heater (X corresponds to a number; nomenclature in the PFD)
LHV Lower heating value (kJ/kg)
LMTD Logarithmic mean temperature difference (°C)
LPG Liquefied petroleum gas
m mass flowrate (kg/s)
MER Maximum energy recovery
MILP Mixed integer linear programming
MO Multi-objective
PFD Process flow diagram
Pcomp Power consumed by the compressors/fans of the system (kW)
Pprod Gross power produced by the SOFC LSM (kW)
Ppump Power consumed by the pumps of the system (kW)
Qcu Heat that is absorbed by the cold utility (kW)
Qhw Heat used to produce hot water at 1.01325 bar and 65°C (kW)
Qturb Thermal power consumed by the turbine of the FTU (kW)
RR Recirculation ratio
SOFC LSM Solid oxide fuel cell large stack module
STCR Steam-to-carbon ratio
STB Steam-to-biomass ratio
T Temperature (°C)
Tin Stream inlet temperature before a heat exchange (°C)
Tout Stream outlet temperature after a heat exchange (°C)
ΔTmin Minimum temperature difference between a hot and a cold stream (°C)
U Heat transfer coefficient (W/m2°C)
VL Vapor–liquid
References
Akhlas, J., Baesso, S., Bertucco, A., and Ruggeri, F. (2015). Coal Gasification by Indirect Heating in a Single Moving Bed Reactor: Process Development & Simulation. AIMS Energy 3, 635–665. doi:10.3934/energy.2015.4.635
Bocci, E., Sisinni, M., Moneti, M., Vecchione, L., Di Carlo, A., and Villarini, M. (2014). State of Art of Small Scale Biomass Gasification Power Systems: A Review of the Different Typologies. Energ. Proced. 45, 247–256. doi:10.1016/j.egypro.2014.01.027
Buonomano, A., Calise, F., d’Accadia, M. D., Palombo, A., and Vicidomini, M. (2015). Hybrid Solid Oxide Fuel Cells-Gas Turbine Systems for Combined Heat and Power: A Review. Appl. Energ. 156, 32–85. doi:10.1016/j.apenergy.2015.06.027
Caliandro, P., Tock, L., Ensinas, A. V., and Maréchal, F. (2014). Thermo-economic Optimization of a Solid Oxide Fuel Cell - Gas Turbine System Fuelled with Gasified Lignocellulosic Biomass. Energ. Convers. Manage. 85, 764–773. doi:10.1016/j.enconman.2014.02.009
Choudhury, A., Chandra, H., and Arora, A. (2013). Application of Solid Oxide Fuel Cell Technology for Power Generation-A Review. Renew. Sustainable Energ. Rev. 20, 430–442. doi:10.1016/j.rser.2012.11.031
Cockroft, J., and Kelly, N. (2006). A Comparative Assessment of Future Heat and Power Sources for the UK Domestic Sector. Energ. Convers. Manage. 47, 2349–2360. doi:10.1016/j.enconman.2005.11.021
Colpan, C. O., Dincer, I., and Hamdullahpur, F. (2007). “Effect of Recirculation on Carbon Deposition for Direct Internal Reforming Solid Oxide Fuel Cells,” In Proc. 3rd Internat. Energy, Exergy, and Environ. Symposium. Editor A. F. Miguel, A. H. Reis, and R. N Rosa 1–5 July 2007, Évora, Portugal
Cottrell, C. A., Grasman, S. E., Thomas, M., Martin, K. B., and Sheffield, J. W. (2011). Strategies for Stationary and Portable Fuel Cell Markets. Int. J. Hydrogen Energ. 36, 7969–7975. doi:10.1016/j.ijhydene.2011.01.056
Dietrich, R.-U., Oelze, J., Lindermeir, A., Spitta, C., Steffen, M., Küster, T., et al. (2011). Efficiency Gain of Solid Oxide Fuel Cell Systems by Using Anode Offgas Recycle - Results for a Small Scale Propane Driven Unit. J. Power Sourc. 196, 7152–7160. doi:10.1016/j.jpowsour.2010.09.016
Doherty, W., Reynolds, A., and Kennedy, D. (2009). Modelling and Simulation of a Biomass Gasification-Solid Oxide Fuel Cell Combined Heat and Power Plant Using aspen Plus. Proc. 22nd Internat. Conf. Eff., Cost, Optim., Simul. Environ. Impact Energ. Syst. Foz Do IguaÇu, Brazil, 1711–1720.
Doherty, W., Reynolds, A., and Kennedy, D. (2013). ASPEN PLUS Simulation of Biomass Gasification in a Steam Blown Dual Fluidised Bed. Mat. Proc. Energy: Commun. Curr. Res. Technol. Develop. Editor A. F. Méndez-Vilas (Formatex Research Centre), 212–220.
Doty, S., and Turner, W. C. (2009). Energy Management Handbook. 7th ed. The Fairmont Press, Inc. and CRC Press (Taylor & Francis Group)
Dougherty, W., Kartha, S., Rajan, C., Lazarus, M., Bailie, A., Runkle, B., et al. (2009). Greenhouse Gas Reduction Benefits and Costs of a Large-Scale Transition to Hydrogen in the USA. Energy Policy 37, 56–67. doi:10.1016/j.enpol.2008.06.039
EG and G Technical Services, I (2004). Fuel Cell Handbook. 7 Edition. West Virginia: Fuel Cell, 1–352. doi:10.1002/zaac.200300050
Engelbracht, M., Peters, R., Blum, L., and Stolten, D. (2015). Analysis of a Solid Oxide Fuel Cell System with Low Temperature Anode Off-Gas Recirculation. ECS Trans. 68, 283–292. doi:10.1149/06801.0283ecst
Faaij, A. P. C. (2006). Bio-energy in Europe: Changing Technology Choices. Energy Policy 34, 322–342. doi:10.1016/j.enpol.2004.03.026
Facchinetti, E., Gassner, M., D’Amelio, M., Maréchal, F., and Favrat, D. (2012). Process Integration and Optimization of a Solid Oxide Fuel Cell - Gas Turbine Hybrid Cycle Fueled with Hydrothermally Gasified Waste Biomass. Energy 41, 408–419. doi:10.1016/j.energy.2012.02.059
Facchinetti, E., Favrat, D., and Marechal, F. (2014). Design and Optimization of an Innovative Solid Oxide Fuel Cell-Gas Turbine Hybrid Cycle for Small Scale Distributed Generation. Fuel Cells 14, 595–606. doi:10.1002/fuce.201300196
Green, D. W., and Perry, R. H. (1999). Perry’s Chemical Engineers’ Handbook - Heat Transfer Equipment Section. New York, USA: McGraw-Hill Education
Halinen, M., Thomann, O., and Kiviaho, J. (2012). Effect of Anode Off-Gas Recycling on Reforming of Natural Gas for Solid Oxide Fuel Cell Systems. Fuel Cells 12, 754–760. doi:10.1002/fuce.201200047
Hassmann, K. (2001). SOFC Power Plants, the Siemens‐Westinghouse Approach. Fuel Cells 1 (1), 78–84. doi:10.1002/1615-6854(200105)1:1<78::aid-fuce78>3.0.co;2-q
Industrial Process and Energy Systems Engineering Group (2020). Resources from IPESE Group. Lausanne, Switzerland: EPFL website.
Kapdan, I. K., and Kargi, F. (2006). Bio-hydrogen Production from Waste Materials. Enzyme Microb. Technology 38, 569–582. doi:10.1016/j.enzmictec.2005.09.015
Kemp, I. C. (2007). Pinch Analysis and Process Integration. A User Guide on Process Integration for the Efficient Use of Energy. 2nd ed. Burlington, MA, USA: Butterworth-Heinemann, Elsevier
Kothari, R., Singh, D. P., Tyagi, V. V., and Tyagi, S. K. (2012). Fermentative Hydrogen Production - an Alternative Clean Energy Source. Renew. Sustainable Energ. Rev. 16, 2337–2346. doi:10.1016/j.rser.2012.01.002
Lee, T. S., Chung, J. N., and Chen, Y.-C. (2011). Design and Optimization of a Combined Fuel Reforming and Solid Oxide Fuel Cell System with Anode Off-Gas Recycling. Energ. Convers. Manage. 52, 3214–3226. doi:10.1016/j.enconman.2011.05.009
Linnhoff, B., and Hindmarsh, E. (1983). The Pinch Design Method for Heat Exchanger Networks. Chem. Eng. Sci. 38, 745–763. doi:10.1016/0009-2509(83)80185-7
Marcantonio, V., Bocci, E., and Monarca, D. (2019). Development of a Chemical Quasi-Equilibrium Model of Biomass Waste Gasification in a Fluidized-Bed Reactor by Using Aspen Plus. Energies 13, 53. doi:10.3390/en13010053
Marcantonio, V., Bocci, E., Ouweltjes, J. P., Del Zotto, L., and Monarca, D. (2020). Evaluation of Sorbents for High Temperature Removal of Tars, Hydrogen Sulphide, Hydrogen Chloride and Ammonia from Biomass-Derived Syngas by Using Aspen Plus. Int. J. Hydrogen Energ. 45, 6651–6662. doi:10.1016/j.ijhydene.2019.12.142
Martelli, E., Elsido, C., Mian, A., and Marechal, F. (2017). MINLP Model and Two-Stage Algorithm for the Simultaneous Synthesis of Heat Exchanger Networks, Utility Systems and Heat Recovery Cycles. Comput. Chem. Eng. 106, 663–689. doi:10.1016/j.compchemeng.2017.01.043
Mian, A., Martelli, E., and Maréchal, F. (2016). Framework for the Multiperiod Sequential Synthesis of Heat Exchanger Networks with Selection, Design, and Scheduling of Multiple Utilities. Ind. Eng. Chem. Res. 55, 168–186. doi:10.1021/acs.iecr.5b02104
Nakajo, A., Wuillemin, Z., Metzger, P., Diethelm, S., Schiller, G., Van herle, J., et al. (2011). Electrochemical Model of Solid Oxide Fuel Cell for Simulation at the Stack Scale I. Calibration Procedure on Experimental Data. J. Electrochem. Soc. 158, B1083–B1101. doi:10.1149/1.3596433
Park, Y. J., Min, G., and Hong, J. (2019). Thermodynamic Optimization of a SOFC-CHP System with Exhaust Gas Recirculation Employing an In-House Numerical Simulator. ECS Trans. 91, 2097–2104. doi:10.1149/09101.2097ecst
Pérez-Fortes, M., Mian, A., Srikanth, S., Wang, L., Diethelm, S., Varkaraki, E., et al. (2019). Design of a Pilot SOFC System for the Combined Production of Hydrogen and Electricity under Refueling Station Requirements. Fuel Cells (Weinh) 19, 389–407. doi:10.1002/fuce.201800200
Peters, R., Deja, R., Blum, L., Pennanen, J., Kiviaho, J., and Hakala, T. (2013). Analysis of Solid Oxide Fuel Cell System Concepts with Anode Recycling. Int. J. Hydrogen Energ. 38, 6809–6820. doi:10.1016/j.ijhydene.2013.03.110
Radenahmad, N., Azad, A. T., Saghir, M., Taweekun, J., Bakar, M. S. A., Reza, M. S., et al. (2020). A Review on Biomass Derived Syngas for SOFC Based Combined Heat and Power Application. Renew. Sustainable Energ. Rev. 119, 109560. doi:10.1016/j.rser.2019.109560
Rokni, M. (2017). Addressing Fuel Recycling in Solid Oxide Fuel Cell Systems Fed by Alternative Fuels. Energy 137, 1013–1025. doi:10.1016/j.energy.2017.03.082
Savuto, E., Di Carlo, A., Steele, A., Heidenreich, S., Gallucci, K., and Rapagnà, S. (2019). Syngas Conditioning by Ceramic Filter Candles Filled with Catalyst Pellets and Placed inside the Freeboard of a Fluidized Bed Steam Gasifier. Fuel Process. Technol. 191, 44–53. doi:10.1016/j.fuproc.2019.03.018
Schneider, T., Ruf, F., Müller, D., and Karl, J. (2021). Performance of a Fluidized Bed-Fired Stirling Engine as Micro-scale Combined Heat and Power System on wood Pellets. Appl. Therm. Eng. 189, 116712. doi:10.1016/j.applthermaleng.2021.116712
Smith, M. A., and Few, P. C. (2001). Domestic-scale Combined Heat-And-Power System Incorporating a Heat Pump: Analysis of a Prototype Plant. Appl. Energ. 70, 215–232. doi:10.1016/s0306-2619(01)00033-2
Smith, R. (2005). Chemical Process Design and Integration. West Sussex, United Kingdom: John Wiley & Sons.
Thiers, S., Aoun, B., and Peuportier, B. (2010). Experimental Characterization, Modeling and Simulation of a wood Pellet Micro-combined Heat and Power Unit Used as a Heat Source for a Residential Building. Energy and Buildings 42, 896–903. doi:10.1016/j.enbuild.2009.12.011
Torii, R., Tachikawa, Y., Sasaki, K., and Ito, K. (2016). Anode Gas Recirculation for Improving the Performance and Cost of a 5-kW Solid Oxide Fuel Cell System. J. Power Sourc. 325, 229–237. doi:10.1016/j.jpowsour.2016.06.045
Towler, G., and Sinnott, R. (2013). Chemical Engineering Design: Principles, Practice and Economics of Plant and Process Design. 2nd ed. Waltham, MA, USA: Butterworth-Heinemann, Elsevier
Ud Din, Z., and Zainal, Z. A. (2016). Biomass Integrated Gasification-SOFC Systems: Technology Overview. Renew. Sustainable Energ. Rev. 53, 1356–1376. doi:10.1016/j.rser.2015.09.013
Van herle, J., Maréchal, F., Leuenberger, S., and Favrat, D. (2003). Energy Balance Model of a SOFC Cogenerator Operated with Biogas. J. Power Sourc. 118, 375–383. doi:10.1016/s0378-7753(03)00103-4
Wagner, P., Wuillemin, Z., Constantin, D., Diethelm, S., Van herle, J., and Schiffmann, J. (2020). Experimental Characterization of a Solid Oxide Fuel Cell Coupled to a Steam-Driven Micro Anode Off-Gas Recirculation Fan. Appl. Energ. 262, 114219. doi:10.1016/j.apenergy.2019.114219
Yee, T. F., and Grossmann, I. E. (1990). Simultaneous Optimization Models for Heat Integration-II. Heat Exchanger Network Synthesis. Comput. Chem. Eng. 14, 1165–1184. doi:10.1016/0098-1354(90)85010-8
Yee, T. F., Grossmann, I. E., and Kravanja, Z. (1990). Simultaneous Optimization Models for Heat Integration-I. Area and Energy Targeting and Modeling of Multi-Stream Exchangers. Comput. Chem. Eng. 14, 1151–1164. doi:10.1016/0098-1354(90)85009-Y
Zhang, L., Xing, Y., Xu, H., Wang, H., Zhong, J., and Xuan, J. (2017). Comparative Study of Solid Oxide Fuel Cell Combined Heat and Power System with Multi-Stage Exhaust Chemical Energy Recycling: Modeling, experiment and Optimization. Energ. Convers. Manage. 139, 79–88. doi:10.1016/j.enconman.2017.02.045
Keywords: bio-waste gasification, solid oxide fuel cell, anode off-gas recirculation, small-scale turbomachinery, process modeling, optimization, mathematical programming, heuristics
Citation: Pérez-Fortes M, He V, Nakajo A, Schiffmann J, Maréchal F and Van herle J (2021) Techno-Economic Optimization of an Integrated Biomass Waste Gasifier–Solid Oxide Fuel Cell Plant. Front. Energy Res. 9:665585. doi: 10.3389/fenrg.2021.665585
Received: 08 February 2021; Accepted: 10 May 2021;
Published: 07 June 2021.
Edited by:
Rangan Banerjee, Indian Institute of Technology Bombay, IndiaReviewed by:
Yusuf Bicer, Hamad Bin Khalifa University, QatarArnaldo Walter, State University of Campinas, Brazil
Copyright © 2021 Pérez-Fortes, He, Nakajo, Schiffmann, Maréchal and Van herle. This is an open-access article distributed under the terms of the Creative Commons Attribution License (CC BY). The use, distribution or reproduction in other forums is permitted, provided the original author(s) and the copyright owner(s) are credited and that the original publication in this journal is cited, in accordance with accepted academic practice. No use, distribution or reproduction is permitted which does not comply with these terms.
*Correspondence: Mar Pérez-Fortes, bS5kLm0ucGVyZXotZm9ydGVzQHR1ZGVsZnQubmw=
†Present address: Department of Engineering Systems and Services, Faculty of Technology, Policy and Management, Delft University of Technology (TUDelft), Delft, Netherlands