- 1College of Computer Science and Electronic Engineering, Hunan University, Changsha, China
- 2School of Energy and Power Engineering, Xi’an Jiaotong University, Xi’an, China
A combination of Convolutional Neural Network (CNN), Long-Short Term Memory (LSTM), and Convolutional LSTM (ConvLSTM) is constructed in this work for the fault diagnosis and post-accident prediction for Loss of Coolant Accidents (LOCAs) in Nuclear Power Plants (NPPs). The advantages of ConvLSTM, such as effective feature determination and extraction, are applied to the classification of LOCA cases. The prediction accuracy is enhanced via the collaborative work of CNN and LSTM. Such a hybrid model is proved to be functional, accurate, and adaptive, offering quick accident judgment and a reliable decision basis for the emergency response purpose. It then allows NPPs to have an Artificial Intelligence (AI)-based solution for fault diagnosis and post-accident prediction.
Introduction
The quick and accurate response to a Nuclear Power Plants (NPP) accident is critical to the safety of both the plant and the public. However, the accident model needed for fault diagnosis and post-accident prediction is hard to construct due to complex physical processes, nonlinear parameter variations, and multiple system factors. Assumptions have to be often made, whereas the accuracy of the model has to be sacrificed. Furthermore, most of the accidents behave as a nonlinear process, which makes the traditional statistical methods difficult to describe the system behavior and development trend. With the progress of machine learning, especially deep learning, describing accident behavior using data-based Artificial Intelligence (AI) models has become an effective way to avoid the above-mentioned problems. A large amount of simulated nuclear power plant data from previous research works has also settled a firm base to carry out AI models for fault diagnosis and post-accident prediction.
LOCA Classification
Loss of Coolant Accident (LOCA) is a type of severe accident that could happen during the operation of NPPs. The break of the Primary Heat Transport (PHT) system causes a fast and large loss of coolant, leading to the overheating of the reactor core. Hence, it is of great importance to timely determine the LOCA situation and evaluate its development. The break size has to be confirmed first since it determines both the flowrate at the break and the post-LOCA behavior of the system. As mentioned, building an accurate system model for this purpose is prevented by the complex accident process itself. Another challenge is that the break size varies due to different circumstances when the LOCA is taking place.
Researchers in recent years have explored possible methods to identify the LOCA case. Both Na et al. (2004) and Santhosh et al. (2011) trained their neural network (NN) models using a transient dataset generated by thermal-hydraulic codes to detect the break size of a LOCA. Later on, multi-connected Support Vector Machines (SVMs) were utilized to estimate the break size such that the LOCA type can be identified (Yoo et al., 2017). Tian et al. (2018) proposed a constraint-based random search algorithm for optimizing NN architectures for detecting the break size of a LOCA. Principal Component Analysis (PCA) was adopted by Sun et al. (2019) to identify the LOCA case happening at the Steam Generator (SG) tubes of a small modular reactor. Tanim et al. (2020) uses the PCTRAN prototype software to determine the unexpected interruption and loss of the coolant of the VVER-1200 reactor and their possible consequences on various parameters. Weglian et al. (2020) provides a single-top PRA fault tree for comprehensive assessment of the risk of various hazards such as the loss of coolant accidents. Deep learning models, as a data-driven method, is seldom found in previous LOCA diagnosis works. To avoid the complexity of building analytical system models, this work take ConvLSTM as a deep learning attempt to solve the LOCA diagnosis challenge.
The LOCA case is determined in this work using Convolutional Long-Short Term Memory (ConvLSTM) (Shi et al., 2015), which is improved in this work for data series classification. ConvLSTM is a variant of LSTM. It replaces the matrix multiplication of each gate in the LSTM unit with a convolution operation, such that the basic spatial features can be captured by convolution operations in multi-dimensional data. The main difference between ConvLSTM and LSTM is the input dimension. Input data to LSTM is one-dimensional. However, ConvLSTM can handle data that are one-dimensional, two-dimensional, and three-dimensional. The training dataset is obtained using an NPP control system design and validation platform (Sun et al., 2017). The design and validation platform mainly uses shared memory technology and an engineering simulator coupled with MATLAB/Simulink. Subsequently, the performance can be evaluated through simulations of abrupt load-transient changes and wide range-load changes. The coupling of the engineering simulator and MATLAB/Simulink generates an industry-grade simulation and validation platform, providing an effective tool for research on barely happened scenarios. The training dataset from such platform enables the ConvLSTM model to recognize features of different break sizes such that the LOCA type can be confirmed at an early stage of the accident.
Post-accident Prediction
Tracing critical system parameters and predicting their post-LOCA development assist the emergency response team to act in advance, reserving the safety margin as expected. However, knowing the break size is not enough to settle the decision basis. Depending on the operation status, a certain size PHT break may be followed with different system behaviors.
A nonlinear process, such as the post-LOCA trend, cannot be easily predicted using traditional statistical methods. In the past decade, various attempts have been taken for the prediction of processes in NPPs, such as (1) predicting the counter-current flow limitation at hot leg pipe during a small-break LOCA (Jeong, 2002); (2) predicting the water vessel level using Group Method of Data Handling (GMDH) (Park et al., 2013) and Deep Neural Network (DNN) (Koo et al., 2018); (3) predicting the leak flow rate of LOCA using Fuzzy Neural Network (FNN) (Kim et al., 2014); (4) monitoring the real-time condition of a LOCA using Time-Frequency Domain Reflectometry (TFDR) (Lee et al., 2017); (5) using RELAP5/MOD3.3 code to predict the LOCA of the main steam break (MSLB) on the third generation reactor with passive safety features (Yang et al., 2019); and (6) utilizing DNN/LSTM expert system to predict the loss of nuclear power plant coolant accident (Radaideh et al., 2020).
This work proposes a deep learning model combined with both Convolutional Neural Network (CNN) and Long-Short Term Memory (LSTM) for the post-LOCA prediction. It is considered that the prediction model has to understand the variation caused by both the break size and the operation status. To achieve this, the CNN part is introduced to deal with the multi-dimensional dataset. It recognizes and extracts the key features such that the prediction process is not misled. LSTM, as a deep learning model for long-time series prediction, is then utilized to calculate the post-LOCA development of critical system parameters.
The Hybrid Model for LOCA Diagnosis and Prediction
The hybrid model constructed in this work consists of two major modules. The modified ConvLSTM model is responsible for LOCA diagnosis, followed by the “CNN+LSTM” module for post-LOCA prediction.
Improved ConvLSTM for LOCA Diagnosis
ConvLSTM model was originally proposed for prediction purposes (Shi et al., 2015). It has been widely applied to image and video processing areas (Feng et al., 2019; Mukherjee et al., 2019; Niu et al., 2019). In this work, it is chosen as the classifier for LOCA diagnosis due to the following considerations:
1. LOCA scenario consists of complicated system variations, such as uncertain break size, flowrate drop, pressure drop, etc. The expected classifier has to be capable of locating the key features of these parameters and extracting them for prediction. This can be satisfied by the convolutional structure of the ConvLSTM.
2. The diagnosis triggered by LOCA deals with time-series data, which is an essential function of the LOCA classifier. ConvLSTM can apply its LSTM structure for this objective.
3. The LOCA diagnosis deals with multiple features and time-series data. Both have to be taken care of simultaneously. The ConvLSTM, with the assistance of certain additional structures, is capable of identifying and extracting key features from time-series data.
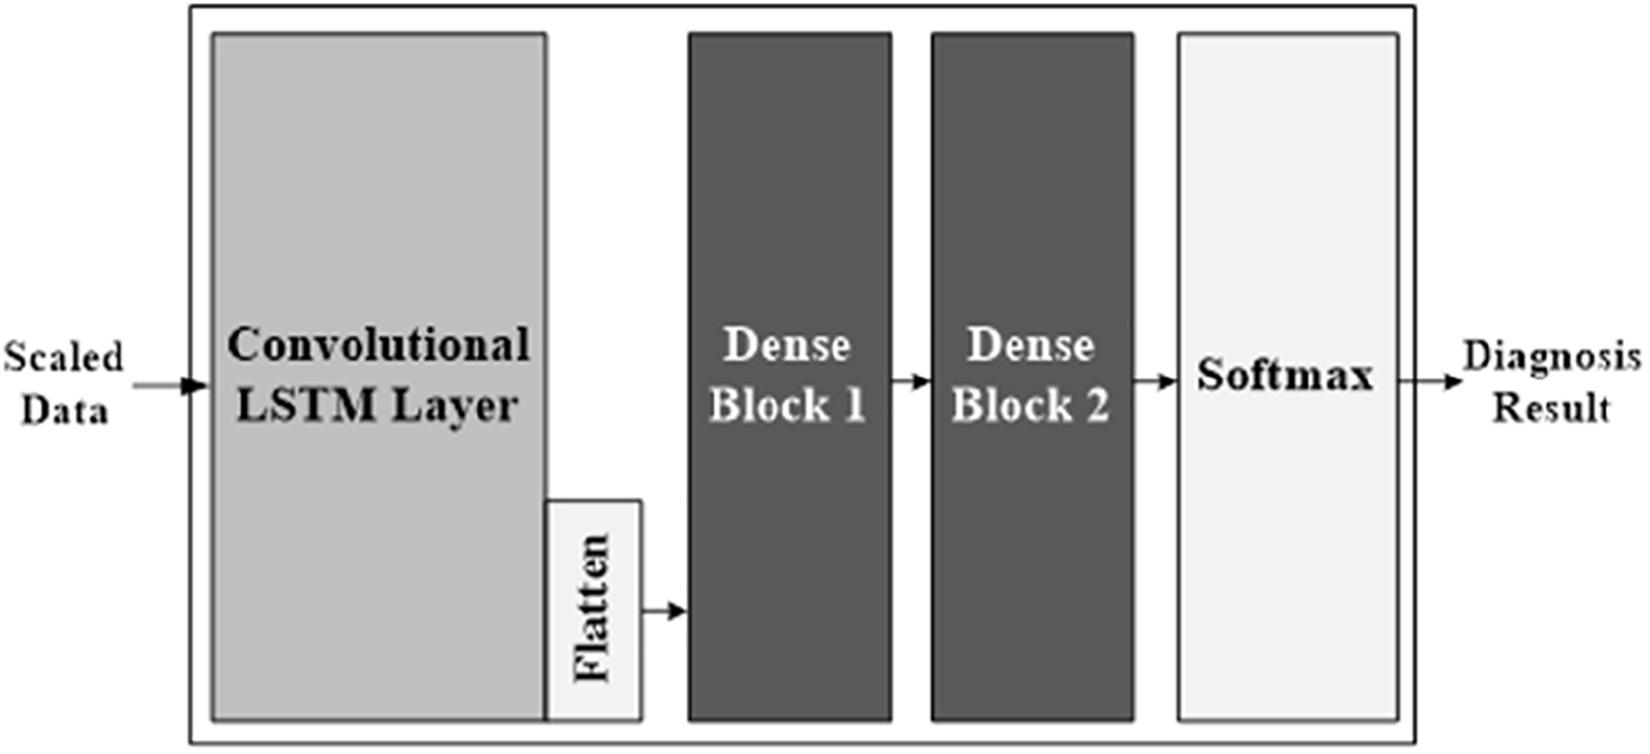
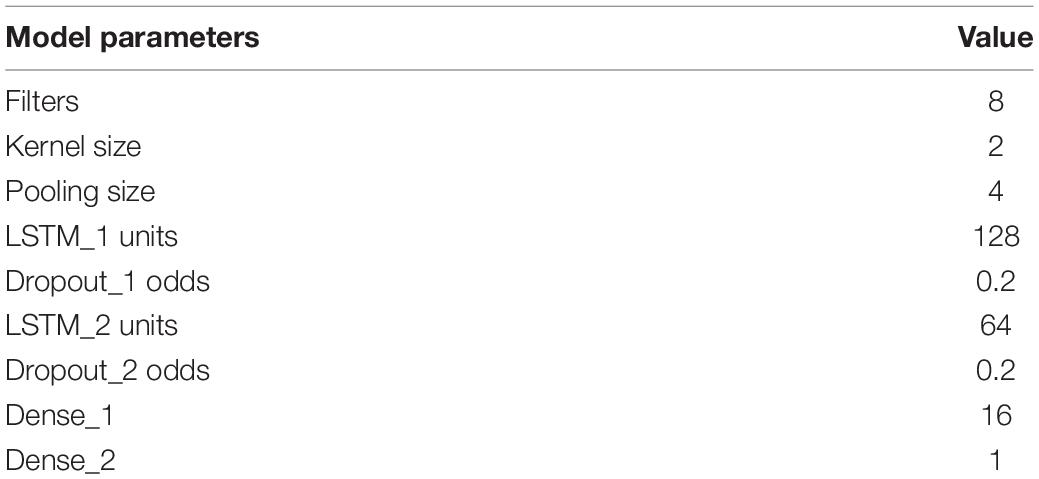
This work studies five Steam Generator Tube Rupture (SGTR) LOCA cases, i.e., break size of 0.2, 0.4, 0.6, 0.8, and 1.0 cm2. Simulations are conducted using the mentioned platform (Sun et al., 2017) to obtain the dataset for model training and test. Each break case is simulated with different reactor power levels of 60, 70, 80, 90, and 100% to cover various operation statuses when the LOCA takes place. The traditional ConvLSTM layer is utilized in this work to extract key features from the normalized LOCA process dataset. Following it, there are two dense layers and a softmax function (Krizhevsky et al., 2012) to strengthen the classification performance. Using dense layers for classification has been verified by previous works (e.g., Kim and Medioni, 2010; Bi et al., 2019; Zhang et al., 2019). Dense layers used in these previous works have demonstrated qualified classification performance, which encourages its application to the classification of time-series data in this work. One of the two dense layers integrates the extracted features using 500 neural cells. The other one analyzes the results from the first one using five neural cells. Each cell in the second dense layer represents the probability of a break size. The softmax function is used after the dense layers, providing a probability list to indicate the classification result, i.e., the one with the largest probability. Critical system parameters, such as the pressurizer pressure and the coolant flowrate, are comprehensively examined by the model for a precise classification result. A brief illustration of the improved ConvLSTM is shown in Figure 1; while Table 1 shows its parameter configuration.
CNN+LSTM for Post-LOCA Prediction
The greatest challenge for post-LOCA prediction is the uncertainty of the process to be predicted. Although five typical break sizes are chosen to represent the LOCA scenarios, it is not a full coverage yet. Even for a chosen case, different NPP operation status at the LOCA moment could lead to various post-LOCA situations. Therefore, the prediction model needs to be aware of such uncertainty and be able to predict cases that are similar to the training ones.
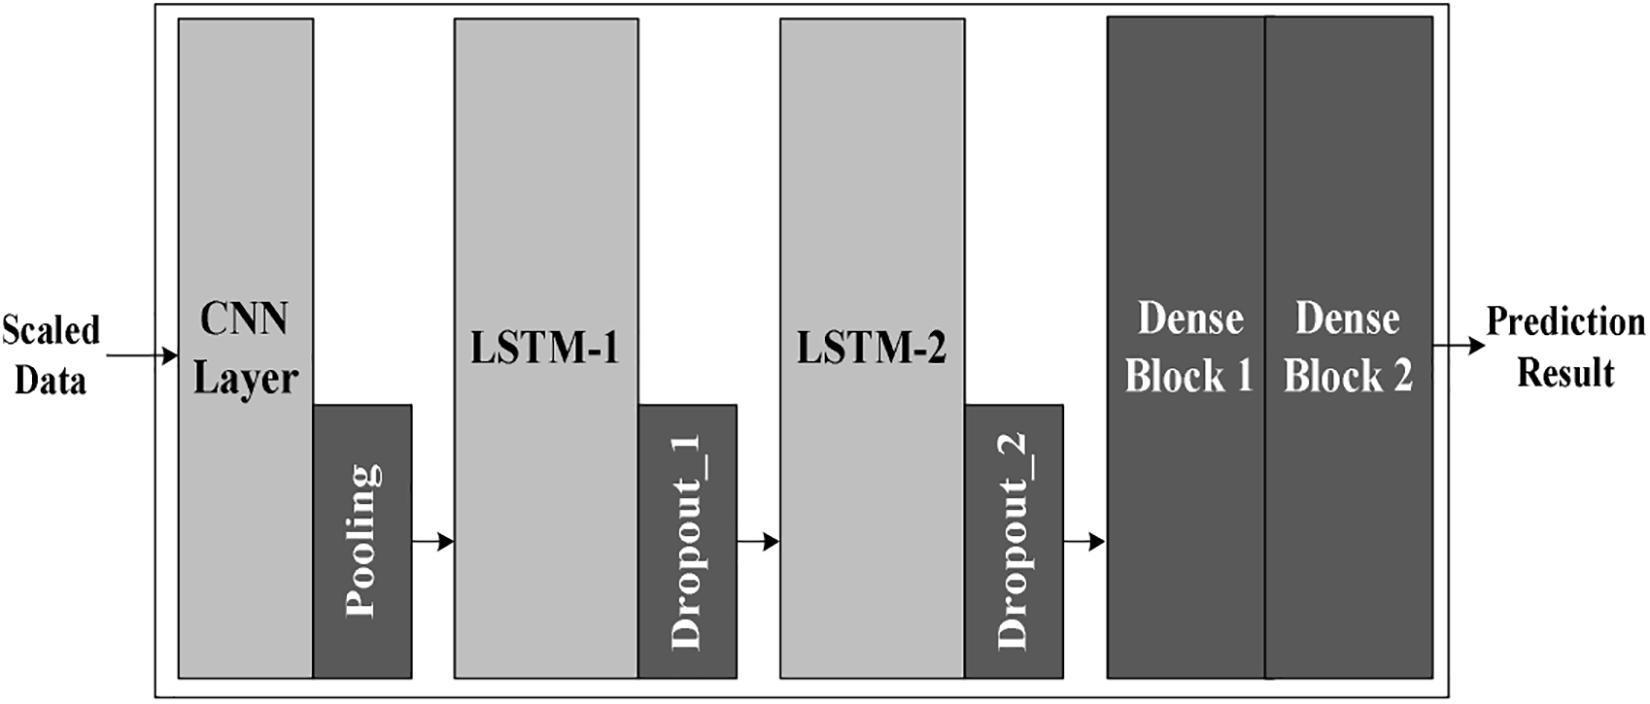
In order to handle the uncertainty challenge, the prediction model is constructed with a combinational structure of CNN and LSTM. The convolutional computation from CNN, with the assistance of weight sharing and pooling operation, can effectively extract the major features at the early stage of the development. The LSTM model, as a variety of Recurrent Neural Network (RNN), is proficient at dealing with long-time series datasets such as LOCA data (She et al., 2019). Since the LOCA process is hard to predict due to complicated variations, two LSTM layers are used to increase the depth of the neural network. Two dense layers are also applied to the prediction results processing, ensuring a result with all necessary features.
The prediction model is trained using datasets of the five chosen LOCA cases. Total five sets of model weights are saved in a so-called “fault dictionary.” Once the classification results, e.g., 0.2 cm2 break, reaches the prediction model, it looks up the fault dictionary and loads the model with the corresponding “weight set-0.2” trained by such case. Figure 2 below describes the model structure and Figure 3 shows the process of using a fault dictionary. The parameter configuration is listed in Table 2.
Experiments and Results
Experiments of this work are divided into two major stages. The proposed models are verified using industry simulation datasets first. A LOCA case is then picked up for the system integration test.
As mentioned, each LOCA case (0.2, 0.4, 0.6, 0.8, or 1.0 cm2) is simulated under five kinds of operation status (60, 70, 80, 90, and 100% reactor power levels). Noise signals are introduced during the simulation such that the dataset is expanded and has a wider coverage of possible situations. Seventy-five percentage of the dataset is used for training purposes with the Rolling Update method applied; the rest of the dataset is used for the test experiments of both the classifier and the prediction model. The test dataset is also plotted as the “original value” in the result figures such that the comparison between the prediction results and the actual LOCA trend can be illustrated. All the data is denoised, smoothed, and then normalized to the maximum and minimum values.
Model Verification
Classifier Model Verification
The classifier verification uses test vectors composed of 10 system parameters, including core inlet temperature, core exit temperature, core outlet supercooling degree, pressurizer pressure, pressurizer water level, and five types of coolant flowrates. All the parameter values in one test vector belong to a chosen LOCA case. Adequate parameters in the test vector lead to a narrow classification scope, which guarantees accurate classification results.
During the classifier verification, there are totally 25 test vectors, 5 for each break size. And all contain the 10 crucial system parameters. They are fed into the model via a 50-timestep process that imitates the industry sampling process. The verification results are listed in Table 3 below.
Results in Table 3 demonstrate the classification performance of the proposed model. All the correct classifications are obtained at the first timestep and kept for the entire classification process. The sole misclassification case is the 0.4 cm2 break size at 60% reactor power level and it is misclassified as an adjacent case (0.6 cm2 break at 60% power level).
Prediction Model Verification
The prediction model verification, however, consists of three sub-experiments:
(1) regular test of the “0.2 cm2 break” model using a “0.2 cm2 break” test vector;
(2) comparison experiments between a “pure LSTM” model and the “CNN+LSTM” model;
(3) adaptivity test of the “0.2 cm2 break” model using a “1.0 cm2 break” test vector.
(1) Functionality Verification
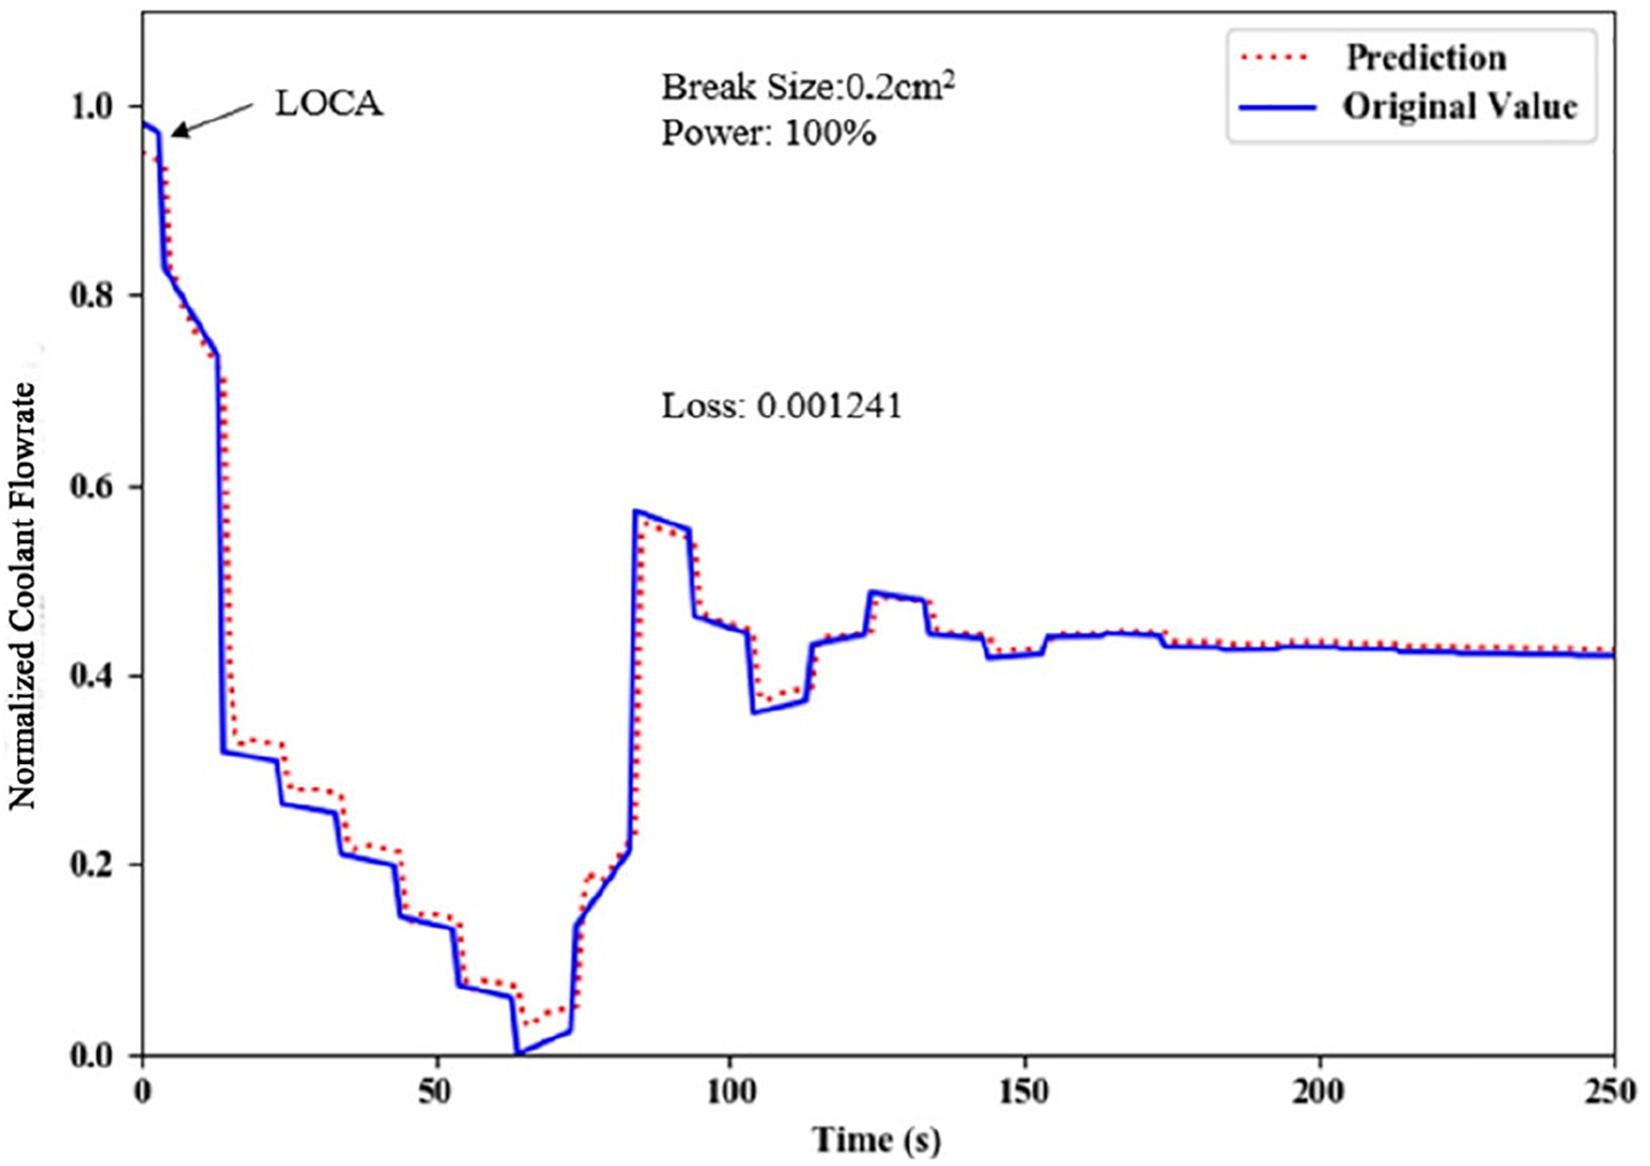
A regular test is performed to simply verify the model functionality. A 0.2 cm2 break test vector, which is randomly picked from the dataset, is fed into the “CNN+LSTM” model trained by the 0.2 cm2 break dataset. The coolant flowrate prediction result is shown in Figure 4.
The prediction given by the “CNN+LSTM” model matches the original value closely with a loss value of 1.241 ×10⁻³. The prediction capability of the proposed model is verified.
(2) Comparison Experiments
The comparison experiments are carried out for the coolant flowrate using all break sizes at 100% reactor power level, showing the performance comparison between the two models. The loss values via Mean Square Error (MSE) function are listed in Table 4 to describe the difference.
With lower loss values derived by the “CNN+LSTM” model, the comparison of the results in Table 4 clearly shows the advantage of using the “CNN+LSTM” structure. It is demonstrated that the CNN layer covers the shortage of the LSTM model when facing a multi-feature process.
(3) Adaptivity Verification
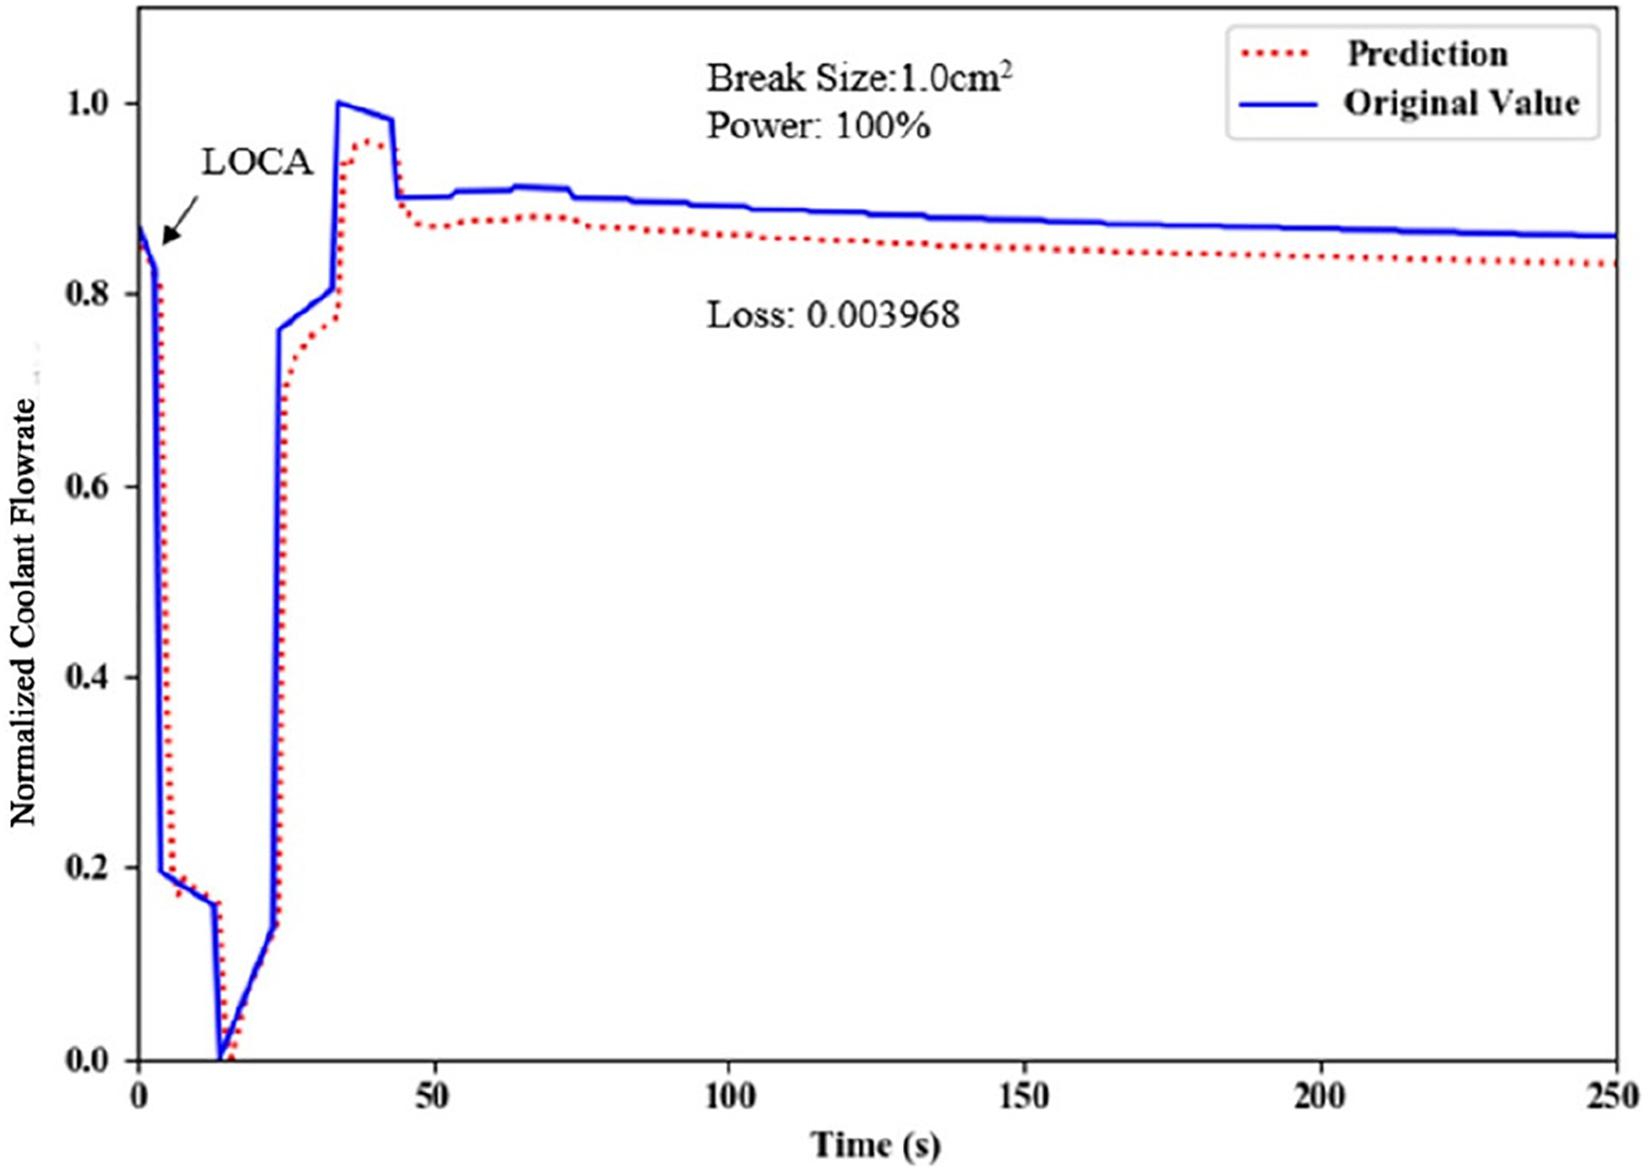
The third verification experiment is to prove that the prediction model in this work can adapt to an untrained but similar case. This is quite meaningful to accident scenarios with much uncertainty, such as the LOCA. For this experiment, the coolant flowrate dataset generated from the simulation of a 1.0 cm2 break is applied to a prediction model trained by a 0.2 cm2 break dataset, both at 100% power level. The prediction generated is illustrated in Figure 5.
The “1.0 cm2 break” prediction curve generated by a “0.2 cm2 break” model still follows the main trend of the test case. The loss value of 3.968 ×10⁻³ is larger than experiment (1) but still within the same order of magnitude. It has to be pointed out that 0.2 cm2 break and 1.0 cm2 break are two cases with the biggest difference in the given dataset group. Such a result signifies that any two of other case models can adapt to each other even closer. That is to say, when an uncertain scenario appears, the “CNN+LSTM” model has the potential to adapt to it and generate a meaningful prediction.
Based on the high-accuracy classification, the prediction showing functionality and adaptivity, and the better performance demonstrated in the comparison experiments, the hybrid LOCA diagnosis and prediction model has been proved to be accurate, functional, and adaptive.
Diagnosis and Prediction Experiment
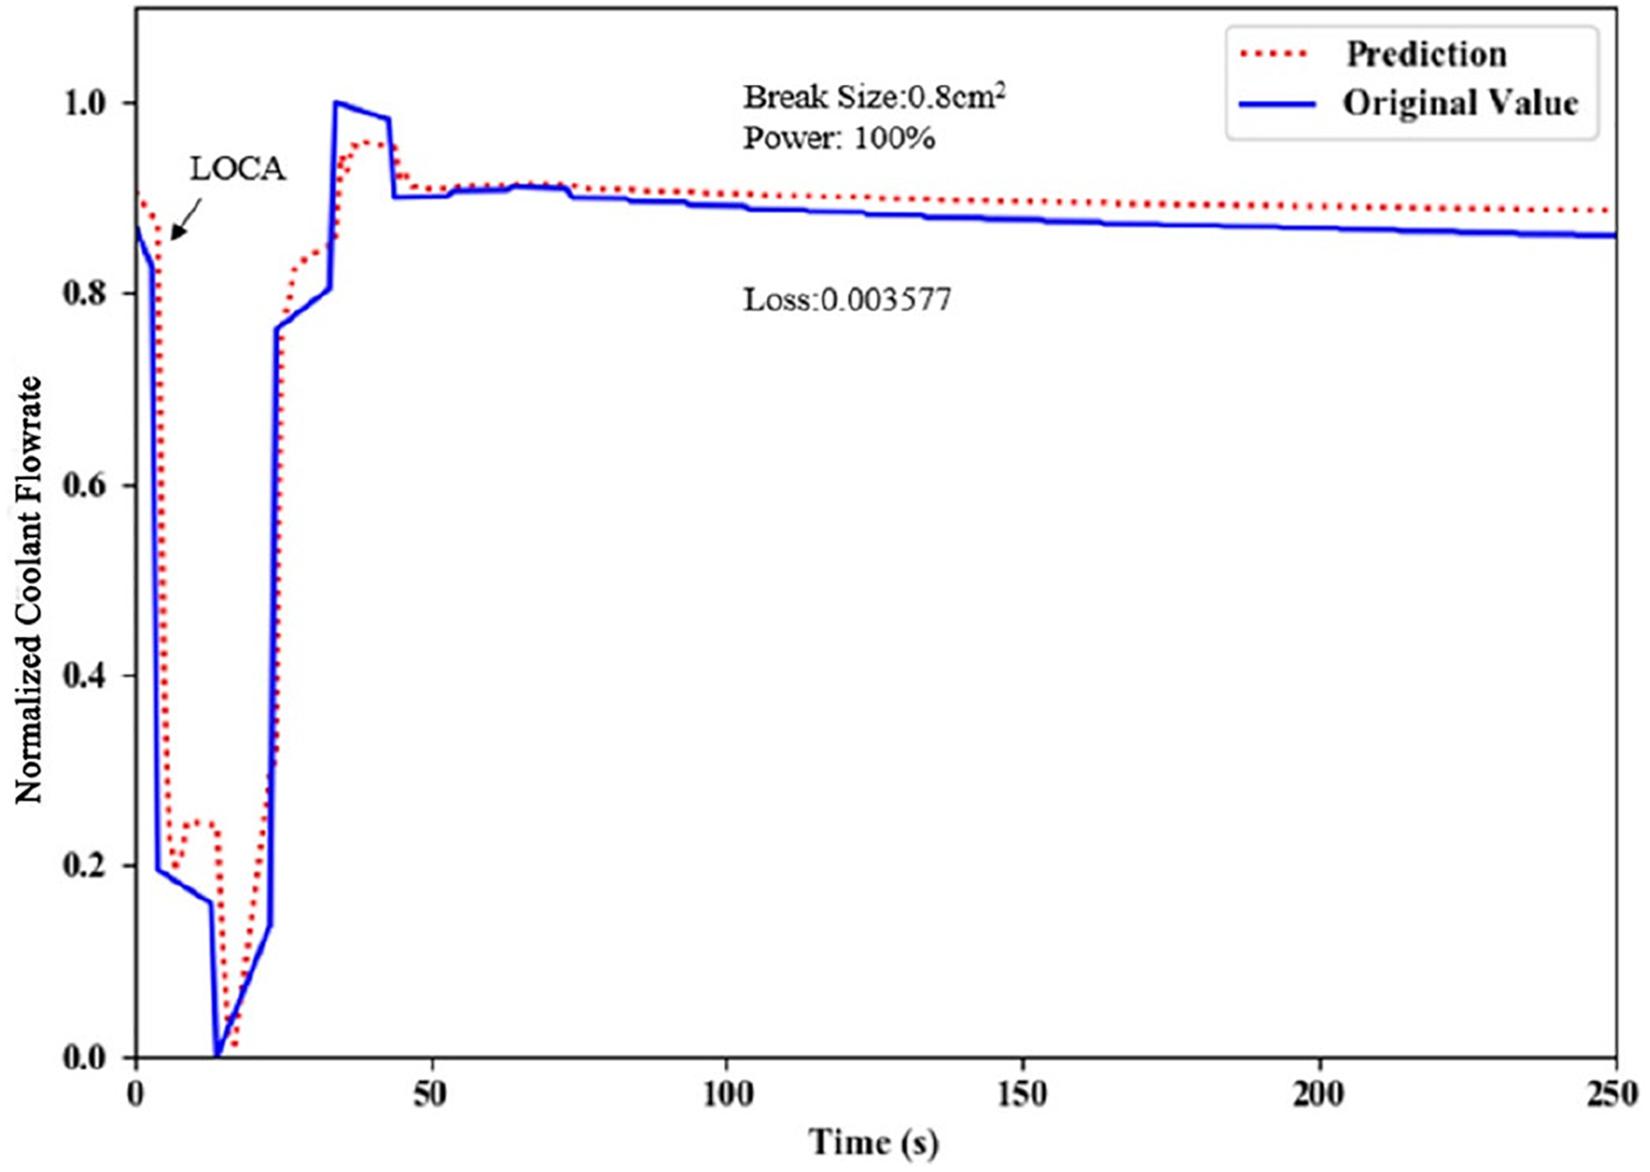
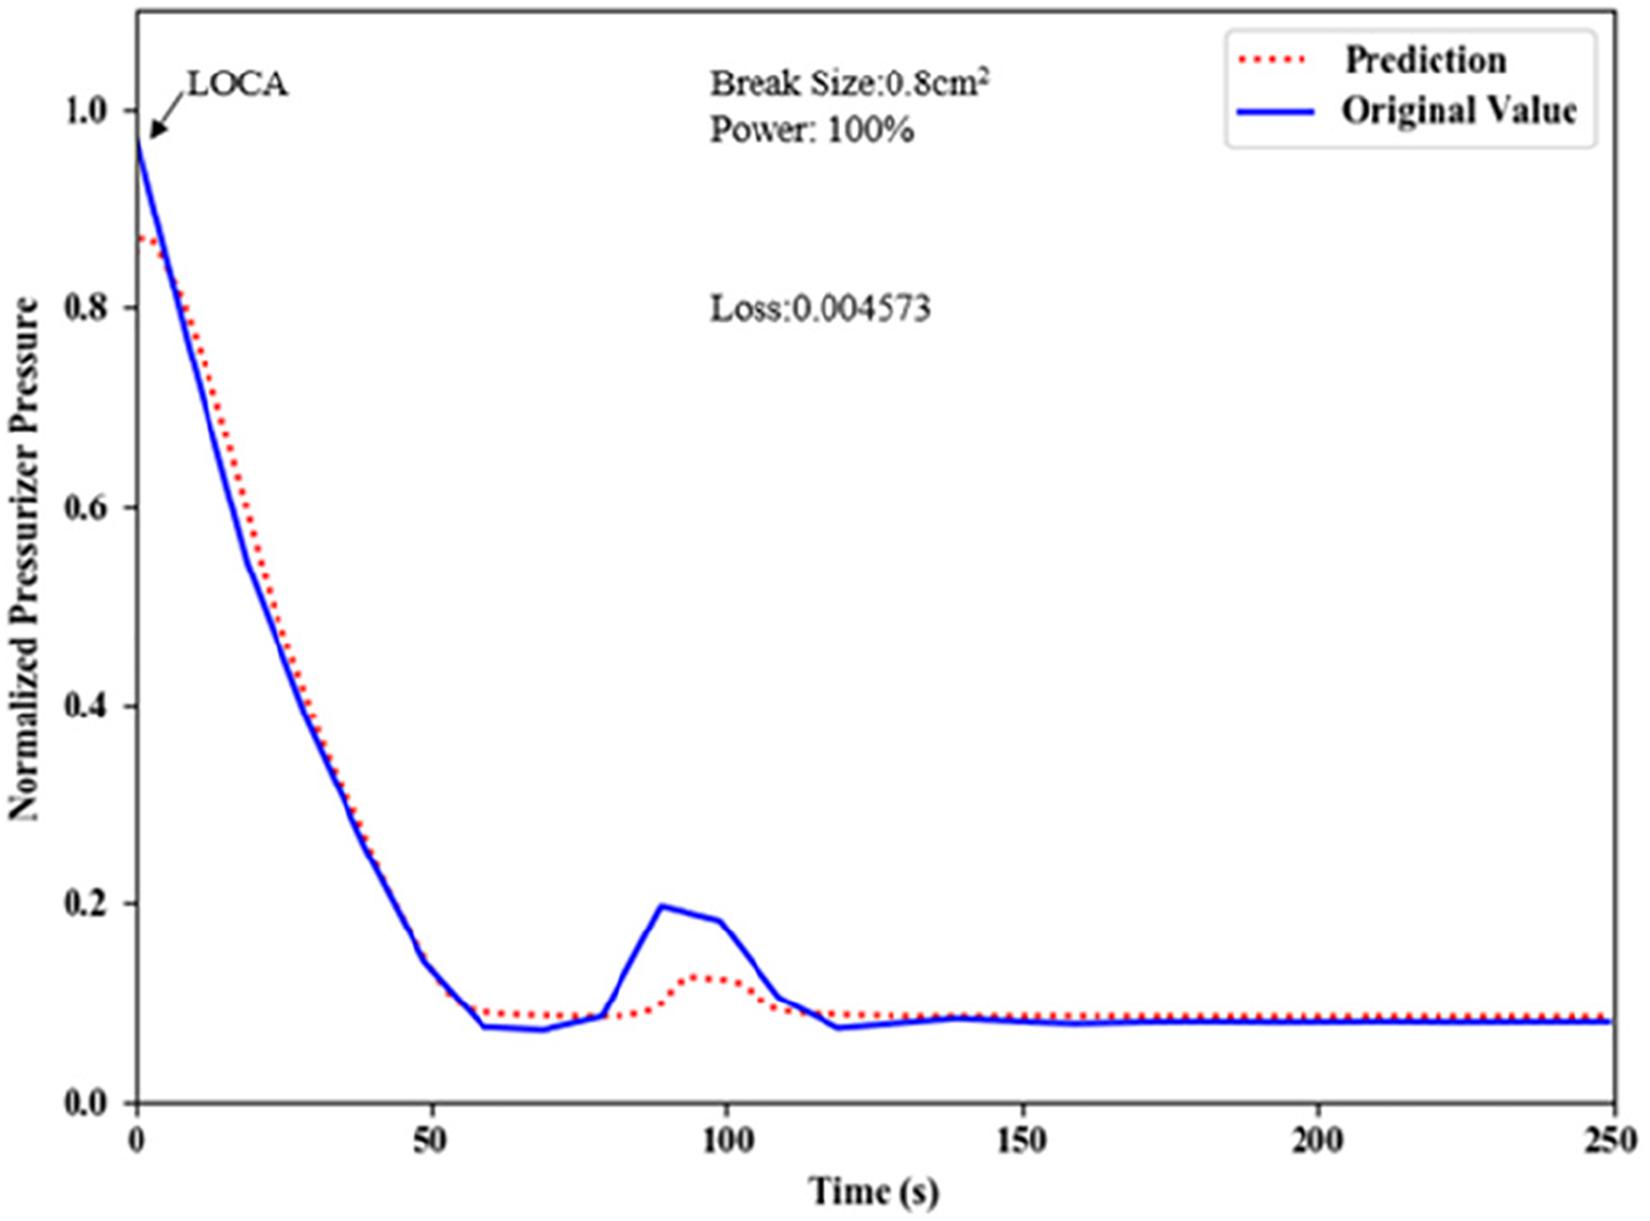
This subsection presents one of the system integration experiments conducted from diagnosis to prediction for a given LOCA case, 0.8 cm2 break at 100% power level. The purpose is to demonstrate the functionality and performance of the proposed hybrid model from a systematic view.
Predictions for two crucial system parameters, coolant flowrate, and pressurizer pressure, are selected to be shown in Figures 6, 7, respectively.
It is noticed that, at the beginning of both Figures 6, 7, the prediction appears underfitting. This is often observed in prediction using neural networks. In this work, the prediction model is trained for each break size separately and the trained weights are then stored in the fault dictionary. However, during the training process, all the data belong to the chosen break size are used, including data under different reactor power levels. Thus, it is hard to avoid the underfitting problem when the prediction test for 0.8 cm2 break is performed against a certain reactor power.
The prediction curves also show underfitting at where dramatic changes are. This is exactly what has been mentioned as one of the great challenges to predict nonlinear processes. As can be seen from the following figures, the prediction is trying to catch with the sudden rises or drops. But when the quick nonlinear changes happen consecutively, the prediction can only develop in a lagging manner, leading to underfitting phenomena at those sharp turning points.
Conclusion
A hybrid model for LOCA diagnosis and prediction is proposed in this work. The ConvLSTM is used for fault type diagnosis, and the LOCA prediction is produced using CNN-LSTM. The datasets of different break sizes of LOCA are obtained from the experimental platform. The dataset is preprocessed and normalized for proper training and test dataset. The proposed diagnosis and prediction model is then tested and verified through rigorous experiments. With an improved structure, the fault diagnosis model based on ConvLSTM successfully reaches classification accuracy as high as 96%. The post-LOCA prediction model established by combining CNN and LSTM has also shown effective functionality and adaptability through three different sub-experiments. Its loss values (MSE) for all the test cases are kept as low as 10–3, satisfying the accuracy expectation. Comparing to the LSTM model, the CNN-LSTM demonstrated its advantage of multi-feature processing, which provides a better prediction performance.
However, the model research proposed in this article has certain limitations. First of all, the sample datasets used in this experiment need to be further expanded to ensure the validity of the experiment. In addition, the model needs to be further verified using real LOCA data from the NPPs. Moreover, underfitting does appear in prediction results due to training strategy and consecutive inflection points, which implies the potential improvement of the prediction model in future work.
Data Availability Statement
The raw data supporting the conclusions of this article will be made available by the authors, without undue reservation.
Author Contributions
JS proposed the idea of using deep learning methods for LOCA diagnosis and prediction, established the main structure of the deep learning models used in this work, drafted most part of the manuscript, and coordinated the cooperation of all the co-authors. TS contributed to the programming, testing, and results analysis of the prediction model. SX preprocessed all the training and testing datasets, including using the rolling update method to generate proper test vectors. After building the diagnosis model, YZ finished all the diagnosis experiments and analysis. SL provided key instructions to the group members to ensure accurate and efficient research methodologies. PS and HC performed the simulations that produced all the datasets, using the industry-grade simulation tool. All authors contributed to the article and approved the submitted version.
Conflict of Interest
The authors declare that the research was conducted in the absence of any commercial or financial relationships that could be construed as a potential conflict of interest.
Acknowledgments
We would like to thank the financial and technical support from the following research projects and institutions, including but not limited to: (1) the Special Funds for Basic Scientific Research Business of the Central Universities (531118010070); (2) the Provincial Talents Gathering Project—Innovation Talents Plan (2018RS3050); (3) the Industrial Internet Innovation and Development Project of China: Digital Twin System for Automobile Welding and Casting Production Lines and Its Application Demonstration (TC19084DY); (4) the Special Funds for Construction of Innovative Provinces in Hunan Province of China (No. 2020SK2066, No. 2020GK2016); (5) the Hunan Xiangjiang Artificial Intelligence Academy; (6) the Central Research Institution of the State Power Investment Co. Ltd. (SPIC); and (7) the China Guangdong Nuclear (CGN) Research Institution Co. Ltd.
Supplementary Material
The Supplementary Material for this article can be found online at: https://www.frontiersin.org/articles/10.3389/fenrg.2021.665262/full#supplementary-material
References
Bi, Q., Qin, K., and Li, Z. L. (2019). “Multiple instance dense connected convolution neural network for aerial image scene classification,” in In the Proceedings of IEEE International Conference on Image Processing, (New York: IEEE), 2501–2505.
Feng, J., Wu, X. D., and Chen, J. T. (2019). “Joint multilayer spatial-spectral classification of hyperspectral images based on CNN and convLSTM,” in In Proceedings of IEEE International Geoscience and Remote Sensing Symposium (Japan: Yokohama), 588–591.
Jeong, H. Y. (2002). Prediction of counter-current flow limitation at hot leg pipe during a small-break LOCA. Ann. Nucl. Energy 29, 571–583. doi: 10.1016/s0306-4549(01)00053-6
Kim, D. Y., Yoo, K. H., and Kim, J. H. (2014). Prediction of leak flow rate using fuzzy neural networks in severe post-LOCA circumstances. IEEE Trans. Nucl. Sci. 61, 3644–3652. doi: 10.1109/tns.2014.2357583
Kim, E., and Medioni, G. (2010). “Dense structure inference for object classification in aerial LIDAR dataset,” in In Proceedings of the 20th International Conference on Pattern Recognition, (New York: IEEE), 3049–3052.
Koo, Y. D., Na, M. G., and Kim, K. S. (2018). “Prediction of nuclear reactor vessel water level using deep neural networks,” in In Proceedings of International Conference on Electronics, Information, and Communication, (New York: IEEE), 1–3.
Krizhevsky, A., Sutskever, I., and Hinton, G. E. (2012). ImageNet classification with deep convolutional neural networks. Adv. Neural Inf. Process. Syst. 25, 1106–1114.
Lee, C. K., Kwon, G. Y., and Chang, S. J. (2017). Real-time condition monitoring of LOCA via time–frequency domain reflectometry. IEEE T. Instrum. Meas. 66, 1864–1873. doi: 10.1109/tim.2017.2664578
Mukherjee, S., Ghosh, S., and Ghosh, S. (2019). “Predicting video-frames using encoder-convLSTM combination,” in In Proceedings of IEEE International Conference on Acoustics, Speech and Signal Processing, (United Kingdom: Brighton), 2027–2031.
Na, M. G., Shin, S. H., and Jung, D. W. (2004). Estimation of break location and size for loss of coolant accidents using neural networks. Nucl. Eng. Des. 232, 289–300. doi: 10.1016/j.nucengdes.2004.06.007
Niu, J. W., Li, S. J., and Mo, S. S. (2019). “Affective analysis for video frames using convLSTM network,” in In Proceedings of IEEE International Conference on Communications, (New York: IEEE), 1–6. doi: 10.1109/taffc.2020.3004114
Park, S. H., Kim, J. H., and Na, M. G. (2013). “Rediction of reactor vessel water level using GMDH in severe accidents due to LOCA,” in In Proceedings of IEEE Nuclear Science Symposium and Medical Imaging Conference, (New York: IEEE), 1–4.
Radaideh, M. I., Pigg, C., and Kozlowski, T. (2020). Neural-based time series forecasting of loss of coolant accidents in nuclear power plants. Expert Syst. Appl. 160:2020.
Santhosh, T. V., Kumar, M., and Thangamani, I. (2011). A diagnostic system for identifying accident conditions in a nuclear reactor. Nucl. Eng. Des. 241, 177–184. doi: 10.1016/j.nucengdes.2010.10.024
She, J. K., Xue, S. Y., and Sun, P. W. (2019). The Application of LSTM model to the prediction of abnormal operation in nuclear power plants. Instrumentation 26, 39–44.
Shi, X. J., Chen, Z. R., and Wang, H. (2015). “Convolutional LSTM network: a machine learning approach for precipitation nowcasting,” in In Proceedings of the 29th Annual Conference on Neural Information Processing Systems, (New York: Cornell University), 802–810.
Sun, P. W., Wang, L. B., and Cao, H. S. (2019). “Fault Identification of a small modular reactor based on PCA method,” in In Proceedings of 27th International Conference on Nuclear Engineering, (Ibaraki: Tsukuba International Conference Center).
Sun, P. W., Zhao, H. H., and Liao, L. T. (2017). Control system design and validation platform development for small pressurized water reactors (SPWR) by coupling an engineering simulator and MATLAB/Simulink. Ann. Nucl. Energy 102, 309–316. doi: 10.1016/j.anucene.2016.12.034
Tanim, M. M. H., Ali, M. F., and Shobug, M. A. (2020). “Analysis of Various types of Possible Fault and Consequences in VVER-1200 using PCTRAN,” in 2020 International Conference for Emerging Technology (INCET), (New York: IEEE).
Tian, D., Deng, J., and Vinod, G. (2018). “A constraint-based random search algorithm for optimizing neural network architectures and ensemble construction in detecting loss of coolant accidents in nuclear power plants,” in In Proceedings of the 11th International Conference on Developments in eSystems Engineering, (Huntsville: DeSE), 237–243.
Weglian, J., Riley, J., and Ferrante, F. (2020). “Combining Hazards into a Single-Top Fault Tree,” in 2020 Annual Reliability and Maintainability Symposium (RAMS), (US: IEEE).
Yang, J., Yang, Y., and Deng, C. C. (2019). Best Estimate Plus Uncertainty analysis of a large break LOCA on Generation III reactor with RELAP5. Ann. Nucl. Energy 127:2019.
Yoo, K. H., Koo, Y. D., and Back, J. H. (2017). Identification of LOCA and estimation of its break size by multiconnected support vector machines. IEEE Trans. Nucl. Sci. 64, 2610–2617. doi: 10.1109/tns.2017.2743098
Keywords: CNN, LSTM, ConvLSTM, LOCA, diagnosis, prediction
Citation: She J, Shi T, Xue S, Zhu Y, Lu S, Sun P and Cao H (2021) Diagnosis and Prediction for Loss of Coolant Accidents in Nuclear Power Plants Using Deep Learning Methods. Front. Energy Res. 9:665262. doi: 10.3389/fenrg.2021.665262
Received: 07 February 2021; Accepted: 13 April 2021;
Published: 10 May 2021.
Edited by:
Xianping Zhong, University of Pittsburgh, United StatesReviewed by:
Xingang Zhao, Oak Ridge National Laboratory (DOE), United StatesJiankai Yu, Massachusetts Institute of Technology, United States
Guohua Wu, Harbin Institute of Technology, China
Copyright © 2021 She, Shi, Xue, Zhu, Lu, Sun and Cao. This is an open-access article distributed under the terms of the Creative Commons Attribution License (CC BY). The use, distribution or reproduction in other forums is permitted, provided the original author(s) and the copyright owner(s) are credited and that the original publication in this journal is cited, in accordance with accepted academic practice. No use, distribution or reproduction is permitted which does not comply with these terms.
*Correspondence: Jingke She, c2hlamluZ2tlQGhudS5lZHUuY24=
 Jingke She
 Tianzi Shi
 Shiyu Xue
 Yan Zhu
 Shaofei Lu
 Peiwei Sun
 Huasong Cao
