
95% of researchers rate our articles as excellent or good
Learn more about the work of our research integrity team to safeguard the quality of each article we publish.
Find out more
ORIGINAL RESEARCH article
Front. Energy Res. , 28 June 2021
Sec. Nuclear Energy
Volume 9 - 2021 | https://doi.org/10.3389/fenrg.2021.663341
This article is part of the Research Topic Advanced Nuclear Fuel Technology View all 11 articles
 Quan-yao Ren1*
 Zengping Pu1Ping Chen1
 Liang-ming Pan2*
 Fawen Zhu1*Meiyin Zheng1Haoyu Wang1Lie Wei3Hui He4*
Aiming at understanding the phase distribution characteristics and developing the transition criterion from wall-peak to core-peak phase distribution in a rod bundle channel, air–water two-phase flow experiments were conducted in 5 × 5 rod bundles in the Interfacial Evolution Research Facility at Chongqing University (IERFC). Based on the experimental data, the influences of gas velocity, liquid velocity, mixing vane spacer grid (MVSG), and geometrical size on phase distribution have been analyzed in detail. With the increasing superficial gas velocity and decreasing liquid velocity, the wall-peak phase distribution turned to core-peak. The wall-peak phase distribution was enhanced by an MVSG, and the transition from the transitional phase distribution to the wall-peak phase distribution appeared when the air–water mixture flowed through the MVSG. The gap size was the key factor for the transition of phase distribution in rod bundles. Moreover, the transition criterion from wall-peak to core-peak phase distribution was developed based on present experimental data and the data in the literature, which was also verified based on the limited data. More experiments were recommended to focus on the detailed phase distribution in the rod bundle channel with different geometrical sizes.
•The typical wall-peak and core-peak phase distribution characteristics have been analyzed in vertical rod bundles.
•The influences of gas velocity, liquid velocity, spacer grid, and geometrical size on phase distribution have been discussed.
•The mixing vane spacer grid promoted the transitional phase distribution to convert into wall-peak due to the shear force, stronger turbulence, secondary flow, and smaller bubble size.
•The transition criterion from wall-peak to core-peak phase distribution was developed for rod bundle channels with different geometrical sizes.
As the common phenomena in chemical industry, petrochemical industry, nuclear power, and refrigeration, gas–liquid two-phase flows attracted much attention and were intensively investigated numerically and theoretically. As a complex and open geometry, rod bundle channel was widely applied in the nuclear reactor, heat exchanger, and chemical reactor. Thus, it is crucial to make clear the flow resistance, heat transfer characteristics, chemical reaction rate, and critical heat flux in rod bundles, which is of great significance for the safety and efficiency of the equipment. Furthermore, these crucial properties are always affected by the phase distribution characteristics.
A large amount of work focused on phase distribution in conventional channels, especially in the circular pipe. Serizawa et al. (1975a), Serizawa et al. (1975b), and Akimi et al. (1988) studied the local characteristics of air–water two-phase flow in a round pipe with the diameter of 60 mm experimentally. And two typical phase distribution patterns were identified: wall-peak and core-peak phase distributions. For wall-peak phase distribution, bubbles tended to aggregate near the wall and the near-wall-peaks of void fraction profiles appeared. However, the core-peak phase distribution showed the void fraction peaks at the channel center. Ishii et al. (Hibiki and Ishii, 1999; Hibiki et al., 2001) also found the wall-peak and core-peak phase distributions for air–water two-phase flows in 25.4 and 50.8 mm pipes. Based on the wire mesh sensor, Prasser et al. (2007) presented the evolution of the phase distribution structure in the large pipe with the inner diameter of 195 mm, which showed wall-peak and core-peak void fraction profiles for air–water and steam–water (6.5 MPa) two-phase flows.
Some studies were also devoted to making clear the transition characteristics and criteria of phase distribution. Serizawa et al. (1975a), Serizawa et al. (1975b), and Akimi et al. (1988) demonstrated that the phase distribution pattern was determined by bubble size. Moreover, Zun et al. (1988) summarized the phase distribution data in round pipes with the diameter ranging from 20 to 86.4 mm and developed the phase distribution pattern map in the superficial liquid velocity vs. superficial gas velocity diagram. In addition, Mendez-Diaz et al. (2012) developed the transition criterion from wall-peak to core-peak phase distribution in a circular pipe, which was based on the critical bubble Reynolds number [
Compared with those in a round pipe, the experimental and theoretical studies on phase distribution in the complex channel were scarce, especially those in rod bundles. Hosokawa et al. (2014) measured the local void fraction with the double sensor conductivity probe in detail in 4 × 4 rod bundles, which showed the wall-peak and core-peak phase distributions. With the help of the sub-channel void sensor (SCVS), Arai et al. (2012) discovered the small bubbles tended to migrate toward the rod gap. Based on the four-sensor conductivity probe, Paranjape et al. (2010) and Yang et al. (2013) also presented the wall-peak and core-peak phase distributions in 8 × 8 rod bundles. Yun et al. (2008) reported that bubbles gathered near the rod wall in sub-cooled boiling in 3 × 3 rod bundles; and the bubble layer and void fraction peak values were influenced by heat flux and mass flow rate. Ren et al. (2018a) and Ren et al. (2019) presented the detailed wall-peak void fraction profiles for bubbly flow and core-peak phase distribution for cap bubbly flow in 5 × 5 rod bundles. According to Arai et al. (2012) and Lucas et al. (2007), small bubbles were pushed to aggregate near the rod wall by lift force (Tomiyama, 1998; Tomiyama et al., 2002), while large bubbles were kept away from walls by wall lubrication force (Antal et al., 1991). Based on the above introduction, the schematic of typical wall-peak and core-peak phase distributions in rod bundles is presented in Figure 1, in which the blue circles represent the rods.
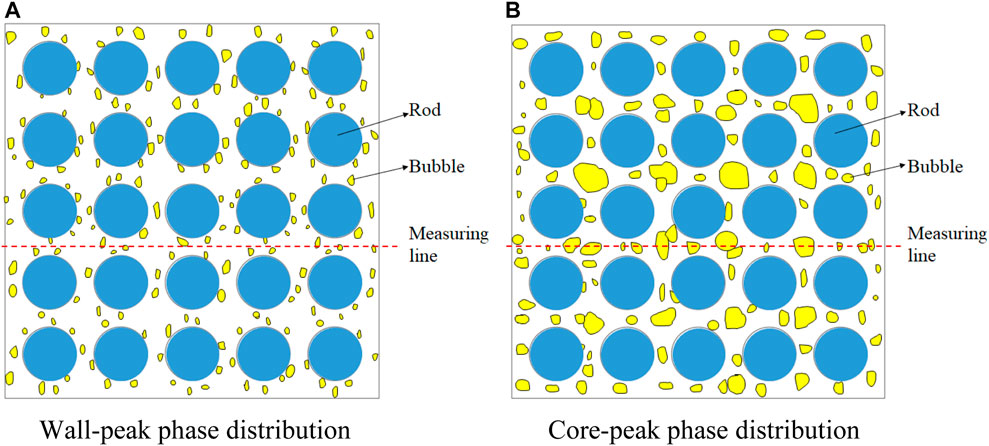
FIGURE 1. Schematic of the typical phase distribution in rod bundles (top view). (A) Wall-peak phase distribution. (B) Core-peak phase distribution.
The spacer grid was an important component of rod-type fuel assembly, which improved the flow turbulence, heat transfer efficiency, and critical heat flux for the nuclear reactor. Yang et al. (2013) pointed out that the simplified spacer grids without mixing vanes produced stronger turbulence and made the large bubbles break up. Ren et al. (2018a) demonstrated that, for the wall-peak void fraction profiles, mixing vane space grids (MVSGs) enhanced the wall-peak phenomenon by giving rise to the larger void fraction peak values near the rod wall at the downstream of the MVSG.
Essentially, the phase distribution was determined by the lateral forces acting on bubbles, which affected the bubble migrating direction and behaviors. According to Lucas et al. (2007), Liao et al. (2015), and Rzehak and Krepper (2013), the bubble lateral force included lift force, wall lubrication force, and turbulent disperse force. The lift force was induced by the liquid velocity gradient around the bubble, whose direction was vertical to liquid velocity. The lift force coefficient CL was positive in the co-current upward flow, and the lift force was toward the direction of decreasing liquid velocity. Tomiyama (1998) and Tomiyama et al. (2002) acquired the correlation of the lift force coefficient by analyzing the single bubble motions in the shear flow field of high-viscosity liquid and predicted that the coefficient of lift force would be negative when the bubble size was larger than 5.8 mm (Lucas et al., 2007). The bubbles were pushed back to the main flow by the wall lubrication force when near the wall. In another way, the wall lubrication force prevented bubbles from “passing through” the wall due to the effect of lift force. On the basis of the wall lubrication force correlation developed by Antal et al. (1991) and Hosokawa et al. (2002), the wall lubrication force was determined by the bubble size, bubble Reynolds number, and
To sum up, although some studies were conducted on the phase distribution characteristics in different rod bundles with the help of different measuring sensors by different researchers, there was no experimental study focusing on the transition mechanisms and criterion from wall-peak to core-peak phase distribution in rod bundles. Compared with that in a circular pipe, two-phase flow in rod bundles was more complex for the limited effect of sub-channel size on large bubbles, the influence of spacer grid, stronger turbulence, and secondary flow. Therefore, it is of great significance to make clear the transition mechanisms and develop the transition criterion from wall-peak to core-peak phase distribution. In this paper, the air–water two-phase flow experiments were performed to acquire the detailed phase distribution characteristics to reveal the influencing mechanisms of different factors acting on the phase distribution. On the basis of the measured data and existing experimental data from the literature, the empirical correlation for the transition from wall-peak to core-peak phase distribution was developed.
The gas–liquid two-phase flow experiments were performed in the Interfacial Evolution Research Facility at Chongqing University (IERFC), as shown in Figure 2. The maximum water volumetric flow rate was 30 m3/h, while the maximum air mass flow rate reached 3,000 SLM (standard liters per minute). In order to produce uniform small bubbles at the inlet of the test section, the air–water mixer was designed, which consisted of four porous metal tubes. Moreover, the phase distribution characteristics at the inlet (Port 0 shown in Figure 3) could be referred from Ren et al. 2018a. More information about the experimental setup could be found in the authors’ previous research (Ren et al., 2018a; Ren et al., 2018b; Ren et al., 2018c; Ren et al., 2018d; Ren et al., 2018e; Liu et al., 2018; Ren et al., 2019; Ye et al., 2019).
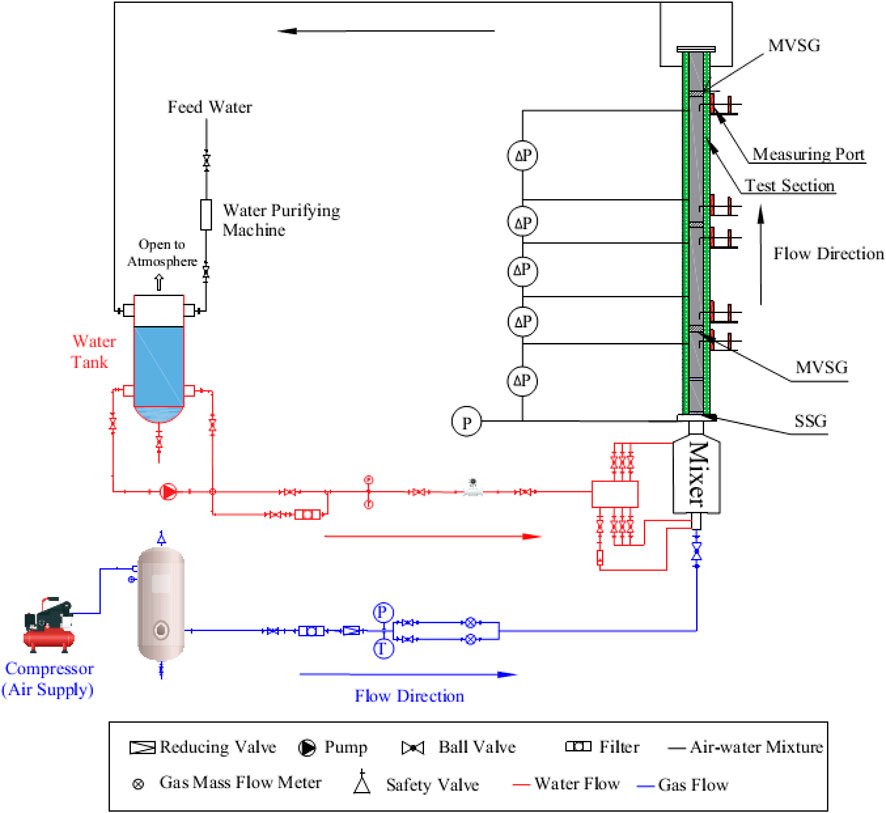
FIGURE 2. Schematic of the experimental facility.
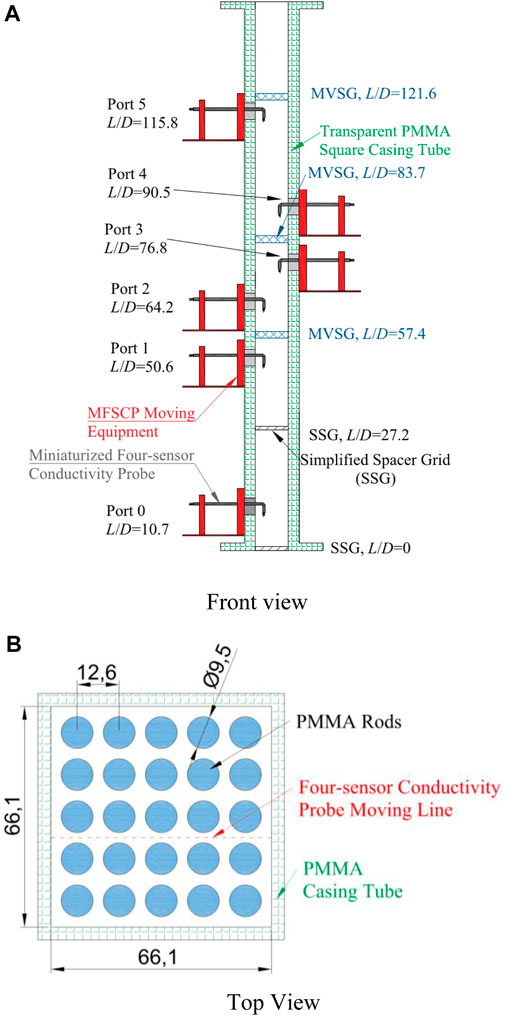
FIGURE 3. Structure of the test section. (A) Front view. (B) Top view.
The test section was made of transparent PMMA (polymethyl methacrylate). The width and length of the square casing tube were 66.1 and 1,500 mm, respectively, and the rod diameter was 9.5 mm, while the rod gap size was 3.1 mm. It should be noted that the gap size played an important role in confining the bubble motion. Two kinds of spacer grids were adopted in the test section: simplified spacer grid [SSG, different from that in Yang et al. (2013)] and mixing vane spacer grid (MVSG). The structure of the SSG is shown in Figure 4, while that of the MVSG can be found in Chen et al. (2017). Detailed description of the test section could be found in Ren et al. (2018a) and Ren et al. (2019).
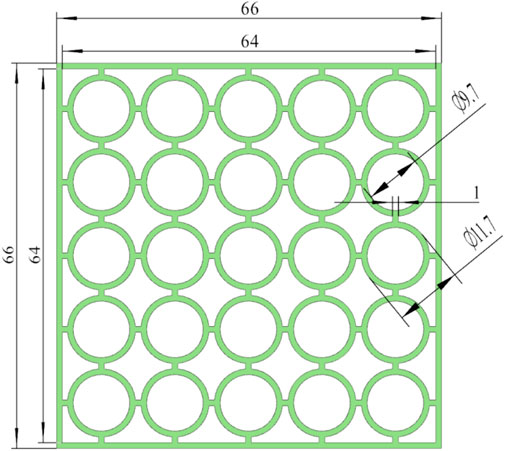
FIGURE 4. Schematic diagram of the simplified spacer grid (SSG).
As shown in Figure 3A, six measuring ports (Ports 0–5) were set for a miniaturized four-sensor conductivity probe (MFSCP) at different axial locations (10.7, 50.6, 64.2, 76.8, 90.5, and 115.8 L/D). It should be noted that, to avoid the disturbance on the flow field, only one MFSCP was installed to measure the local two-phase flow parameters. The moving line of the MFSCP is shown in Figure 3B and Figure 1, and the distance between two neighboring measuring points was about 1.0 mm. The MFSCP was designed based on the large difference of conductance between gas and liquid, which consisted of a stainless steel tube and four acupuncture needles with different lengths. Moreover, the uncertainty of MFSCP was related to the uncertainty of measured voltage, bubble number, sample frequency, and time. Based on the error propagation model, the uncertainty of measured void fraction was about 0.67%. The processing data were demonstrated to be credible with the relative errors of area-averaged void fraction and superficial gas velocity as about 18.5 and 17.8%, respectively. More detailed information on the data processing and verification of the MFSCP could be found in authors’ previous researches (Ren et al., 2018a; Ren et al., 2019; Ren et al., 2021).
The experiments were conducted at the stable flow condition with the preset gas and liquid mass flow rates, which were controlled by the presupposed test conditions shown in Figure 5. And the presupposed superficial gas and liquid velocities in the test conditions were determined on the purpose of covering a larger range of flow velocities and flow regimes. The flow regime transition lines for gas-liquid flow in rod bundle channel proposed by different researchers were also shown in Figure 5, which includes the global flow regime map proposed by Paranjape et al. (2008) based on a plate-type impedance void meter, the theoretical global flow regime transition criteria developed by Liu and Hibiki (2017), and the inner sub-channel flow regime map acquired by Ren et al. (2018d) based on a sub-channel impedance void meter.
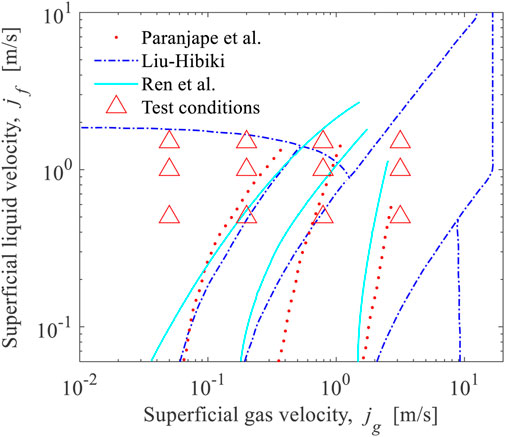
FIGURE 5. Test conditions.
Compared with a circular pipe, the rod bundle channel had more rod walls and produced special phase distribution features. The typical wall-peak and core-peak phase distributions in rod bundles are presented in Figures 6, 7. It should be noted jg denotes the local superficial gas velocity, while jl is the superficial liquid velocity. As shown in Figure 1A, the wall-peak phase distribution meant that the bubbles gathered and flew near the rod walls, which resulted in the peaks of void fraction profiles located near the rod gaps as shown in Figure 6. On the contrary, as shown in Figure 1B, the core-peak phase distribution indicated that the bubbles were more likely to gather and flow in the center of the sub-channels, which gave rise to the peaks of void fraction profiles near the sub-channel center as shown in Figure 7. Wall-peak phase distribution was observed at the flow condition with a lower gas velocity and higher liquid velocity as shown in Figure 6, while the core-peak pattern appeared at the flow condition with a higher gas velocity and lower liquid velocity as shown in Figure 7.
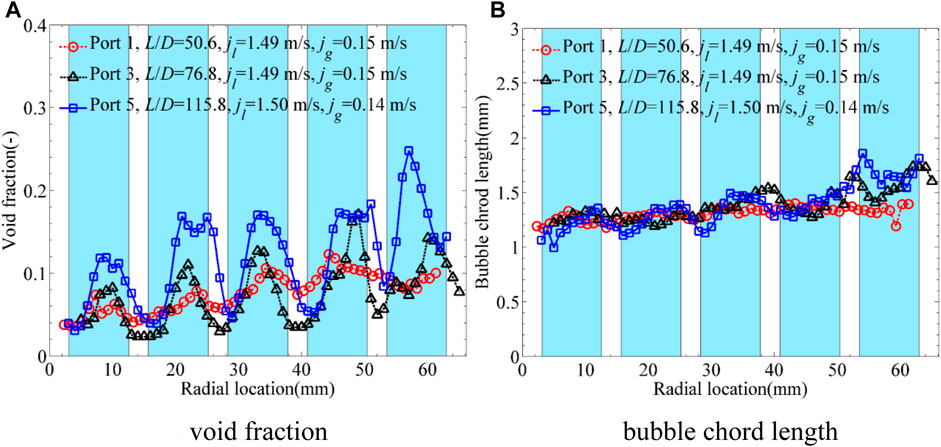
FIGURE 6. Characteristics of wall-peak phase distribution. (A) Void fraction. (B) Bubble chord length.
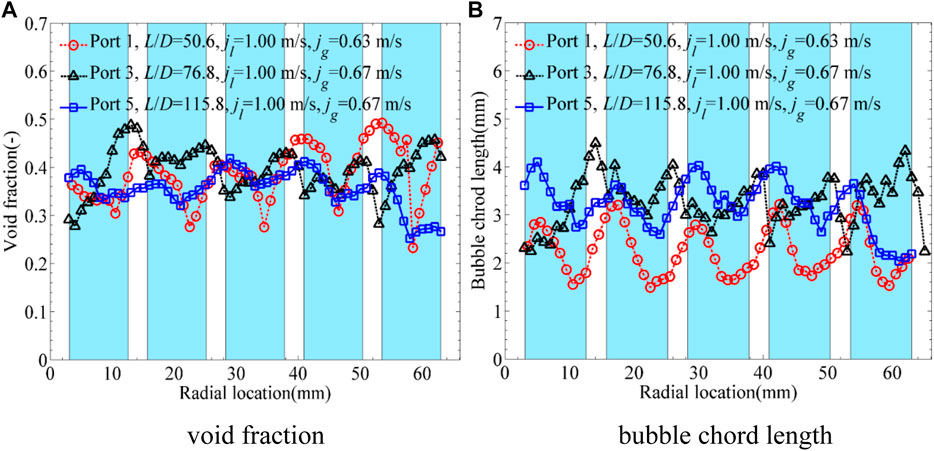
FIGURE 7. Characteristics of core-peak phase distribution. (A) Void fraction. (B) Bubble chord length.
The phase distribution pattern was determined by many factors (Akimi et al., 1988), such as the void fraction, flow regimes, gas velocity, liquid velocity, and bubble size. Serizawa et al. 1975a, Serizawa et al. 1975b, and Mendez-Diaz et al. 2012 reported that phase distribution was mainly affected by bubble size. And the transverse migration of bubbles was determined by the lateral forces in circular pipes (Tomiyama et al., 2002). Furthermore, the bubble lateral forces were affected by bubble size greatly, such as lift force (Tomiyama et al., 2002) and wall lubrication force (Tomiyama, 1998). Therefore, it was necessary to put emphasis on the bubble size when discussing phase distribution characteristics.
As shown in Figure 6, the void fraction peak values increased with flow development in the axial direction, while the bubble chord length did not show large change but remained at about 1.3 mm. Therefore, it was concluded that the phase distribution was determined not only by bubble size but also by other factors, which would be analyzed in The Factors Acting on Phase Distribution. As can be seen in Figure 6, there were some hollows at some peaks of the void fraction profiles at Port 5. It was inferred that some small bubbles coalesced into larger bubbles and larger bubbles tended to move to the sub-channel center under the combined effect of lift force and wall lubrication force; then, hollows at some peaks appeared under the complex effects of the wall-peak phase distribution and the limitation of gap size.
The core-peak phase distribution profiles are shown in Figure 7. However, due to the strong turbulence and secondary flow, the peaks were not located at the sub-channel center exactly. And the bubble chord length increased from about 2 to 3.5 mm with flow development for bubble coalescence. According to Tomiyama et al. (2002), the lift force value changed from positive to negative when the bubble size was larger than 5.8 mm in air–water two-phase flows. Obviously, it could not be applicable to the present multi-bubble flow system in rod bundles directly. However, when compared to the wall-peak phase distribution in Figure 6, it could be deduced that the phase distribution would change from wall-peak to core-peak with the increasing bubble size.
As discussed above, the phase distribution was related to liquid and gas velocities, flow regimes, and bubble size in the circular pipe (Serizawa et al., 1975a; Serizawa et al., 1975b; Akimi et al., 1988). As regard to the complex geometry of the rod bundle channel, the phase distribution was affected by rod diameter, gap size, spacer grid, bubble size, gas and liquid flow rates. In this section, the influencing factors acting on phase distribution will be analyzed, including superficial gas velocity, superficial liquid velocity, MVSG, and geometrical size.
As shown in Figure 8, the wall-peak phase distribution changed to core-peak with the gas velocity increasing at
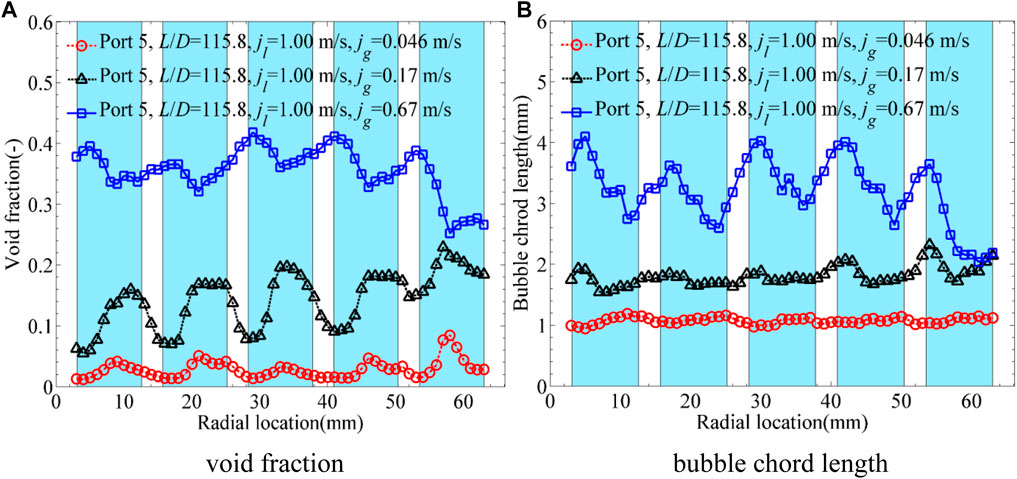
FIGURE 8. Influence of superficial gas velocity on phase distribution. (A) Void fraction. (B) Bubble chord length.
With the increasing superficial liquid velocity, the phase distribution characteristics at jgatm ≈ 0.20 m/s are shown in Figure 9. It should be noted that jgatm represented the superficial gas velocity at the atmosphere pressure. The local superficial gas velocity jg was different because of the different local pressures. The core-peak phase distribution was not so apparent at
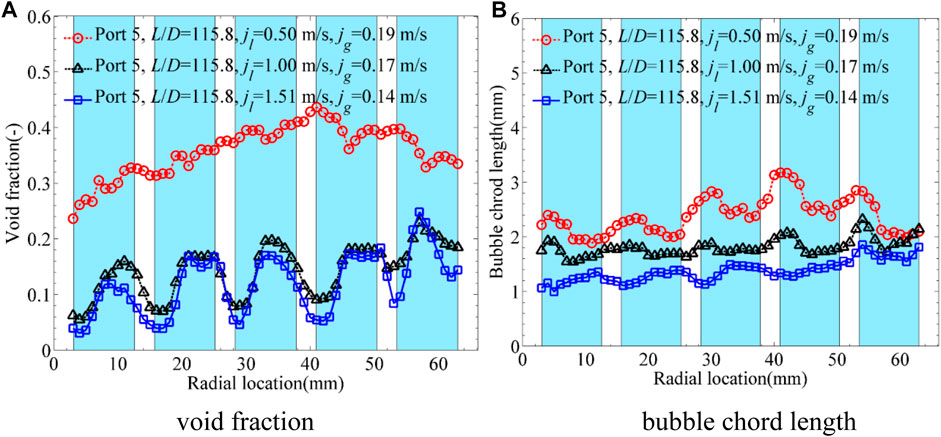
FIGURE 9. Influence of superficial liquid velocity on phase distribution. (A) Void fraction. (B) Bubble chord length.
In the authors’ previous study (Ren et al., 2018a; Ren et al., 2019), the effects of the MVSG were summarized as stronger turbulence, stronger secondary flow, bubble breakup, bubble lateral movement, low pressure region downstream of the MVSG, and recirculating flow behind mixing vanes. The influences of MVSG on the wall-peak, transitional, and core-peak phase distributions are shown in Figures 10–12, respectively. It should be noted that Ports 3 and 4 were located upstream and downstream of the MVSG, respectively, as shown in Figure 3. As shown in Figure 10, the MVSG promoted the larger wall-peak values and smaller bubble size for wall-peak phase distribution. However, the larger void fraction peak values near the wall improved the heat transfer resistance between the heated wall and main flow, which needs more attention in the design of a spacer grid. As shown in Figure 11, the transitional phase distribution showed large hollows near the rod gaps upstream of the MVSG while presented typical wall-peak features at the downstream of the MVSG. In a similar way, the smaller bubble size was produced by the MVSG for the stronger turbulence and shear force, which promoted the transition from transitional phase distribution to wall-peak phase distribution. With regard to core-peak phase distribution shown in Figure 12, the MVSG led to smaller bubble size, but the phase distribution was still maintained as the core-peak phase distribution at the downstream of the MVSG. To sum up, the MVSG enhanced the wall-peak phase distribution and promoted the transition from the transitional phase distribution to the wall-peak phase distribution, but it was hard to promote the transition from the typical core-peak phase distribution to the wall-peak phase distribution.
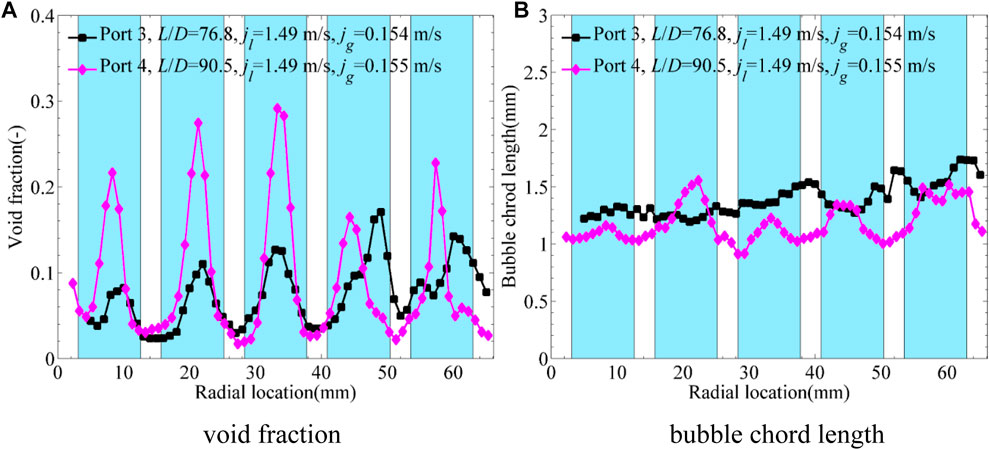
FIGURE 10. Influence of MVSG on wall-peak phase distribution (Ren et al., 2018a). (A) Void fraction. (B) Bubble chord length.
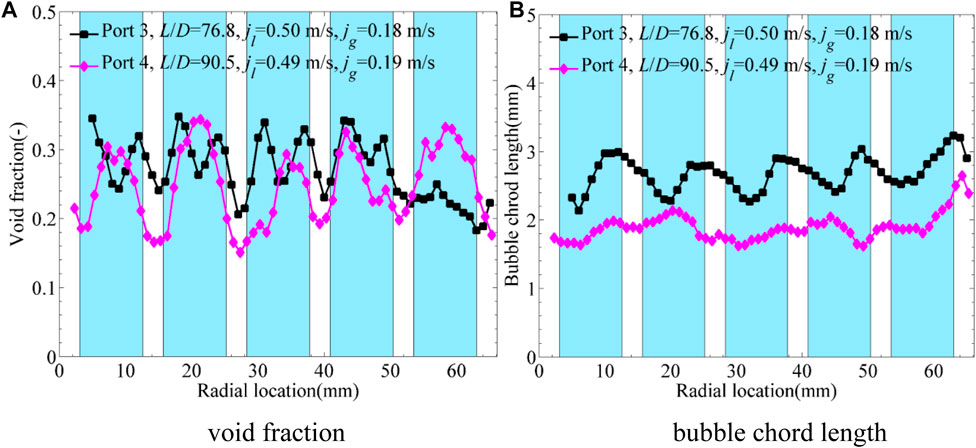
FIGURE 11. Influence of MVSG on transitional phase distribution. (A) Void fraction. (B) Bubble chord length.
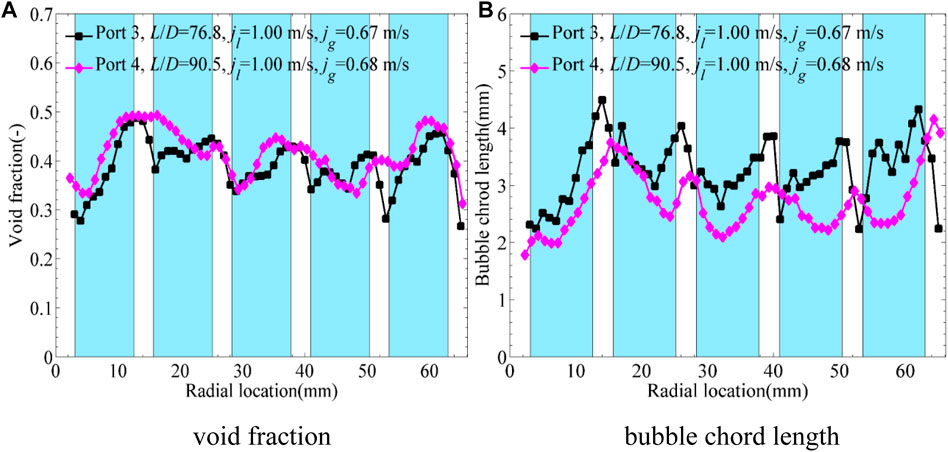
FIGURE 12. Influence of MVSG on core-peak phase distribution. (A) Void fraction. (B) Bubble chord length.
As discussed above, the gap size was the main factor limiting the bubble size and affecting the phase distribution. The phase distribution patterns acquired in different rod bundles are presented in Figure 13, including present data in 5 × 5 rod bundles with the gap size of 3.1 mm, Yang’s data (Yang, 2015; Yang, 2011) in 8 × 8 rod bundles with the gap size of 6.4 mm, Hosokawa’s data (Hosokawa et al., 2014) in 4 × 4 rod bundles with the gap size of 2.5 mm, Arai’s data (Arai et al., 2012) in 10 × 10 rod bundles with the gap size of 3.0 mm, and Julia’s data (Yun et al., 2008) in 3 × 3 rod bundles with the gap size of 8.4 mm. It should be noted that Julia’s data was obtained in the sub-cooled boiling flow, while all of the others’ data were acquired in air–water two-phase flow. Moreover, Yang’s data (Yang, 2015; Yang, 2011) only consisted of the two-phase flow parameters just at the sub-channel centers and rod gaps, which increased the difficulty and uncertainty in recognizing the phase distribution patterns. And the transition lines from wall-peak to transitional and core-peak phase distribution for a circular pipe in Figure 13 were proposed by Akimi et al. (1988) based on the phase distribution data in different circular pipes. As shown in Figure 13, the transition lines in the circular pipe proposed by Akimi et al. (1988) were not fit for the gas–liquid flow in the rod bundle channel.
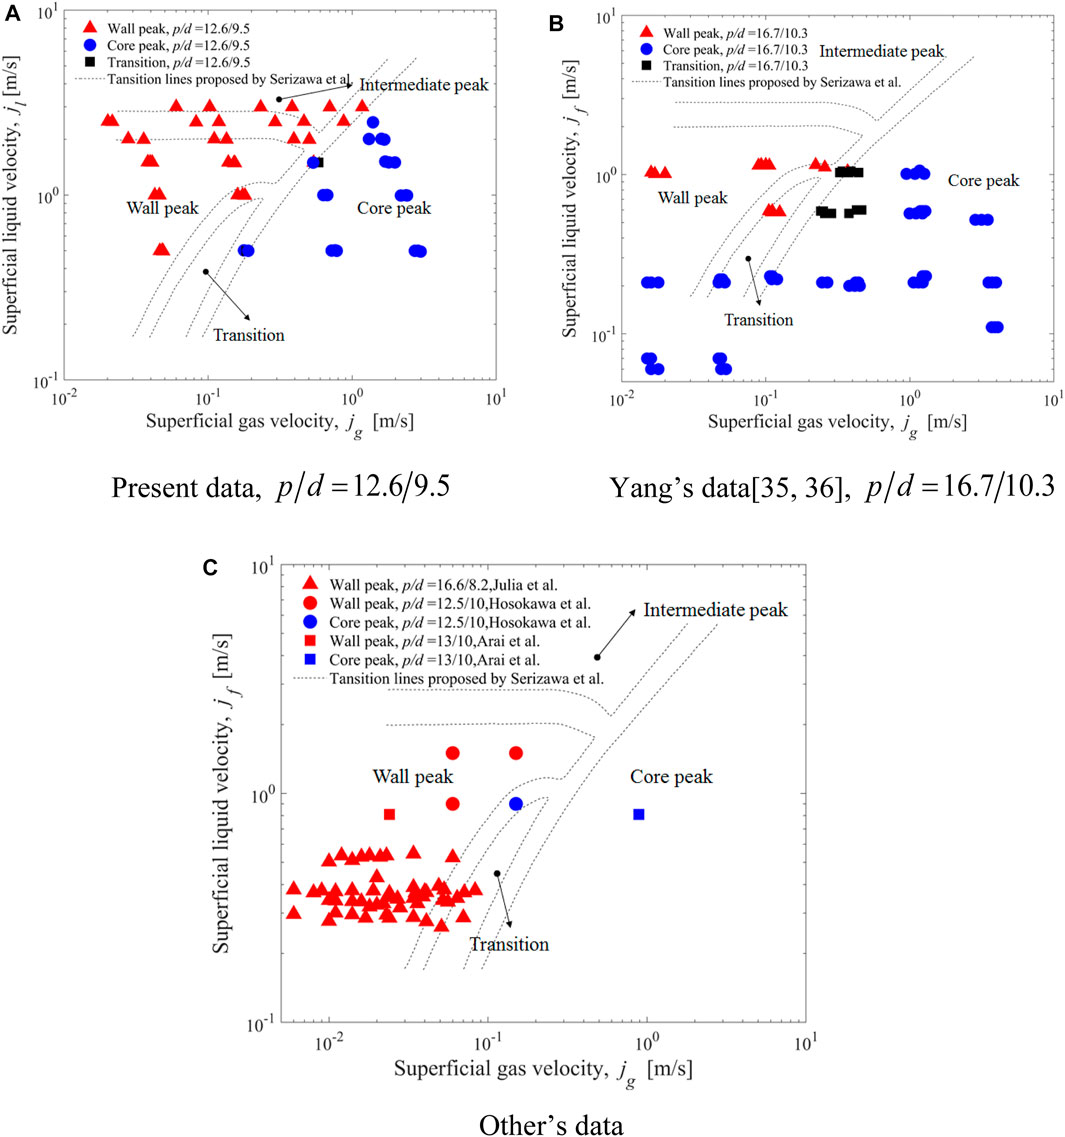
FIGURE 13. Influence of geometrical size on phase distribution. (A) Present data,
As shown in Figure 13B, the wall-peak phase distribution was hard to appear at low liquid velocity (not larger than 0.23 m/s), which resulted from that the liquid turbulence was not strong enough to produce small bubbles. As for Julia’s data (Yun et al., 2008), there were no core-peak flow conditions, which were attributed to the small bubble size in the sub-cooled boiling flow and large gap size (8.4 mm). Based on the comparison among present data, Yang’s data (Yang, 2011; Yang, 2015), and Hosokawa’s data (Hosokawa et al., 2014) shown in Figure 13, the transition from wall-peak to core-peak phase distribution appeared at a lower superficial gas velocity in the rod bundle channel with the smaller gap size.
Based on the critical bubble Reynolds number and
Based on the above discussions, phase distribution was related to many parameters, including bubble size, void fraction, gas and liquid densities, relative velocity, surface tension, distance from the bubble to the wall, liquid turbulence, bubble Reynolds number, and
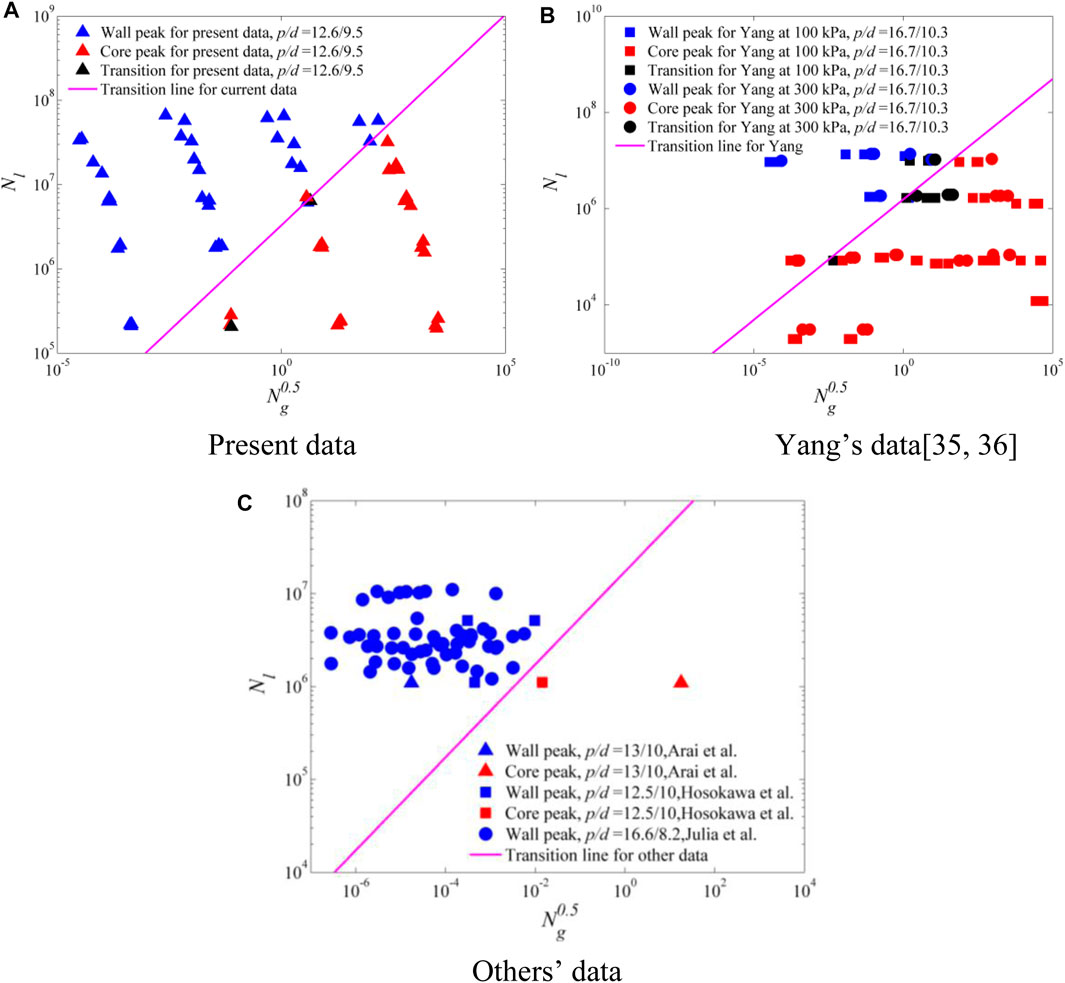
FIGURE 14. Transition lines for different data. (A) Present data. (B) Yang’s data (Yang, 2011; Yang, 2015). (C) Others’ data.
Aimed at developing the dimensionless transition criterion, the data points are plotted in Figure 15 by taking the coefficient C and dimensionless gap size
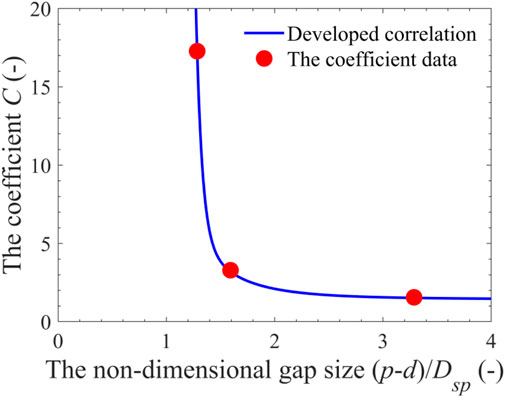
FIGURE 15. Fitting curve for the coefficient C.
In order to verify the transition criterion, the data acquired by Yun et al. (2008) and Arai et al. (2012) were adopted. And
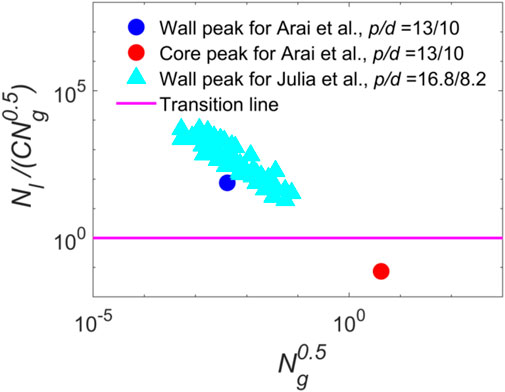
FIGURE 16. Verification of the transition criterion.
In this work, air–water two-phase flow experiments were performed to make clear the phase distribution characteristics and develop the transition criterion from wall-peak to core-peak phase distribution in rod bundles. Based on the analysis on experimental data, the phase distributions in rod bundles were related to many factors, such as the bubble size, void fraction, gas and liquid densities, gas and liquid velocities, surface tension, distance from the bubble to the wall, MVSG, geometrical size, liquid turbulence, and bubble lateral forces. By dividing the influencing factors into the enhancing and restraint factors, the dimensionless correlation for the transition from wall-peak to core-peak phase distribution in rod bundles was developed. Some important conclusions are listed as follows:
•With the increasing superficial gas velocity and decreasing liquid velocity, the wall-peak phase distribution turned to the core-peak pattern.
•For present flow conditions, the MVSG enhanced the wall-peak phase distribution and promoted the transitional phase distribution to turn to wall-peak, but it was hard to promote the transition from the typical core-peak phase distribution to the wall-peak phase distribution.
•The wall-peak phase distribution was hard to appear at low liquid velocity (not larger than 0.23 m/s) for the weak liquid turbulence according to the experimental data in the literature (Yang, 2011; Yang, 2015).
•The geometrical size of the rod bundle channel had great influence on the transition from wall-peak to core-peak phase distribution in rod bundles, especially the gap size.
•The dimensionless transition criterion from wall-peak to core-peak phase distribution was proposed based on present data, Yang’s data (Yang, 2011; Yang, 2015), and Hosokawa’s data (Hosokawa et al., 2014) while verified against Julia’s data (Yun et al., 2008) and Arai’s data (Arai et al., 2012).
It should be noted that the developed transition model needed much more experimental data to amend and verify. More experiments were suggested to focus on the transition from wall-peak to core-peak phase distribution in rod bundle channels with different geometrical sizes.
The original contributions presented in the study are included in the article/Supplementary Material, and further inquiries can be directed to the corresponding authors.
Q-YR: carrying out experiments, data processing and writing draft paper. ZP: paper reviewing. PC: project administration and funding support. L-MP: paper reviewing and supervision. FZ: data processing and writing editing. MZ: project administration and investigation. HW: investigation and carrying out experiments. LW: data processing and paper revising. HH: carring out experiments and data processing.
The authors are grateful for the support of the Natural Science Foundation of China (Grant Nos. 51676020 and 51706026) and National Key R&D Program of China (Grant No. 2018YFE0116100).
The authors declare that the research was conducted in the absence of any commercial or financial relationships that could be construed as a potential conflict of interest.
Akimi, S., and Kataoka, I. (1988). “Phase Distribution in Two-phase Flow,” in Transient Phenomena in Multiphase Flow. Editor N. H. Afgan (New York: Hemisphere Pub. Corp.), 179–223.
Antal, S. P., Lahey, R. T., and Flaherty, J. E. (1991). Analysis of Phase Distribution in Fully Developed Laminar Bubbly Two-phase Flow. Int. J. Multiphase Flow 17, 635–652. doi:10.1016/0301-9322(91)90029-3
Arai, T., Furuya, M., Kanai, T., and Shirakawa, K. (2012). Development of a Subchannel Void Sensor and Two-phase Flow Measurement in 10×10 Rod Bundle. Int. J. Multiphase Flow 47, 183–192. doi:10.1016/j.ijmultiphaseflow.2012.07.012
Burns, A. D., Frank, T., Hamill, I., and Shi, J. M. (2004). “The Favre Averaged Drag Model for Turbulent Dispersion in Eulerian Multi-phase Flows,” in 5th International Conference on Multiphase Flow (Yokohama, Japan).
Chen, X., Du, S., Zhang, Y., Yu, H., Li, S., Peng, H., et al. (2017). Validation of CFD Analysis for Rod Bundle Flow Test with Vaned Spacer Grids. Ann. Nucl. Energ. 109, 370–379. doi:10.1016/j.anucene.2017.05.055
Hibiki, T., and Ishii, M. (1999). Experimental Study on Interfacial Area Transport in Bubbly Two-phase Flows. Int. J. Heat Mass Transfer 42, 3019–3035. doi:10.1016/s0017-9310(99)00014-9
Hibiki, T., Ishii, M., and Xiao, Z. (2001). Axial Interfacial Area Transport of Vertical Bubbly Flows. Int. J. Heat Mass Transfer 44, 1869–1888. doi:10.1016/s0017-9310(00)00232-5
Hosokawa, S., Tomiyama, A., Misaki, S., and Hamada, T. (2002). Lateral Migration of Single Bubbles Due to the Presence of Wall, ASME 2002 Fluids Engineering Division Summer Meeting, Montreal, QC, Canada.
Hosokawa, S., Hayashi, K., and Tomiyama, A. (2014). Void Distribution and Bubble Motion in Bubbly Flows in a 4×4 Rod Bundle. Part I: Experiments. J. Nucl. Sci. Technol. 51, 220–230. doi:10.1080/00223131.2013.862189
Ishii, M., and Zuber, N. (1979). Drag Coefficient and Relative Velocity in Bubbly, Droplet or Particulate Flows. Aiche J. 25, 843–855. doi:10.1002/aic.690250513
Kim, S., Fu, X. Y., Wang, X., and Ishii, M. (2000). Development of the Miniaturized Four-Sensor Conductivity Probe and the Signal Processing Scheme. Int. J. Heat Mass Transfer 43, 4101–4118. doi:10.1016/s0017-9310(00)00046-6
Liao, Y., Rzehak, R., Lucas, D., and Krepper, E. (2015). Baseline Closure Model for Dispersed Bubbly Flow: Bubble Coalescence and Breakup. Chem. Eng. Sci. 122, 336–349. doi:10.1016/j.ces.2014.09.042
Liu, H., and Hibiki, T. (2017). Flow Regime Transition Criteria for Upward Two-phase Flow in Vertical Rod Bundles. Int. J. Heat Mass Transfer 108, 423–433. doi:10.1016/j.ijheatmasstransfer.2016.12.029
Liu, H., Pan, L.-M., Hibiki, T., Zhou, W.-X., Ren, Q.-Y., and Li, S.-S. (2018). One-dimensional Interfacial Area Transport for Bubbly Two-phase Flow in Vertical 5 × 5 Rod Bundle. Int. J. Heat Fluid Flow 72, 257–273. doi:10.1016/j.ijheatfluidflow.2018.06.006
Lucas, D., Krepper, E., and Prasser, H.-M. (2007). Use of Models for Lift, wall and Turbulent Dispersion Forces Acting on Bubbles for Poly-Disperse Flows. Chem. Eng. Sci. 62, 4146–4157. doi:10.1016/j.ces.2007.04.035
Mendez-Diaz, S., Zenit, R., Chiva, S., Muñoz-Cobo, J. L., and Martinez-Martinez, S. (2012). A Criterion for the Transition from wall to Core Peak Gas Volume Fraction Distributions in Bubbly Flows. Int. J. Multiphase Flow 43, 56–61. doi:10.1016/j.ijmultiphaseflow.2012.02.012
Paranjape, S., Stefanczyk, D., Liang, Y., Hibiki, T., and Ishii, M. (2008). Global Flow Regime Identification in a Rod Bundle Geometry in 16th International Conference on Nuclear Engineering Orlando, Florida, USA.
Paranjape, S., Ishii, M., and Hibiki, T. (2010). Modeling and Measurement of Interfacial Area Concentration in Two-phase Flow. Nucl. Eng. Des. 240, 2329–2337. doi:10.1016/j.nucengdes.2009.11.009
Prasser, H.-M., Beyer, M., Carl, H., Gregor, S., Lucas, D., Pietruske, H., et al. (2007). Evolution of the Structure of a Gas-Liquid Two-phase Flow in a Large Vertical Pipe. Nucl. Eng. Des. 237, 1848–1861. doi:10.1016/j.nucengdes.2007.02.018
Ren, Q.-Y., Pan, L.-M., Zhou, W.-X., Du, S.-J., and Li, Z.-C. (2018a). Phase Distribution Characteristics of Bubbly Flow in 5 × 5 Vertical Rod Bundles with Mixing Vane Spacer Grids. Exp. Therm. Fluid Sci. 96, 451–459. doi:10.1016/j.expthermflusci.2018.04.002
Ren, Q-Y., Pan, L-M., Zhou, W-X., Ye, T-P., Liu, H., and Li, S-S. (2018b). “Comparison of Drift-Flux Models for Void Fraction Prediction in Sub-channel of Vertical Rod Bundles,” in 26th International Conference on Nuclear Engineering London, England. doi:10.1115/icone26-81435
Ren, Q.-Y., Pan, L.-M., Zhou, W.-X., Liu, H., and Ye, T.-P. (2018c). Drift-flux Model of Sub-channel in Vertical Rod Bundles with Spacer Grids. Int. J. Heat Mass Transfer 126, 946–956. doi:10.1016/j.ijheatmasstransfer.2018.05.135
Ren, Q.-Y., Zhou, W.-X., Du, S.-J., Li, Z.-C., and Pan, L.-M. (2018d). Sub-channel Flow Regime Maps in Vertical Rod Bundles with Spacer Grids. Int. J. Heat Mass Transfer 122, 1138–1152. doi:10.1016/j.ijheatmasstransfer.2018.01.133
Ren, Q.-Y., Pan, L.-M., Zhou, W.-X., Liu, H., Ye, T.-P., Yu, B., et al. (2018e). Measurement of Subchannel Void Fraction in 5 × 5 Rod Bundles Using an Impedance Void Meter. Meas. Sci. Technol. 29, 104004. doi:10.1088/1361-6501/aad5c3
Ren, Q-Y., Pan, L-M., Zhou, W-X., Pu, Z-P., Zheng, M-Y., Wang, H-Y., and Wei, L. (2019). “Phase Distribution Characteristics of Cap Bubbly Flow in 5 × 5 Vertical Rod Bundles with Mixing Vane Spacer Grids,” in 27th International Conference on Nuclear Engineering (Japan:Tsukuba).
Ren, Q-Y., Pan, L-M., Pu, Z-P., Zhu, F-W., and Hui, H. (2021). Two-group Phase Distribution Characteristics for Air-Water Flow in 5 × 5 Vertical Rod Bundle Channel with Mixing Vane Spacer Grids. Int. J. Heat Mass. Tran 176, 121444. doi:10.1016/j.ijheatmasstransfer.2021.121444
Rzehak, R., and Krepper, E. (2013). Bubble-induced Turbulence: Comparison of CFD Models. Nucl. Eng. Des. 258, 57–65. doi:10.1016/j.nucengdes.2013.02.008
Serizawa, A., Kataoka, I., and Michiyoshi, I. (1975a). Turbulence Structure of Air-Water Bubbly Flow-II. Local Properties. Int. J. Multiphase Flow 2, 235–246. doi:10.1016/0301-9322(75)90012-9
Serizawa, A., Kataoka, I., and Michiyoshi, I. (1975b). Turbulence Structure of Air-Water Bubbly Flow-III. Transport Properties. Int. J. Multiphase Flow 2, 247–259. doi:10.1016/0301-9322(75)90013-0
Tomiyama, A., Tamai, H., Zun, I., and Hosokawa, S. (2002). Transverse Migration of Single Bubbles in Simple Shear Flows. Chem. Eng. Sci. 57, 1849–1858. doi:10.1016/s0009-2509(02)00085-4
Tomiyama, A. (1998). Struggle with Computational Bubble Dynamics. Multiphase Sci. Technol. 10, 369–405.
Yang, X., Schlegel, J. P., Liu, Y., Paranjape, S., Hibiki, T., and Ishii, M. (2013). Experimental Study of Interfacial Area Transport in Air-Water Two Phase Flow in a Scaled 8×8 BWR Rod Bundle. Int. J. Multiphase Flow 50, 16–32. doi:10.1016/j.ijmultiphaseflow.2012.10.006
Yang, X. (2011). Experimental Study of Two-phase Flow in Rod Bundle. West Lafayette, IN, USA: Purdue University.
Yang, X. (2015). Experimental and Analytical Study of Interfacial Area Transport in Rod Bundle Two-phase Flow. West Lafayette, IN, USA: Purdue University.
Ye, T.-P., Pan, L.-M., Ren, Q.-y., Zhou, W.-X., and Zhong, T. (2019). Experimental Study on Distribution Parameter Characteristics in Vertical Rod Bundles. Int. J. Heat Mass Transfer 132, 593–605. doi:10.1016/j.ijheatmasstransfer.2018.12.008
Yun, B.-J., Park, G.-C., Julia, J. E., and Hibiki, T. (2008). Flow Structure of Subcooled Boiling Water Flow in a Subchannel of 3 × 3 Rod Bundles. J. Nucl. Sci. Technol. 45, 402–422. doi:10.1080/18811248.2008.9711450
Keywords: phase distribution, wall-peak, core-peak, two-phase flow, rod bundles
Citation: Ren Q-y, Pu Z, Chen P, Pan L-m, Zhu F, Zheng M, Wang H, Wei L and He H (2021) Experimental Study on the Transition Characteristics and Criterion From Wall-Peak to Core-Peak Phase Distribution in Vertical Rod Bundles. Front. Energy Res. 9:663341. doi: 10.3389/fenrg.2021.663341
Received: 02 February 2021; Accepted: 03 June 2021;
Published: 28 June 2021.
Edited by:
Yingwei Wu, Xi’an Jiaotong University, ChinaReviewed by:
Juliana P. Duarte, Virginia Tech, United StatesCopyright © 2021 Ren, Pu, Chen, Pan, Zhu, Zheng, Wang, Wei and He. This is an open-access article distributed under the terms of the Creative Commons Attribution License (CC BY). The use, distribution or reproduction in other forums is permitted, provided the original author(s) and the copyright owner(s) are credited and that the original publication in this journal is cited, in accordance with accepted academic practice. No use, distribution or reproduction is permitted which does not comply with these terms.
*Correspondence: Quan-yao Ren, cmVucXVhbnlhb0Bmb3htYWlsLmNvbQ==; Liang-ming Pan, Y25lbmdAY3F1LmVkdS5jbg==; Fawen Zhu, emh1ZmF3ZW4xOTgzQDEyNi5jb20=; Hui He, TUVfaGVodWlAc2p0dS5lZHUuY24=
Disclaimer: All claims expressed in this article are solely those of the authors and do not necessarily represent those of their affiliated organizations, or those of the publisher, the editors and the reviewers. Any product that may be evaluated in this article or claim that may be made by its manufacturer is not guaranteed or endorsed by the publisher.
Research integrity at Frontiers
Learn more about the work of our research integrity team to safeguard the quality of each article we publish.