 Mariusz Niekurzak*†
 Ewa Kubińska-Jabcoń†
- Faculty of Management, AGH University of Science and Technology, Krakow, Poland
Background: The growing consumption is what drives the development of unsustainable energy and material-intensive production technologies that emit large quantities of pollutants into the atmosphere, water, and land. Obtaining green energy allows reduction of the interference with the environment and, consequently, fits into a sustainable energy development strategy. In order to achieve the emission targets set by the EU for Poland, it is necessary to prioritize the development of renewable energy sources (RES) technologies within the energy sector.
Methods: The purpose of the study was to present the results of the research relating to the return on investment of solar collectors for single-family houses in Poland. The research was presented on the basis of the legal conditions applicable to micro installations in the light of the amendment of the RES Act, and the impact of these amendments on the aspects of such investment was determined.
Results: On the basis of the constructed economic model used to assess the return on investment of increasing the area of solar collectors, it has been shown that an operating installation will bring measurable economic benefits in the form of reduction in the amount of energy purchased annually in the amount of 6,756 kWh and environmental benefits in the form of reduction of carbon dioxide emissions to the atmosphere 2.4–3.6 Mg per year. An installation subsidized under the “My Electricity” program can reach an NPV of EUR 6,000 over 20 years at a discount rate r = 0 and assuming that the electricity is EUR 0.15/kWh. If the price rises to 0.2 EUR/kWh, the NPV will be 10,000 EUR. For the analyzed installation, the investment consisting in increasing the collector area in accordance with NPV is economically effective for the absorber area in the range of 5.6–7.6 m2 and reaches the maximum value for the absorber area of 6.6 m2, while the absorber area above 7 m2 contributes to reduce the value of the economic return on investment. The obtained results have been generalized, which allows to use them in the process of selecting the size of collector area for similar installations.
Conclusion: The return on investment analysis carried out in respect of a detached house allowed to demonstrate that this project is fully justified. Furthermore, pursuant to the Renewable Energy Sources Act in force in Poland, treating a small entrepreneur as a prosumer who may generally take advantage of favorable conditions for discounting the produced energy leads to very favorable possibilities of settling electricity. Considering an entrepreneur as a prosumer who may use one-off depreciation of a solar collectors installation as a fixed asset and request for VAT refund is what makes such an investment very attractive in financial terms and makes it difficult to find a safe investment alternative characterized by such a high rate of return.
Introduction
Environmental pollution, depletion of conventional fuels, and global warming seem to be among the main problems encountered by the humanity in the 21st century. The fossil fuel energy production process is largely responsible for anthropogenic greenhouse gas emissions, acid rain, and other negative health and environmental impacts. Furthermore, in 2018, the consumption of electricity in Poland increased by ca. 1.7% and thus reached the highest level in the history of our country—171 TWh (Derski, 2019). At the same time, domestic production reached ca. 165.3 TWh, which is a reduction by 0.3% as compared with the previous year. As a result of these processes, we had to import 5.7 TWh of energy from Ukraine, Sweden, and Lithuania. One of the solutions aimed at improving the level of Poland’s energy security and reducing its harmful impact on the environment is to make wider use of alternative energy sources. Due to the support of government programs, the solar collector sector may be one of the fastest growing (RES) sectors in Poland and worldwide. The solar collector market in Poland has a huge but so far highly untapped development potential. According to forecasts, the solar energy industry will become the largest producer of renewable energy not only in Poland but also in the world, larger than producers of water and wind energy; consequently, the solar energy industry will produce more electricity than all nuclear power plants in the world (IEO Instytut Energetyki Odnawialnej, 2019; CIRE.PL, 2020).
When planning an investment in solar collectors, the user is mainly interested in both its energy efficiency and economic viability. Investments in renewable energy sources (including solar collectors or a panels PV) are not low-budget investments in Poland, but the available nonrefundable subsidies and favorable financing for the purchase and installation of solar collectors may make them gain popularity in Poland. The main reason is the cost-effectiveness of purchasing and using green systems for power generation. The cost-effectiveness analysis carried out in respect of a detached house allowed to demonstrate that this project is fully justified. Furthermore, pursuant to the Renewable Energy Sources Act in force in Poland, treating a small entrepreneur as a prosumer who may generally take advantage of favorable conditions for discounting the produced energy leads to very favorable possibilities of settling electricity. Considering an entrepreneur as a prosumer who may use one-off depreciation of a solar collectors installation as a fixed asset and request for VAT refund is what makes such an investment very attractive in financial terms and makes it difficult to find a safe investment alternative characterized by such a high rate of return.
The novelty of this article is the presentation of how the rate of return on investment in solar collectors is calculated on the example of a single-family building, taking into account Polish climatic conditions. In addition, this study checks the ecological benefits (assessment of the possibility of avoiding CO2) of using solar installations in the cofinancing programs for this type of projects. On the basis of the conducted research, the energy gains and the amount of CO2 emission reduction were determined.
Renewable Energy Sources and the European Union
The development of (RES) and, consequently, the battle against climate change are some of the most important topics of the last few years. Such actions are considered a priority in the energy policy of the Member States of the European Union, which have set themselves ambitious targets for both reducing greenhouse gas emissions and the share of renewable energy. Pursuant to Directive 2009/28/EC (Directive, 2009), 28 Member States are required to ensure a certain share of energy from renewable sources in gross final energy consumption in 2020. It is the EU’s goal to achieve in the European Community 20% of energy from renewable sources by the end of 2020 and at least 32% by 2030 (Directive, 2009; Eurostat Statistics Explained, 2020).
What should be emphasized here is that each country has its own objectives, which have been set at levels that are achievable. The span is considerable, since Malta is to reach only 10%, while Sweden as much as 49% (Eurostat Statistics Explained, 2020). In Poland, on the other hand, the share of energy from renewable sources in gross final energy consumption was set at 15%. Poland, like Bulgaria, the Czech Republic, or Romania, is still strongly dependent on lignite energy and has not yet developed a specific plan aimed at changing this situation (Janoś, 2020). However, thanks to the considerable reduction in the cost of solar energy, solar collectors are increasingly being chosen by both households and the private sector as an investment that allows making significant savings.
In recent years, however, the development of RES, and in particular the solar collector technology, has been largely dependent on state policies and the introduced support solutions, for example, “My Electricity,” “Clean Air,” or “Energy Plus” (Olczak et al., 2020b; Benalcazar et al., 2020). The purpose of these programs was to enable Poland to achieve the EU target of 15% share of RES. In Poland, we have recently observed a real demand for solar energy. The solar collector market is the fastest growing market of all RES sectors. In 2019, Poland achieved an increase in new capacity of ca. 0.9 GW and was ranked among the top five of all Member States of the European Union with a 5.5% capacity increase (Newseria BIZNES, 2019). After Spain and Germany, the largest increase in the installed solar collectors’ capacity in the European Union is to be recorded this year by The Netherlands (2.5 GW) and France (1.1 GW) (SolarPower Europe, 2020; IEA, 2019). Taking into account the current and real investments in progress and the trends, in 2021, Poland may improve its 5th place in terms of the annual increase in the new solar collectors’ capacity. What affects this value is the installations that have already been constructed and all those that are yet to be constructed, that is, projects from the second RES auction that have not yet been completed, some of the projects from the third RES auction, new installations at business, and individual prosumers. RES auctions are tenders announced by the President of the Energy Regulatory Office, thanks to which it is possible to sell energy generated by RES installations. These types of auctions are organized at least once a year. As a result, the accumulated capacity of solar collectors in Poland at the end of 2020 may reach 2.5 GW, which would allow Poland to join the top 10 EU countries in terms of the accumulated solar collectors’ capacity (IEO Instytut Energetyki Odnawialnej, 2019).
The undisputed leader in terms of the installed capacity in the European solar collector industry is Germany, which already has solar collector power stations of the total capacity exceeding 50 GW, and the current number of German investments in solar collectors does not decrease. In the first four months of 2020 alone, Germany installed 1.48 GW. Europe’s second largest solar collector market is Italy, where the total capacity of solar collector power stations already exceeds 21 GW, but it has not been growing so fast recently. The capacity of the solar collector power stations built in Italy last year was lower than that in Poland (ca. 737 MW, which was the best result of the Italian solar collector sector in the last 6 years). The third largest market in Europe as regards solar collectors’ capacity is the United Kingdom. Currently, the United Kingdom has solar collector power stations of the capacity of ca. 13.3 GW. Apart from the aforementioned countries, there are several other countries in Europe that have the total solar collectors’ potential higher than the capacity of 2 GW achieved by Poland, including France, Spain, The Netherlands, or Turkey. Poland is now approaching the levels reached in the Czech Republic, where the solar collector market has been stagnating for several years, but where the solar collectors boom observed a decade ago, driven by high feed-in tariffs, has now brought the Czech solar collectors’ potential to ca. 2.2 GW. In recent months, Poland has overtaken Romania (1.37 GW), Austria (1.27 GW), and Bulgaria (1.4 GW) in terms of the installed solar collectors’ capacity.
The reason for this increase is subsidies granted in Poland in the form of government programs: My Electricity, Clean Air, Energy Plus, and Agroenergy (intended for farmers). These programs allow for financing the purchase and installation of new solar collectors (IEO Instytut Energetyki Odnawialnej, 2019; CIRE.PL, 2020; SolarPower Europe, 2020; IEA, 2019). In addition, the large increase in installed capacity in Poland results from the amendment of the law (The Sejm of the Republic of Poland, 2019), which creates the possibility of high interest in energy production by prosumers. In the amendment of the Renewable Energy Sources Act, a number of significant changes were introduced to the support system for electricity generated from solar collectors, such as extension of the definition of a prosumer to companies for which energy production does not constitute the predominant objects and offers them an opportunity to exercise the right to discounts, energy settlement in longer billing periods, no necessity to prepare a construction design for the smallest micro installations of up to 9 kW, the possibility of locating micro installations in areas which are not intended for production purposes, entry into force of the so-called thermo-modernization relief in personal income tax, etc. The relief allows natural persons to deduct from their taxable base the expenses incurred, among others, on solar collectors and accessories, as well as their installation. However, the deduction may not exceed EUR 12,050, and in September 2019, the VAT rate for solar collectors functionally linked to a building of the area of up to 300 m2 was harmonized. All such systems are subject to 8% VAT (The Sejm of the Republic of Poland, 2019).
Solar Collectors and PV Panels: Green Energy Used in Households
What is the greatest problem in the Polish energy sector is the sustained, growing cost trend (OECD, 2020; Ministry of State Assets, 2019; Kaplan and Kopacz, 2020; Ministry of Culture and Environment, 2020; Tomasik et al., 2018; Weather data and software for solar power investments, 2020; NFEPWM, 2020). With energy prices frozen by law in 2019 in Poland (at the level of June 2018) and constantly rising costs, it will not be possible to avoid high price increases in 2021. The further increase in energy costs in Poland and prices (within 2–3 years) will have to be shared by all energy consumers, including households, but also industry, farmers and public utilities. These regulations apply to the entire territory of Poland (CIRE.PL, 2020; Janoś, 2020). Furthermore, this thesis is confirmed by the high electricity prices in Poland as compared to other EU countries. As it stems from Eurostat data, among Member States of the European Union, electricity prices for households were the highest in the second half of 2019 in the following Member States: Denmark (0.2924 EUR/kWh), Germany (0.2873 EUR/kWh), and Belgium (0.2860 EUR/kWh), while the lowest electricity prices were recorded in Bulgaria (0.0958 EUR/kWh) and Hungary (0.1097 EUR/kWh). Poland, with the average rate of 0.1376 EUR/kWh, is one of the countries in the middle of this list (Eurostat Statistics Explained, 2020). It may be observed that from year to year, total prices have fallen in 10 EU Member States, including Poland, where tax reductions are relating to the installation of renewable energy sources. A similar downward trend may be observed in Poland for non-household consumers, which is another argument for investing in the RES and, in particular, solar collectors or panels PV.
The argument for investing in panels PV or solar collectors installations in Poland is that solar radiation provides a number of benefits, such as lightweight design, no emissions or noise, no need for constant operation, and the ability to operate in different weather conditions. What has to be considered before making a decision on which installation to choose is the cost of their construction, durability, and efficiency. These criteria should be the basis for the selection, from a range of models available on the market, offered by global manufacturers, of solar collectors that will provide 70% of the desired energy on average during the year and 100% during the summer months.
Although both solutions differ significantly in structure, operation, and type of obtained energy, sometimes, they are confusing. Solar collectors and photovoltaic panels are two systems that enable the acquisition and processing of solar energy. Panels (photovoltaic modules) are used to convert the energy of solar radiation into electricity. The energy obtained in this way has a wide range of applications. It can be used to illuminate the building, as well as power electrical and electronic devices. In turn, solar collectors convert the energy of solar radiation into thermal energy. In this way, the collectors can heat domestic water, support the operation of central heating, or serve to heat water in a swimming pool. Both solar collectors and photovoltaic panels are energy-saving solutions, but the profitability of investments of each solar system should be considered in the context of their use.
Solar Collector Market in Poland as Compared With Other EU Countries
The solar collector market in Poland has a huge but so far highly untapped development potential. At the end of 2018, the total capacity of the RES installations connected to the power grids, as identified by the Office for Energy Regulation (Kowalski, 2020), was 8,593 MW, and the solar collectors’ sources accounted for only 1.7% of licensed sources, but after 5 years of incubation in a niche, the solar collector technology has a chance to become the second (after onshore wind power) RES technology in Poland within a few years.
In 2025, the total installed capacity in solar collectors may reach 7.8 GW, which means that already in 2025, the capacity of solar collectors sources will exceed the capacity assumed in the National Energy and Climate Plan for 2030 (CIRE.PL, 2020).
The observed and forecast growth of the market of installed solar energy is largely possible thanks to subsidies in the form of government programs: “My Electricity,” “Transparent Air,” “Energy Plus,” and “Agroenergy,” and the change in regulations allowing households to engage in energy generation and feed into grid made in 2016 (The Sejm of the Republic of Poland, 2019), which creates the possibility of a large interest in the production of green energy.
Thanks to the support of government, EU programs, and the amendment of the national law, the RES industry was the only industry that was able to mobilize more capital for investment between 2019 and 2020 than the entire conventional energy sector. This industry is also able to win the confidence of Polish and foreign capital investors, which is confirmed by the stock exchange index IEO (Ministry of Development, 2020), presented in Figure 1.
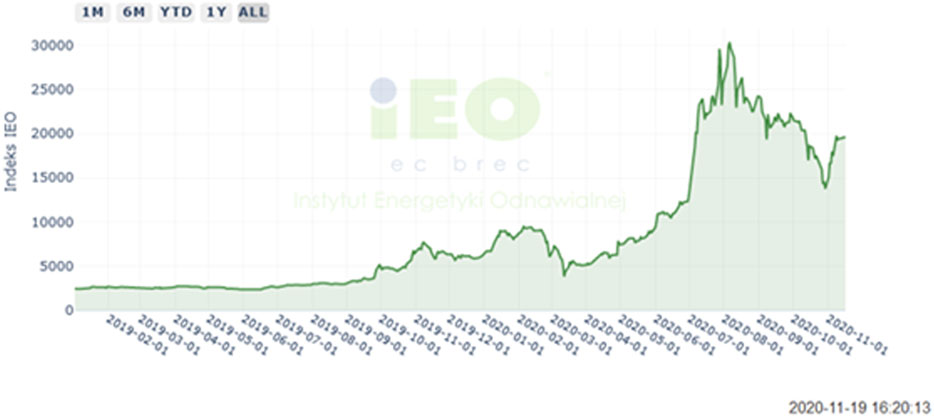
FIGURE 1. The indicator of the economic situation of the solar collector market in Poland (Ministry of Development, 2020).
As a result of analyzing the extremely dynamic solar collector market, the Institute of Renewable Energy developed the first, copyright stock exchange indicator called IEO. The indicator includes the listings of solar collector companies operating on NewConnect and on the main floor of the Warsaw Stock Exchange. It is a simple and transparent indicator of the economic situation of the solar collector market in Poland.
Meteorological Possibilities of Using Solar Collectors Installations in Poland
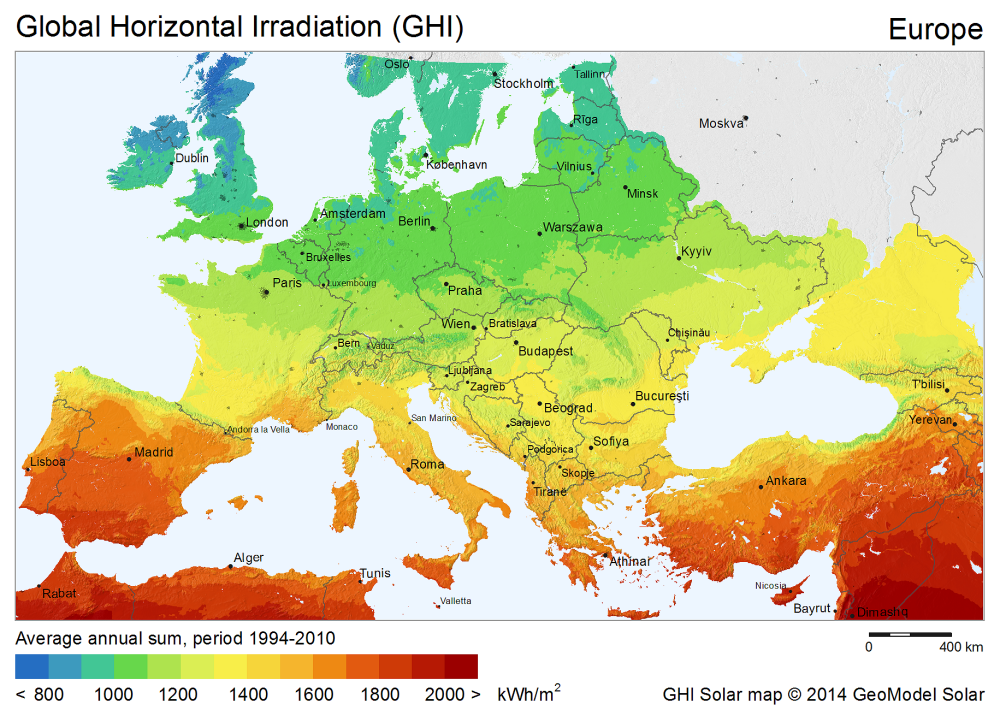
What is an important assumption determining the return on investment of investing in the solar collectors is, apart from lower electricity bills, a favorable level of insolation over the Polish territory. Each region of Poland has different conditions, such as cloudiness, lie of the land, latitude, and longitude. Meteorological conditions have a significant impact on the efficiency of solar collectors and are connected with the most important parameters determining the potential of solar energy use, such as solar intensity (W/m2), total solar radiation (J/m2), and insolation. These parameters define both total radiation and its components, that is, direct and diffuse radiation. In Poland's latitudes, the sum of direct and diffuse radiation reaching the earth’s surface may have the maximum instantaneous value of 1 kW/m2. The greatest amount of solar energy in Poland reaches the collector surface in June when the sky is cloudless, when the sun is at its highest point above the horizon (62.4°). In December, on the other hand, this energy is much lower because the Sun is at the lowest point (15.5°) (Global solar Atlas, 2020; NASA Solar Radiation, 2020; Chwieduk and Chwieduk, 2020; Zelazna et al., 2020; The World Bank, 2020). Summer months are characterized by the greatest number of hours of insolation; direct radiation may constitute 90% of the total radiation reaching the earth and thus reach 1,050 W/m2. During the same period, but when the sky is completely clouded, only diffuse radiation reaches the earth’s surface, and its value varies between 50 and 150 W/m2. In the period from October to March, the number of hours of insolation is the smallest, and, in addition, the reception of this small amount of energy is reduced by stronger winds and lower air temperatures. Therefore, when calculating the rate of return on investment in solar collectors, one should take into account the insolation, which, depending on the season and region in Poland, is different and thus a different return on investment.
Figure 2 presents a map of average insolation in particular regions of Poland. It is assumed that the greatest amount of insolation in Poland occurs in the southeastern part of the country and reaches ca. 1,624 h/year.
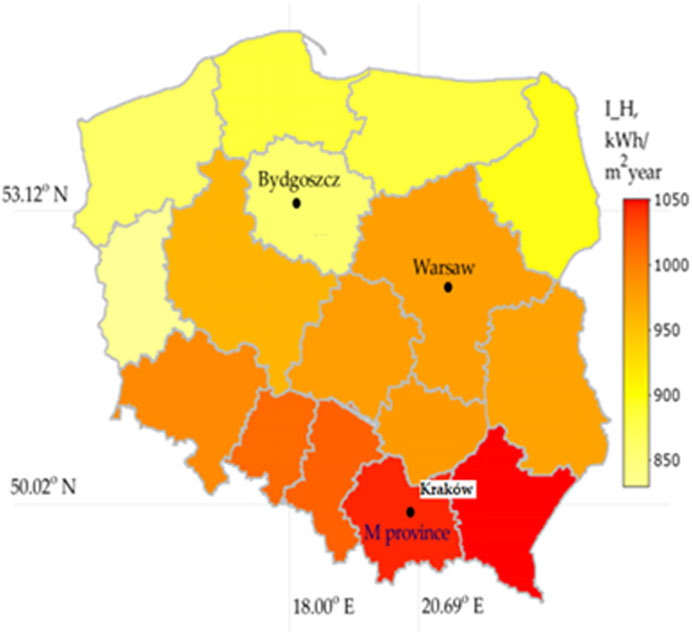
FIGURE 2. Map of average insolation values (Olczak et al., 2021).
Poland is located between 49° and 54.5° north latitude in a temperate climate zone. The daytime, that is, the time from sunrise to sunset covers over 51% of 8,767 h per year. This period is 24 h longer in the northern ends of the country than in the southern ends of Poland. In winter, the situation is different; the daytime in the southern part of Poland lasts almost 1 h longer than in the northern part. In the summer, the opposite is the case. In June in the northern ends of Poland, the daytime hours are 71.5% of the hours in the month, in the center—69%, and in the south—67%. In December, there are only 29.5% daytime hours in the north, 31.7% in the center, and 34.7% in the south. A conclusion that may be drawn on the basis of the results of the research on Poland’s insolation is that it is profitable to install solar collectors in practically every place in Poland, but there are regions where the sun “shines more.” The above-average profits from the installation may be achieved by the inhabitants of the southeastern part of Poland (The World Bank, 2020; Kreft et al., 2020).
It is noteworthy that if the solar collector surface may not be oriented to the south, then a flat position of the collector should be used. The above does not affect the fact that with a 30° inclination of the collector with the orientation of 45° east or west from the south, the yield level is 95% of the optimum yield. If the collector is directed to the east or west, the yield is up to 85%, provided that the inclination of the collector is between 25° and 40°. A steep collector position is the best design solution, which allows obtaining the same amounts of energy throughout the year and avoiding inclination angle below 20° in order to protect the collector from contamination (Calise et al., 2019). However, as it stems from the latest research, it is possible to increase the sum of solar radiation per inclined surface (as specified in Table 1) in relation to horizontal surfaces by 30%.

TABLE 1. Optimal angle of inclination of the solar collector in different periods of its use in Poland (Kreft et al., 2020).
Figure 3 presents daily radiation power in Poland in the most favorable period and the least favorable period during the year.
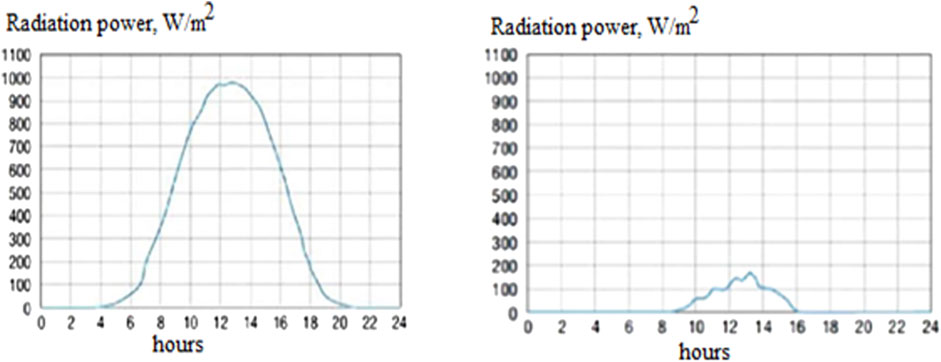
FIGURE 3. Daily radiation power in Poland: (A) on a cloudless day in June, (B) on a cloudy day in December (weather data and software for solar power investments, 2020).
Climatic conditions in Poland have the greatest impact on the return on investment of solar collectors and the possibility of using solar radiation energy. A significant part of the potential for solar technology may be found in small roof installations. Assuming that a good-class solar collector may provide from 1 square meter ca. 500 kWh, 1.8 GJ of thermal energy may be obtained per year. For this purpose, it should be assumed that in order to achieve the above condition, the area of the collectors should be ca. 740 km2. Until long-term energy storage technologies are developed, their use will be the most effective, in particular in spring and winter.
Materials and Methods
Return on Investment Analyses
The purpose of the research was to determine the return on investment of using solar collectors in a single-family residential building for one calendar year, with local weather conditions, as exemplified by Cracow in Poland. On the basis of the collected data and the adopted assumptions, calculations were made to estimate the amount of energy that may be obtained in the form of heat. A single-family house of the area of 150 m2 was subjected to economic analysis. The demand for thermal energy is 16,000 kWh, including 6,000 kWh for hot water preparation and 10,000 kWh for heating. Hot water temperature: tw = 50°C, cold water temperature: tz = 7°C. Radiation conditions, reaching 1,000 kWh/m2 per year with the average annual insolation of 1,600 h, are favorable. In addition, the solar collectors will be installed on the roof, positioned to the south, and the angle of inclination to the surface will be 45°. The calculations will be made for a vacuum collector of the actual absorption area A ≈ 6.5 m2, efficiency η = 0.8, and daily output of 300 dm3. The number of vacuum tubes is 20, the tube lengths are 1,800 mm, and the diameter is 58 mm. The height of the collector is 1,975 mm and its weight is 93 kg, Po = 4.5 kW.
These parameters are taken from the technical specifications of individual devices, technical standards, and national requirements for the installation of solar collectors in Poland. Parameters are averaged for a given roof area and building volume. When making similar calculations, one should take into account the amount of insolation that varies in a given territory of Poland and has an impact on the return period of investment in a given solar installation.
On the basis of the collected data and the adopted assumptions, calculations were made to estimate the amount of energy that may be obtained in the form of heat, depending on the absorber area. The amount of heat, adjusted appropriately taking into account the existing demand for heat, allows determination of the NPV, assuming the price of energy from the replaced heat source. Next, the internal rate of return (IRR) was calculated (Olczak et al., 2018; Zdyb and Gulkowski, 2020):
where CFi—net cash flow expected in year i (i = 1, 2…n), N—initial investment outlay, k—appropriate market capitalization rate, n—the lifetime of the project effect in years, NCFi—net cash flows, Pi—revenue of the year, and Ni—expenditure of the year.
where IRR—internal rate of return, i1—interest rate, NPV > 0, i2—interest rate, NPV < 0, PV—NPV calculated in accordance with
The data used for the calculation are derived from measurements made on an actual solar installation, which allows comparison of the results with other installations. The obtained heat yield Ustj was referred to the radiation for an average year. In addition, the calculations were made with the use of the radiation model according to the following formula (Olczak et al., 2020a; Zamasz et al., 2020):
where Unyjn—measured solar yield in month j, year y, kWh/month; Iptj—insolation on a flat surface by average year in month j, kWh/(square meter × month); and Injy—measured solar radiation of the flat surface in month j, year y, kWh/(square meter × month), y—measurement years.
Since the insolation of Ijrw is a stochastic variable, in the further calculations, the insolation was assumed on the basis of the value drawn with the use of the Monte Carlo method (CSO, 2019; Kryzia et al., 2020; Kryzia et al., 2020). The model of statistical deviations of solar yields used in the simulation describes relationship (2). The simulation allowed adjustment of the average solar yields to the average insolation and its standard deviation over the years, taking into account the amount of the heat demand.
where Iptj—insolation of a flat surface in month j of a typical meteorological year, kWh/(m2 × months); sd (Iptj)—standard deviation of the insolation from that in a typical meteorological year in month j, kWh/(m2 × months).
In order to improve the economic effect, it was proposed to increase the area of the absorbers. Furthermore, on the basis of actual measurements from this installation, reflecting the influence of many nonmeasurable factors on the efficiency of solar energy conversion, simulations of the economic effect were made for different heat demand volumes. The obtained results have been generalized, which allows their usage in the process of selecting the size of collector area for similar installations.
Reduction of CO2 Emission
One of the advantages of building solar collectors installations is the ability to reduce greenhouse gas emissions. The analysis considered two factors, the benefit of reducing CO2 emissions from the combustion of fossil fuels energy electricity emission factor in Poland, kgCO2/kWh (EECO2), and CO2 emissions that arise during the production cycle of solar collector CO2 emission factor for solar collectors, kgCO2/kWh (EFSCCO2). In Poland, the CO2 emission factor per kWh for end users of electricity (according to KOBiZE) is 0.765 kgCO2/kWh. Since the emission factor depends on the type of fuel (brown coal, hard coal), the analysis of EECO2 has been carried out for a range of 0.4–1 kg CO2/kWh. It has been assumed that during solar collector production, the EFSCCO2 changes in the range of 20–85 gCO2/kWh (Ren et al., 2020; Louwen et al., 2016; Mohammadi et al., 2018; Jäger-Waldau et al., 2020; National Center for Emissions Management, 2020).
where ACO2—the amount of CO2 emission avoided, Mg/year; EAG—annual energy gains, kWh/year; EECO2—energy electricity emission factor in Poland, kgCO2/kWh; and EPVCO2—CO2 emission factor for PV, kgCO2/kWh.
Of course, reducing CO2 emissions is a secondary issue and has no impact on the return on the planned investment. However, it should be emphasized that solar installations can be used as an ecological potential source of energy production. Thanks to this, we contribute to reducing the emission of electricity and heat generation.
Results and Discussion
Return on Investment Analyses
The investment outlays relating to the extension of the system for the preparation of hot water with a solar system for the analyzed building were made in accordance with the methodology presented below.
The energy produced by a solar collector during the year is calculated with the use of the following formula:
where G—annual radiation, A—absorber surface, and η—collector efficiency.
The heat loss in the supply lines and exchanger is ca. 10%, or 520 kWh. The amount of electricity supply required for the system (pump and controller) is ca. 100 kWh. The net energy of the system is as follows:
In order to heat 300 dm3 of water to 50°C, there must be supplied the heat energy of the following value:
Assuming the heat loss of 15% in the system, the amount of thermal energy to be supplied to the system during the day is obtained as follows:
that is, the annual energy consumption will be:
For the collector to be able to heat 300 dm3 of water to 50°C on average per year, it has to work over the following time:
Assuming that the amount of energy in the daytime during the whole year changes within the range of 0–5 kWh/m2, at full insolation, the power of the collector will be as follows:
and the time required to heat up 300 dm3 will be as follows:
In this case, the efficiency of the system will be as follows:
The calculation shows that the average annual savings that may be achieved when heating water with the use of solar collectors amount to EUR 550:
The main factor influencing the degree of return on investment of the solar collectors application is its purchase price—the lower the price, the quicker rate of return (with similar equipment efficiency) (Burgio et al., 2020). In the domestic market, there are representatives of many companies specializing in solar collectors. These systems differ in quality, technical specification, price, and efficiency (Zdyb and Gulkowski, 2020). The system selected for this particular analysis is a system with two panels of vacuum collectors with a collector area of 6.5 m2 and the final price of 4,500 EUR. The costs connected with the operation of the system are assumed to reach EUR 50. Taking into account the investment and operating costs as well as profit for different conventional energy carriers, the payback time presented in Tables 2 and 3 was obtained.
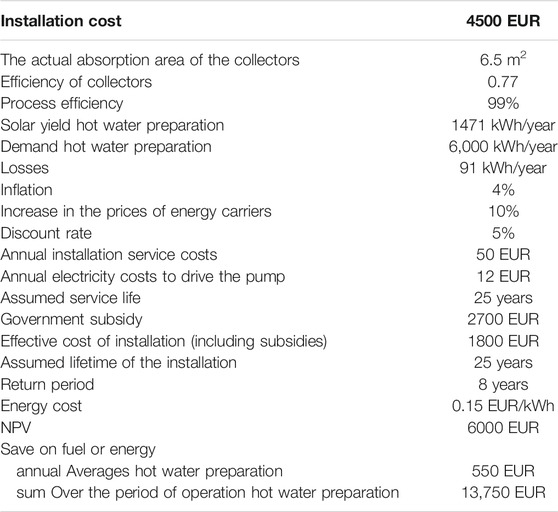
TABLE 2. Data used to calculate the payback time of the investment.
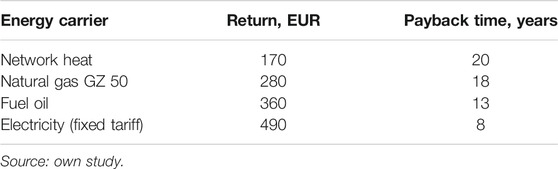
TABLE 3. Profit obtained from saving of different conventional energy carriers for one year and the payback time in the event of the replacement of different conventional energy carriers.
The investment related to the use of solar collectors for single-family buildings will pay for itself after 8 years. Taking into account the average service life of the collectors at the level of 20–25 years, the investment is profitable because already in the tenth year of operation, it will bring tangible profits. What also affects the investment return on investment is the area of the absorber used for calculations (Żołądek et al., 2019). On the basis of the collected data and the adopted assumptions, calculations were made to estimate the amount of energy that may be obtained in the form of heat, depending on the absorber area. The amount of heat, adjusted appropriately taking into account the existing demand for heat, allows to determine the NPV, assuming the price of energy from the replaced heat source. Next, the internal rate of return (IRR) was calculated. Figure 4 shows that the annual solar yields increase proportionally to the area of the absorber. Within the range of 2–5 m2, they reach 800 kWh and 1,800 kWh, respectively, for the extreme values. In contrast, they differ by 600 kWh between 6 and 12 m2.

FIGURE 4. Dependence of annual corrected solar yields for the analyzed system as a function of the absorber area. Source: own study.
On the basis of the obtained results concerning heat yields, the applicable heat price, and fixed and variable costs, NPVs may be calculated as a function of the absorber area, in accordance with the following formula and the internal rate of return (IRR). For the analyzed installation, the investment in the extension of the collector area in accordance with the NPV is economically effective for the absorber area within the range of 5.6–7.6 m2 and reaches the maximum value for the absorber area of 6.6 m2, while the absorber area of more than 7 m2 contributes to reducing the value of economic return on investment measures. For example, assuming that the heat demand for preparation of Q of hot water is 6,000 kWh/year in a single-family house and the area of the absorbers is 4 m2, then the NPV is negative (−533 EUR). Changing the area of absorbers to 6 m2 will result in changing the NPV by EUR 778 as compared with the current NPV (and will amount to EUR 245). The calculations are based on the assumption that the water is heated directly in the absorber of the solar panel. Furthermore, on the basis of map charts that may be drawn up for any place in Poland, the user may select the most economically effective area of the collector absorber, taking into account the user’s heat demand for hot water preparation. Figure 5 shows a map of the effective solar yields as a function of the absorber surface.
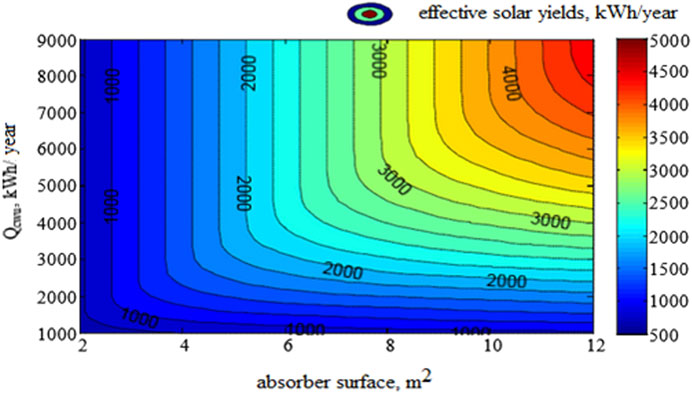
FIGURE 5. Diagram of examples of effective solar yields as a function of the absorber area and heat demand for hot water preparation. Source: own study.
Extending the water heating system with a solar system is economically justified (in the event of similar technological solutions) if the annual heat demand is greater than 3,000 kWh. The minimum area of the absorber for a family of five should not reach less than 5 m2. What significantly impacts the economic efficiency is the investment cost, which may vary considerably depending on the level of cofinancing. Furthermore, the amendment of the RES Act of 2019 assumes the following:
• the prosumer may use the power grid as an energy storage, provided that he/she has signed a comprehensive contract for the provision of electricity distribution and sale services;
• in the event of installations of the capacity of up to 10 kWp, the prosumer may take 0.8 kWh for each 1 kWh of energy introduced to the grid and in the event of installations of the capacity of up to 50 kWp—0.7 kWh for each 1 kWh of energy introduced to the grid;
• the prosumer does not pay any additional fees to the energy seller for the settlement of the energy input and output—for energy taken from the grid (previously introduced to it), he/she only pays fixed fees relating to energy distribution;
• in the event of solar collectors micro installations, the related formalities come down to reporting this fact to the local electricity provider and signing an amendment to the agreement with the energy distributor;
• noncash settlement of the amount of energy within the discount system takes place on an annual basis.
Reduction of CO2 Emission
The analysis of ecological effects was carried out on the basis of the results of calculations of the amount of energy obtained from solar collectors installed in a single-family house. The characteristics of the house, the results of calculations of the domestic water heat demand, and the parameters of the selected collectors are presented in Return on Investment Analyses. The basis for calculating the amount of saved fuel and the related amount of reduction of emissions of combustion products was the determined energy demand for heating utility water. The amount of emission reduction depends on the type of fuel saved and the parameters of the conventional heating device. To calculate air pollutant emissions, the index methodology was used, using the results of own calculations of energy and the annual energy yield from vacuum collectors selected for the analyzed house with a total area 6.5 m2. Figure 6 shows the results of one of the exemplary graphs of reducing carbon dioxide emissions as a result of the use of solar collectors for the preparation of domestic hot water.
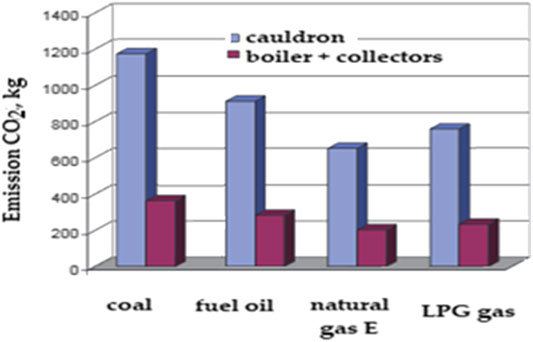
FIGURE 6. Reduction of carbon dioxide emissions as a result of the use of solar collectors for the preparation of domestic hot water. Source: own study.
Similar results were obtained for sulfur dioxide, hydrocarbons, dust, nitrous oxide, methane, non-methane volatile organic compounds, and nitrous oxide.
In Poland, with the use of solar collectors in the installation for preparing domestic hot water, it involves reducing the amount of fuel burned, that is, reducing the emission of pollutants into the atmosphere. The ecological effect depends on the type of fuel that has been replaced with energy from solar radiation and is proportional to the amount of energy obtained. The greatest reduction in emissions is associated with the installation of solar collectors in a system based on a coal-fired boiler.
The analyzed installation produced 694 kWh of electricity in July and 6,756 kWh per year, which allows the prevention of CO2 emissions at the level of 344–410 kg, which will be between 2.4–3.6 Mg per year.
The cost of reducing CO2 emissions depends on the share of energy sources in the structure of its production. An exemplary emission factor for electricity generated in a gas power plant is 400 kg CO2/MWh, while for a coal power plant, it is 850 kg CO2/MWh [59]. Forecasts for the development of the energy sector in the 2060 perspective are varied (Olczak et al., 2020a; PARP, 2020). Depending on the variant, depending on the costs of emission allowances, gas prices, or the share of renewable energy, the share of coal energy in 2020–2040 changes from 62–56% for the variant with high costs of emission allowances from 51–14% with the possibility of reducing the emission level to 85 million Mg CO2.
With the current emission factors related to the production of solar collectors and the factor related to CO2 emissions related to electricity production in Poland of 765 g CO2/kWh, the unit cost of CO2 emission reduction is approximately EUR 50/Mg CO2.
In fact, the ecological gains will be higher when the minimum, guaranteed by the manufacturer, energy yield from 1 m2 of the solar collector, and the nominal thermal efficiency of the boilers, which are often not achieved under reduced load conditions outside the heating season, are used. The ecological effect shown in this study for a single house may seem insignificant. On the national scale, however, these are potentially significant amounts of reduction of pollutants emitted to the atmosphere.
Summing up and Conclusions
The conducted analyses also lead to several important conclusions concerning the use of this type of systems in single-family houses:
1. The power of the solar collectors should be chosen so that the electricity produced fully balances the energy taken from the grid.
2. The more the energy is consumed at the time of its generation, the less the energy is introduced to the grid for free.
3. An installation subsidized under the “My Electricity” program can reach NPV 6,000 EUR over 20 years at a discount rate r = 0 and assuming electricity 0.15 EUR/kWh. If the price rises to 0.2 EUR/kWh, the NPV will be 10,000 EUR.
4. For the analyzed installation, the investment in the extension of the collector area in accordance with the NPV is economically effective for the absorber area within the range of 5.6–7.6 m2 and reaches the maximum value for the absorber area of 6.6 m2, while the absorber area of more than 7 m2 contributes to reducing the value of economic return on investment measures.
5. The analyzed installation produced 694 kWh of electricity in July and 6,756 kWh per year, which allows the prevention of CO2 emissions at the level of 344–410 kg, which will be between 2.4–3.6 Mg per year.
6. Taking into account the fact that the greatest benefit of a solar collectors may be obtained with consumption of the greatest amount of energy at the time of its generation (balanced energy), it seems that households should also consider changing their routines so that certain activities, such as washing, cooking, ironing, and water heating, are done when the solar collectors generate energy.
It has been shown that the working installation will bring measurable economic benefits in the form of the reduced amount of energy purchased from the current supplier and environmental benefits in the form of reduced emission of carbon dioxide to the atmosphere at the electricity generator. Therefore, the use of solar collectors is an opportunity to reduce the operating costs of small households.
Data Availability Statement
The raw data supporting the conclusion of this article will be made available by the authors, without undue reservation.
Author Contributions
Conceptualization—MN and EK-J, methodology—MN, software and computation—MN, model validation—MN, formal analysis—EK-J, writing and original draft preparation—MN and EK-J, writing—review and editing—MN, visualization—EK-J, supervision—EJ-K. Authors have read and agreed to the published version of the manuscript.
Conflict of Interest
The authors declare that the research was conducted in the absence of any commercial or financial relationships that could be construed as a potential conflict of interest.
References
Benalcazar, P., Suski, A., and Kamiński, J. (2020). The Effects of Capital and Energy Subsidies on the Optimal Design of Microgrid Systems. Energies 13 (4), 955. doi:10.3390/en13040955
Burgio, A., Menniti, D., Sorrentino, N., Pinnarelli, A., and Leonowicz, Z. (2020). Influence and Impact of Data Averaging and Temporal Resolution on the Assessment of Energetic, Economic and Technical Issues of Hybrid Photovoltaic-Battery Systems. Energies 13 (2), 354. doi:10.3390/en13020354
Calise, F., Figaj, R. D., and Vanoli, L. (2019). Energy Performance of a Low-Cost Photovoltaic/thermal (PVT) Collector with and without Thermal Insulation. IOP Conf. Ser. Earth Environ. Sci. 214, 012116. doi:10.1088/1755-1315/214/1/012116
Chwieduk, D., and Chwieduk, M. (2020). Determination of the Energy Performance of a Solar Low Energy House with Regard to Aspects of Energy Efficiency and Smartness of the House. Energies 13, 3232. doi:10.3390/en13123232
CIRE.PL (2020). Centrum Informacji O Rynku Energii. Report “Rynek Fotowoltaiki W Polsce 2020”. Available at: https://www.cire.pl/item,200053,2,0,0,0,0,0,rynek-fotowoltaiki-w-polsce-2020-streszczenie-i-wnioski-raportu.html (Accessed November 17, 2020).
Derski, B. (2019). Energetyka W Polsce W 2019 Roku - Moc I Produkcja Energii Wg Danych PSE. Available at: https://wysokienapiecie.pl/27524-energetyka-w-polsce-w-2019-roku-moc-produkcja-energii-wg-danych-pse/ (Accessed November 13, 2020).
Directive (2009). Directive 2009/28/EC of the European Parliament and of the Council of 23 April 2009 on the Promotion of the Use of Energy from Renewable Sources and Amending and Subsequently Repealing Directives 2001/77/EC and 2003/30/EC (Text with EEA Relevance). Available at: https://eur-lex.europa.eu/legal-content/PL/TXT/?uri=celex%3A32009L0028 (Accessed November 15, 2020).
Eurostat Statistics Explained (2020). Electricity Price Statistics. Available at: https://ec.europa.eu/eurostat/statistics-explained/index.php/Electricity_price_statistics (Accessed November 13, 2020).
Global solar Atlas (2020). Global Solar Atlas GHI—Global Horizontal Irradiation. Available at: http://solargis.info/doc/_pics/freemaps/1000px/ghi/SolarGIS-Solar-map-Europe-en.png (Accessed November 12, 2020).
IEA (2019). World Energy Outlook 2019—Analysis—IEA. Paris, France: Part of world energy outlook IEA.
IEO Instytut Energetyki Odnawialnej (2019). Główny Raport Solar „Rynek Fotowoltaiki W Polsce”. Available at: https://ieo.pl/pl/projekty/raport-rynek-fotowoltaiki-w-polsce-2019 (Accessed November 17, 2020).
Jäger-Waldau, A., Kougias, I., Taylor, N., and Thiel, C. (2020). How Photovoltaics Can Contribute to GHG Emission Reductions of 55% in the EU by 2030. Renew. Sustain. Energ. Rev. 126, 109836. doi:10.1016/j.rser.2020.109836
Janoś, K. (2020). Polski Prąd Najdroższy W UE Już 7 M-C z Rzędu. Tak Drogo Może Być 15 Lat. Available at: https://www.money.pl/gospodarka/polski-prad-najdrozszy-w-ue-juz-7-miesiecy-z-rzedu-tak-drogo-moze-byc-15-lat-6576934583294752a.html (Accessed November 10).
Kaplan, R., and Kopacz, M. (2020). Economic Conditions for Developing Hydrogen Production Based on Coal Gasification with Carbon Capture and Storage in Poland. Energies 13 (19), 5074. doi:10.3390/en13195074
Kowalski, W. (2020). IEO Instytut Energetyki Odnawialnej, Autorski Wskaźnik Koniunktury Rynku Fotowoltaicznego. Available at: https://ieo.pl/pl/indeks-pv (Accessed November 13, 2020).
Kreft, W., Filipowicz, M., and Żołądek, M. (2020). Reduction of Electrical Power Loss in a Photovoltaic Chain in Conditions of Partial Shading. Optik 202, 163559. doi:10.1016/j.ij-leo.2019.163559
Kryzia, D., Kopacz, M., and Kryzia, K. (2020). The Valuation of the Operational Flexibility of the Energy Investment Project Based on a Gas-Fired Power Plant. Energies 13, 1567. doi:10.3390/en13071567
Kryzia, D., Kuta, M., Matuszewska, D., and Olczak, P. (2020). Analysis of the Potential for Gas Micro-cogeneration Development in Poland Using the Monte Carlo Method. Energies 13, 3140. doi:10.3390/en13123140
Louwen, A., Van Sark, W. G., Faaij, A. P. C., and Schropp, R. E. I. (2016). Re-assessment of Net Energy Production and Greenhouse Gas Emissions Avoidance after 40 Years of Photovoltaics Development. Nat. Commun. 7, 13728. doi:10.1038/ncomms13728 |
Ministry of Culture and Environment (2020). Polityka Energetyczna Polski Do 2030 Roku. Warsaw. Available at: https://www.gov.pl/web/klimat/polityka-energetyczna-polski-do-2030-roku (Accessed November 12, 2020).
Ministry of Development (2020). Typical Reference Year (Dane Do Obliczeń Energetycznych Budynków). Available at: https://www.gov.pl/web/fundusze-regiony/dane-do-obliczen-energetycznych-budynkow (Accessed November 13, 2020).
Ministry of State Assets (2019). Polityka Energetyczna Polski Do 2040 R. – Strategia Rozwoju Sektora Paliwowo-Energetycznego, Warszawa, Poland. Available at: https://www.gov.pl/web/aktywa-panstwowe/zaktualizowany-projekt-polityki-energetycznej-polski-do-2040-r (Accessed November 12, 2020).
Mohammadi, K., Naderi, M., and Saghafifar, M. (2018). Economic Feasibility of Developing Grid-Connected Photovoltaic Plants in the Southern Coast of Iran. Energy 156, 17–31. doi:10.1016/j.energy.2018.05.065
NASA Solar Radiation (2020). NASA Solar Radiation. Available at: https://power.larc.nasa.gov/data-access-viewer/ (Accessed March 15, 2021).
National Centre for Emissions Management (2020). CO2 , SO2 , NOx, CO and Total Dust Emission Ratios for Electricity Based on the Information Contained in the National Database of Greenhouse Gas Emissions and Other Substances for 2018. Available at: https://www.kobize.pl/uploads/materialy/materialy_do_pobrania/wskazniki_emisyjnosci/Wskazniki_emisyjnosci_ grudzien_2019.pdf (Accessed November 22, 2020).
Newseria BIZNES (2019). Polska Na Piątym Miejscu W UE Pod Względem Rozwoju Fotowoltaiki. Ten Rok Może Być Rekordowy Dla Branży. Available at: http://europejskafirma.pl/24168,polska-na-piatym-miejscu-w-ue-pod-wzgledem-rozwoju-fotowoltaiki-ten-rok-moze-byc-rekordowy-dla-branzy/ (Accessed November 17, 2020).
NFEPWM (2020). National Fund for Environmental Protection and Water Management Prosument-Dofinansowanie Mikroinstalacji OZE. Available at: http://nfosigw.gov.pl/oferta-finansowania/srodki-krajowe/programy-priorytetowe/prosument-dofinansowanie-mikroinstalacji-oze/(Accessed November 19, 2020).
OECD (2020). Organisation for Economic Cooperation and Development – OECD Better Policies for Better Lives. Available at: https://www.oecd-ilibrary.org/social-issues-migration-health/international-migration-outlook-2020_ec98f531-en (Accessed November 15, 2020).
Office for Energy Regulation Raport (2020). Office for Energy Regulation Raport - zbiorcze Informacje Dotyczące Wytwarzania Energii Elektrycznej z Odnawialnych Źródeł Energii W Małej Instalacji (Art. 17 Ustawy O Odnawialnych Źródłach Energii), Warsaw, April 2020. Available at: https://bip.ure.gov.pl/bip/o-urzedzie/zadania-prezesa-ure/raport-oze-art-17 ustaw/3556,Raport-zbiorcze-informacje-dotyczace-wytwarzania-energii-elektrycznej-z-odnawial.html (Accessed November 13, 2020).
Olczak, P., Kryzia, D., Pepłowska, M., and Olek, M. (2018). Influence of Inclination Angle and its Adjustment Time on Insolation of Collector or Photovoltaic Panel. District Heat. Heat. Ventilatio 49 (12), 506–509. doi:10.33223/epj/122620
Olczak, P., Matuszewska, D., and Kryzia, D. (2020b). "Mój Prąd" as an Example of the Photovoltaic One off Grant Program in Poland. Polityka Energetyczna - Energ. Pol. J. 23, 123–138. doi:10.33223/epj/122482 Available at: https://epj.min-pan.krakow.pl/-Moj-Prad-as-an-example-of-the-photovoltaic-one-off-grant-program-in-Poland,122482,0,2.html (Accessed November 13, 2020).
Olczak, P., Olek, M., and Kryzia, D. (2020a). The Ecological Impact of Using Photothermal and Photovoltaic Installations for DHW Preparation. Polityka Energetyczna - Energ. Pol. J. 23, 65–74. doi:10.33223/epj/118999
Olczak, P., Olek, M., Matuszewska, D., Dyczko, A., and Mania, T. (2021). Monofacial and Bifacial Micro PV Installation as Element of Energy Transition-The Case of Poland. Energies 14, 499. doi:10.3390/en14020499
PARP (2020). Conversion Guidelines—Greenhouse Gas Emissions. Available at: https://www.parp.gov.pl/storage/grants/documents/105/Wytyczne-dotyczce-konwersji---emisje-gazw-cieplarnianych_20200225.pdf (Accessed July 28, 2020).
Ren, F.-r., Tian, Z., Liu, J., and Shen, Y.-t. (2020). Analysis of CO2 Emission Reduction Contribution and Efficiency of China's Solar Photovoltaic Industry: Based on Input-Output Perspective. Energy 199, 117493. doi:10.1016/j.energy.2020.117493
SolarPower Europe (2020). SolarPower Europe – Leading The Energy Transition. Available at: https://www.solarpowereurope.org/events2/solarpower-summit-2/ (Accessed November 14, 2020).
The Sejm of the Republic of Poland (2019). Act of 19 July 2019 Amending the Renewable Energy Sources Act and Certain Other Acts. Dz.U. 2019 Item 1524, Warsaw, Poland. Available at: http://isap.sejm.gov.pl/isap.nsf/download.xsp/WDU20190001524/T/D20191524L.pdf (Accessed November 14, 2020).
The World Bank (2020). Source: Global Solar Atlas 2.0, Solar Resource Data: Solargis. Available at: https://globalsolaratlas.info/map (Accessed November 1, 2020).
Tomasik, M., Knaga, J., Lis, S., and Gliniak, M. (2018). Analysis Of the Effectiveness of the Prototype PV Tracking System, Applications of Electromagnetics in Modern Techniques and Medicine. PTZE 8503095, 101–104. doi:10.1109/PTZE.2018.8503095
Weather data and software for solar power investments (2020). Reduce Risks and Maximise Profitability of Your Solar Energy Assets. Solargis Apps solargis.Info. Available at: https://solargis.com/ (Accessed November 10, 2020).
Zamasz, K., Kapłan, R., Kaszyński, P., and Saługa, P., (2020). An Analysis of Support Mechanisms for New CHPs: the Case of Poland. Energies 13 (21), 5635. doi:10.3390/en13215635
Zdyb, A., and Gulkowski, S. (2020). Performance Assessment of Four Different Photovoltaic Technologies in Poland. Energies 13 (1), 196. doi:10.3390/en13010196
Zelazna, A., Gołebiowska, J., Zdyb, A., and Pawłowski, A. (2020). A Hybrid vs. On-Grid Photovoltaic System: Multicriteria Analysis of Environmental, Economic, and Technical Aspects in Life Cycle Perspective. Energies 13, 3978. doi:10.3390/en13153978
Keywords: renewable energy sources, solar collectors, thermal energy, solar energy, ecology
Citation: Niekurzak M and Kubińska-Jabcoń E (2021) Analysis of the Return on Investment in Solar Collectors on the Example of a Household: The Case of Poland. Front. Energy Res. 9:660140. doi: 10.3389/fenrg.2021.660140
Received: 28 January 2021; Accepted: 29 April 2021;
Published: 26 May 2021.
Edited by:
Mingke Hu, University of Nottingham, United KingdomReviewed by:
Wojciech Florkowski, University of Georgia Griffin Campus, United StatesHafiz Muhammad Ali, King Fahd University of Petroleum and Minerals, Saudi Arabia
Copyright © 2021 Niekurzak and Kubińska-Jabcoń. This is an open-access article distributed under the terms of the Creative Commons Attribution License (CC BY). The use, distribution or reproduction in other forums is permitted, provided the original author(s) and the copyright owner(s) are credited and that the original publication in this journal is cited, in accordance with accepted academic practice. No use, distribution or reproduction is permitted which does not comply with these terms.
*Correspondence: Mariusz Niekurzak, bW5pZWt1cnpAemFyei5hZ2guZWR1LnBs
†ORCID: Mariusz Niekurzak, orcid.org/0000-0003-4966-8389; Ewa Kubińska-Jabcoń, orcid.org/0000-0001-6376-4006