 Lucile Magnier1,2
 Lauréline Lecarme1Fannie Alloin1,3Eric Maire2Andrew King4Renaud Bouchet1
 Alessandro Tengattini5,6
 Didier Devaux1,3*
- 1Univ. Grenoble Alpes, Univ. Savoie Mont Blanc, CNRS, Grenoble INP, LEPMI, Grenoble, France
- 2Univ. de Lyon, INSA Lyon, CNRS UMR 5510, MATEIS, Villeurbanne, France
- 3Réseau sur le Stockage Electrochimique de L’Energie (RS2E), CNRS, Amiens, France
- 4Synchrotron Soleil, Psiché Beamline, Saint-Aubin, France
- 5Univ. Grenoble Alpes, CNRS, Grenoble INP, 3SR, Grenoble, France
- 6Institut Laue-Langevin (ILL), Grenoble, France
X-ray and neutron imaging are widely employed for battery materials, thanks to the possibility to perform noninvasive in situ and in operando analyses. X-ray tomography can be performed either in synchrotron or in laboratory facilities and is particularly well-suited to analyze bulk materials and electrode/electrolyte interfaces. Several post-lithium-ion (Li-ion) devices, such as Li–sulfur, Li–O2, or all-solid-state Li batteries, have an anode made of metallic Li in common. The main failure mode of Li batteries is the inhomogeneity of the Li electrodeposits onto the Li anode during charge steps, leading to dendrite growth and low Coulombic efficiency. X-ray tomography is a powerful tool for studying dendrites as it provides useful information about their locations, dynamics, and microstructures. So far, the use of neutron tomography is scarcely reported for Li deposit analysis due to the difficulty in reaching sufficient image resolution to capture the deposit microstructure, that is, typically below 10–20 µm. The very different interactions of X-rays and neutrons with Li, which has significantly different opacity in the two cases, make the two techniques highly complementary. Notably, the capacity of neutrons to discern different Li isotopes is pivotal to getting an insight into the composition of Li deposits by distinguishing between Li originating from an electrode (6Li in this study) and Li originating from the Li salt electrolyte (mainly in 7Li here). Indeed, the theoretical linear neutron attenuation coefficient of 6Li is about 15 and 2,000 times larger than that of natural Li and 7Li, respectively. Therefore, a high imaging contrast difference is obtained between 6Li (high attenuation) and natural Li and 7Li (lower attenuations), which could allow a better understanding of the origin of the Li comprising the electrodeposits. In this work, we report, as a proof of concept, an in situ neutron tomography imaging of Li electrodeposits in a cycled Li symmetric cell. The electrochemical cell comprises a natural Li electrode, a 6Li electrode, and a deuterated liquid electrolyte. The neutron tomographies are compared with X-ray tomography images of the same electrochemical cell acquired both at an X-ray synchrotron beamline and at a laboratory X-ray tomograph. Neutron tomography is shown to be compatible with in situ analysis and capable of capturing the overall morphology of the Li deposits in good accordance with X-ray tomography analyses.
Introduction
In the journey to develop safe, high energy density batteries, many systems are currently being studied, such as Li–sulfur, Li–O2, or all-solid-state Li devices (Whittingham, 2004; Li et al., 2017; Bruce et al., 2012). A common feature of those batteries is the use of a lithium (Li) metal negative electrode. Indeed, Li metal is one of the most promising electrode materials, thanks to its high capacity (3,860 mAh g−1), low density (0.534 g cm−3), and low electrochemical potential (−3.04 V vs. standard hydrogen electrode) (Cheng et al., 2017). The industrialization of Li metal electrodes with a conventional liquid electrolyte has been hindered by the heterogeneities of the Li electrodeposit onto the Li surface, which limits the Coulombic efficiency (ratio between the discharge and charge capacity) and battery cycle life, and may grow sufficiently in the form of dendrites to induce a short circuit (Aurbach et al., 2000; Li et al., 2014).
To move toward an optimized Li–electrolyte interface, understanding the origin and growth of dendrites is of the utmost importance (Li et al., 2014). Indeed, depending on the nature of the electrolyte and the passive layers (Cheng et al., 2016) formed on the Li metal, different families of dendrite morphologies are observed, such as mosses, needles, and globules (Harry et al., 2014; Wood et al., 2016; Cheng et al., 2017). Furthermore, the dendrite microstructure depends on the operating and cycling conditions such as temperature or current density (Bai et al., 2016).
The most usual techniques to study dendrites are based on optical microscopy (Brissot et al., 1999a), electron microscopy (Gireaud et al., 2006), atomic force microscopy (Morigaki and Ohta, 1998), or magnetic resonance imaging (Ilott, 2016), to name a few. However, most of them are two-dimensional and invasive by nature and may alter the probed materials and interfaces. Noninvasive techniques based on X-ray imaging which take advantage of the prevalent interaction of X-ray with the outer electron shell of atoms are now more accessible, thanks to the development of dedicated synchrotron X-ray beamlines and the widespread diffusion of laboratory tomographs (Maire et al., 2001; Pietsch and Wood, 2017). X-ray tomography is a well suited to study, qualitatively and quantitatively, soft material interface. As an example, Balsara et al. studied model Li symmetric cells and Li-based batteries using synchrotron hard X-ray to report on dendrite growth and volume (Devaux et al., 2015; Harry et al., 2014). Therefore, X-ray tomography is widely reported for studying battery materials (Wood, 2018; Vanpeene et al., 2020; Magnier et al., 2020). In addition, the temporal and spatial resolution obtained from synchrotron sources are high enough to be compatible with electrochemical processes, leading to the development of in operando imaging via dedicated electrochemical cells (Schröder et al., 2016; Grey and Tarascon, 2017; Sun et al., 2016; Foroozan et al., 2020).
Despite the high spatial and temporal resolution of X-ray imaging techniques, some limitations arise due to the low sensitivity toward light Li compared to materials with a high atomic number, which are typically encountered in current collectors (Al and Cu) or active materials (Co, Fe, Mn, and Ni). As a complementary noninvasive technique, neutron imaging, which is based on the specific interactions of atomic nuclei with a neutron beam, gives useful additional information, thanks to a high penetration depth capability with regard to materials comprising high atomic number elements as well as high Li visibility and sensitivity to its isotopes (Strobl et al., 2009; Banhart et al., 2010). The theoretical linear neutron attenuation coefficient of 6Li is about 15 and 2,000 times larger than that of natural Li and 7Li, respectively (Sears 1992). As an example of in operando neutron radiography, Wang et al. (2012) imaged a planar battery made of a highly oriented pyrolytic graphite electrode with 6Li as the counter electrode at a resolution of 50 µm. By taking advantage of the beam attenuation induced by 6Li atoms, the graphite electrode areas enriched with 6Li were followed over the course of a galvanostatic experiment.
Neutron tomography was first applied to commercial batteries either to quantify gas in an alkaline cell or to probe the internal volume modification of the battery cell upon cycling (Manke et al., 2007; Butler et al., 2011; Senyshyn et al., 2012). So far, neutron tomography remains an ex situ and in situ technique as multiple hours are needed to perform a sample acquisition. The Li spatial distribution is typically quantified within the cathode (Nanda et al., 2012; Ziesche et al., 2020a), anode (Zhang et al., 2017), and battery cell (Ziesche et al., 2020) by neutron tomography. Riley et al. (2010) performed in situ neutron tomography at a resolution of 150 µm to report on the jellyroll volume change in the Li primary cell. To get better quantitative data, several optimization strategies were proposed by the authors, such as designing a specific electrochemical cell comprising deuterated electrolytes and isotope-enriched Li electrodes. Indeed, 6Li and 7Li are strongly attenuating and almost transparent to the neutron beam, respectively.
To get specific information within a battery by neutron imaging, dedicated cells and setups (Owejan et al., 2012) are needed to increase the spatial and temporal resolution, that is, get information in times compatible with typical beamtime allocations to move toward in operando analysis. Several strategies have already been explored, such as an electrochemical cell casing made of a neutron-transparent polytetrafluoroethylene (PTFE) casing (Owejan et al., 2012), an adapted pouch bag cell (Knoche et al., 2016), or a coin cell (Sun et al., 2017).
To combine X-ray and neutron information, Sun et al. (2019) designed a cylindrical polyamide-imide cell casing having an inner and outer diameter of 3 and 6 mm, respectively. The cell is optimized to image Li–air batteries for in operando synchrotron X-ray (∼1.2 µm resolution) and in situ neutron (∼13 µm resolution) tomography experiments. The complementarity of the two techniques revealed the degradation mechanisms at play at the Li/separator interface. Moreover, Song et al. (2019) performed in operando neutron radiography and in situ tomography on a Li/LiMn2O4 battery using a TiZr-based cell to study the Li dynamic distribution upon the dendrite short circuit. The electrochemically active assembly was made of a neutron-transparent 7Li metal and deuterated electrolyte in order to enhance the contrast between the Li electrodeposits and the 7Li electrode and to reduce the scattering of hydrogen.
In this work, by taking advantage of the capability of a neutron imaging beamline and of the Li isotope sensitivity, we report an in situ neutron tomography analysis of Li electrodeposits. A Swagelok-type electrochemical cell with a PTFE casing specifically designed for neutron imaging comprises a Li symmetric cell made of a natural Li (92.4 wt % 7Li and 7.6 wt % 6Li) electrode, a 6Li (95 wt % 6Li and 5 wt % 7Li) electrode, and a deuterated liquid electrolyte. 6Li was selected to increase the contrast of the deposits from the deuterated electrolyte. The 6Li electrode (anode) was oxidized, and 6Li was plated onto the opposite natural Li electrode (cathode) to induce dendrite growth. The neutron images are then compared to X-ray tomography analysis of the same cell acquired both at an X-ray synchrotron beamline and in a laboratory X-ray tomograph with a voxel size of 0.64 and 2.0 µm, respectively. In addition, the deposit volume is quantified here and positively compares to the measurement obtained using X-ray techniques. Despite the needed optimization to get further image quality and accelerated acquisition time, this in situ neutron tomography experiment is a proof of concept showing the possibility of studying battery failure modes via neutron imaging.
Materials and Methods
Li Symmetric Cell Assembly
To minimize neutron or X-ray absorption of the casing, a dedicated electrochemical cell was developed. Supplementary Figure S1 shows a schematic of the electrochemical cell comprising, as main components, a casing made of polytetrafluoroethylene (PTFE) and current collectors in aluminum (Al). The active cell composed of the 6Li/electrolyte/Li assembly is located in its middle. PTFE was selected for its high neutron transparency, allowed by its macromolecular structure made of fluorine and carbon atoms, which have a small neutron cross section. In addition, PTFE-based electrochemical cells are known to be suitable for X-ray–based techniques (Tan et al., 2018). A PTFE Swagelok straight union with an inner diameter of 1/8 inch (∼3.18 mm) was selected to ensure proper sealing and airtight conditions of the assembly. In addition, the outer part of the straight union was machined at its center, where the active cell is located, to reduce the wall thickness, leading to an outer diameter of about 8 mm, thus facilitating X-ray transmission. Despite the better corrosion resistance of stainless steel, Al current collectors were selected because of their neutron transparency and low radioactive activation under a neutron beam (Girardi and Pietra, 1963). To assemble the cell, first, an Al piston is inserted, followed by the active cell and an Al shim. Then, a stainless steel spring and a second Al piston conclude the assembly. The spring allows the imposition of a constant load to the active cell, while all the Al and stainless steel parts ensure electronic conduction from the active cell to a potentiostat via conventional “crocodile” clips.
The active cell consists of a Li symmetric cell assembled in an argon (Ar)-filled glove box (Campus, Jacomex) with sub-ppm values of oxygen and water. For each cell, one electrode is made of natural Li (92.4% 7Li and 7.6% 6Li), while the other is in 6Li (95 atom % chunk in mineral oil, Sigma Aldrich). The deuterated liquid electrolyte is formulated in the Ar glove box by mixing lithium bis-trifluoromethanesulfonimide (LiTFSI) with deuterated dimethyl carbonate (d-DMC, Sigma Aldrich, used as received) to attain 1 M concentration. First, a layer of 6Li was cut from a larger piece, manually flattened using a roll, and 3-mm-diameter disks were punched out. The average thickness of a 6Li electrode is 145 ± 10 µm, based on the series of cell replicates. Similarly, 3-mm-diameter disks of natural Li were punched out from an Li foil. The PTFE cell was assembled halfway by inserting first an Al piston (Supplementary Figure S1). The 6Li electrode was placed inside the cell, followed by a 2-mm-long perfluoroalkoxy alkane (PFA) tube with a 1/8 inch (∼3.18 mm) outer and 1/16 inch (∼1.59 mm) inner diameter to confine the liquid electrolyte and separate the two electrodes. The tube is filled with the deuterated liquid electrolyte (1M LiTFSI in d-DMC), and the natural Li electrode is placed on the top of the tube. Then, an Al shim, the spring, and a second Al piston are inserted, and the cell is closed. Four cell replicates were assembled and cycled for the purpose of this study.
Cell Cycling
The cell replicates were taken out of the glove box, placed in an oven (UN30, Memmert) held at 25°C, and connected to a single-channel potentiostat (SP200, BioLogic) with impedance capability. Then, a constant current of 8.4 µA was applied to each cell up to 72.5 h in one direction. During the galvanostatic step, the 6Li is stripped and plated onto the opposite natural Li electrode. The cell impedances were recorded before and after the galvanostatic step by potentiostatic electrochemical impedance spectroscopy. At the open circuit voltage, an excitation signal of 40 mV is applied to the cell in a frequency range between 7 MHz and 1 Hz. The impedance spectra were fitted using the Zfit module included in EC-lab software.
Electrolyte Conductivity
The ionic conductivity of the sole deuterated liquid electrolyte (1M LiTFSI/dDMC) was determined as a function of temperature. Inside the Ar glove box, a conductivity cell for microsamples (Hach Co.) was inserted into a test tube filled with the electrolyte and hermetically sealed. The cell was taken out of the glove box and placed in an oven (VTM 4004, Vötsch) to perform impedance measurements at temperatures ranging from 25 to 60°C in steps of 10°C and then cooled down to −25°C before a final heating scan up to 60°C in steps of 5°C. The impedance spectra were fitted using a similar electrical equivalent circuit detailed in a previous report (Devaux et al., 2012) to extract the electrolyte resistance (Rel). In addition, the electrode cell constant (k) was determined beforehand using 0.01 M KCl aqueous solution.
Neutron Tomography
Neutron tomography was performed at the NeXT beamline at the Institut Laue-Langevin (ILL, Grenoble, France) (Tengattini et al., 2020). The cells were mounted onto a rotation platform and imaged at room temperature. Therefore, cold neutrons reach the cell after going through a 15-mm-diameter pinhole collimator (D) placed at 10 m from the sample (L) without any filter. Given the collimation ratio L/D = 667 and an effective cell diameter of 12 mm placed close to the detector, the neutron penumbra (blurring) is estimated to be around 10 μm, close to the pixel size. To detect neutrons, a typical scintillator-mirror-camera and an infinity-corrected optical system are employed (Tengattini et al., 2020). A Hamamastu Orca Flash 4V2 equipped with Canon 100 mm f./2.0 optics with a 50-μm-thick LiF (6LiF/ZnS:Cu) scintillator was first employed to gather rough estimates of the geometry of the different cells over a large field of view set at 40 mm × 40 mm, leading to a spatial resolution of 20 µm. Once a cell was selected, a second, infinity-corrected setup, composed of a 5-µm gadolinium (Gd2O2S:Tb/6LiF) scintillator and a combination of a 50-mm f./1.2 Canon lens and a 55-mm Heliflex lens, was employed to achieve a pixel size of 7.4 µm over a 14-mm field of view. A series of 2,600 projections, each 25 s long, were acquired over a 360° rotation, leading to a total acquisition time of 18 h. In the 32-bit reconstructed images obtained using RX Solutions software, which employs a Feldkamp (FDK) filtered back projection algorithm, the grayscale value represents the attenuation coefficient, so more attenuating regions are brighter. The volume obtained was 2,575 × 2,538 × 3,397 μm3. Further image analysis was performed using Fiji software (Schindelin et al., 2012).
Synchrotron X-Ray Tomography
Synchrotron X-ray computed tomography (XRCT) using phase contrast was performed at the PSICHE beamline at the Soleil Synchrotron (Gif-sur-Yvette, France) (King et al., 2016). At the beamline, the cell was mounted on a rotating plate and illuminated at room temperature with a pink X-ray beam set at an average energy of 25 keV. A series of 1,500 projections along a 180° rotation with an exposure time of 40 ms per projection was acquired. The field of view was restricted to 1.3 mm × 1.3 mm with a voxel size of 0.64 µm. The collected radiographs were reconstructed using PyHST2 software (Mirone et al., 2014). Given that the Li cell height comprising the 2-mm-long PFA tube is larger than the field of view, two tomographic acquisitions were performed on the cell; one focusing on the top of the active cell to image the natural Li electrode and the other one focusing on the lower half of the active cell to image the 6Li electrode. Each image stack reconstructed in 32-bit floating-point was subsequently merged into a single one. The volume obtained was 2,510 × 1,313 × 1,313 µm3. The analysis of the images was also performed with Fiji software.
Laboratory X-Ray Tomography
A laboratory X-ray tomograph (EasyTom, RX Solutions) with a LaB6 cathode source and a Paxscan 2520DX (Varex Imaging) amorphous silicon flat panel detector located at the MATEIS laboratory (Villeurbanne, France) was employed to image the cells at room temperature. The detector has 1,920 rows and 1,536 columns of square pixels (each one being 127 × 127 μm2 in size) with a CsI scintillator and provides the value of the attenuation with a 16-bit gray level. Each cell was fixed to the scanner rotation platform, and a tension of 50 kV was used to acquire the scan. The tomography was acquired over four 360° rotations plus references (for alignment in case of thermomechanical misalignments along the test), comprising 1,184 images. Each projection was the result of the average of three frames at 0.70 frames per second, optimized to ensure sufficient X-ray flux to have good signal-to-noise ratio. The volume obtained was 3,422 × 3,422 × 2,614 µm3 with an isotropic voxel size of 2 µm. The collected radiographs were reconstructed to produce a 3-dimensional (3D) stack using RX Solutions software without correction of beam hardening, and Fiji software was used for image analysis.
Results and Discussion
To validate the design of the electrochemical cell, a series of uncycled electrochemical cells was imaged by X-ray tomography at the laboratory source to get insight into the quality of the active cell assembly (6Li/electrolyte/Li). Figure 1 shows a tomography of a cell cross section acquired at room temperature. In this figure, the grayscale value for each pixel is the attenuation coefficient of the corresponding portion of space. So, for example, heavy elements such as Al that strongly absorbs X-rays appear brighter. The cell casing made of PTFE is transparent enough to the X-ray so that the active cell and the Al parts (piston or shim) can be distinguished. Due to the slightly higher absorption of PFA than Li and the polychromatic nature of the laboratory X-ray source, reconstruction artifacts likely due to the cone beam or beam hardening (Maire and Withers, 2014) are observed. Indeed, the upper Li electrode seems to exhibit two different attenuation values, that is, the pixels corresponding to the Li electrodes close to the Al materials appear more attenuating than they should be. In addition, the natural Li electrode located on the top of Figure 1 has similar gray values to the bottom one made of 6Li. As expected, X-ray imaging is not sensitive to the Li isotopes, making it impossible to distinguish between these two electrodes (6Li vs. natural Li). The presence of two domains located within the PFA tube can also be noticed, one with gray values close to those of the PFA and ascribed to the liquid electrolyte, while the other one presents gray values similar to those of the Li electrodes, suggesting the presence of an Ar bubble. This is explained by the delicate cell assembly that may entrap Ar bubbles in the liquid electrolyte. Despite the presence of a bubble in Figure 1, the Li electrodes are not perfectly flat as the surface of both Li electrodes facing the liquid electrolyte tends to adopt a spherical cap shape. This feature observed on all cell replicates is probably due to the softness of Li compressed within the PFA tube due to the spring pressure and to a mediocre adhesion of Li with the Al parts. The study of the uncycled cells by X-ray tomography highlights the importance of the 3D nature of these analyses, as the inner cell geometry must be accounted for in electrochemical and impedance studies. Indeed, the dome surfaces lead to an effective surface and an effective cell constant that will differ from the geometrical ones. We can consider that the two electrodes formed equivalent spherical cap spheres within the PFA tube, having a radius (r) equivalent to the PFA inner tube radius, a height (h), and separated by a distance (l) equivalent to the PFA tube height. In such a configuration, the effective cell constant (k) is estimated using the equipotential current line (Hong et al., 2019) between two domes given by the following equation:
By measuring the distances r, h, and l by laboratory X-ray tomography imaging on a series of four uncycled cell replicates, the average effective cell constant k is estimated to be 6.9 ± 0.1. Impedance spectroscopy was then performed on the uncycled cell replicates at 25°C. Considering the effective surface, Figures 2A,B show the impedance spectra in Nyquist coordinates along with the characteristic frequencies of two typical cells, denoted cell_A and cell_B, respectively. Each spectrum presents two semicircle loops, one in the high-frequency range between 7 MHz and 100 kHz and the other one at lower frequencies. The high- and low-frequency loops are ascribed to the electrolyte (Rel) and Li/electrolyte interface resistances, respectively (Bouchet et al., 2003). The spectra were fitted with an electrical equivalent circuit composed of elements in series corresponding to the cable resistance and inductance, and the electrolyte response as Rel in parallel with a constant phase element, followed by another resistance in parallel with a constant phase element corresponding to the Li/electrolyte interfaces. The equivalent circuit is displayed in the inset of Figure 2A. The electrolyte and interface resistances of cell_A are higher than those of cell_B by a factor of 7 and 2, respectively. These higher resistances are ascribed to the presence of an Ar bubble entrapped within the PFA tube due to a contact surface reduction, which also induces a frequency dispersion as the bubble possesses different dielectrical properties. Regarding the electrolyte resistance of cell_B, the ionic conductivity (σ) at given temperature (T) is calculated using the following equation:
By combining Eqs 1, 2, the ionic conductivity of cell_B at 25°C is found to be 6.6 × 10⁻³ S cm−1. For comparison, the conductivity of the sole deuterated liquid electrolyte (1M LiTFSI/dDMC) was determined using the conductivity cell for microsamples (see electrolyte conductivity in the experimental section). Supplementary Figure S2 shows σ of the deuterated electrolyte as a function of the inverse of the temperature between −25 and 60°C. In the temperature range explored, the conductivity presents two different domains with a transition at about −5°C, corresponding to the electrolyte crystallization. At 25°C, the conductivity is 6.6 ± 0.2 10−3 S cm−1. This value is consistent with the one reported by Dahbi et al. (2011) of about 7.0 × 10⁻³ S cm−1 for a non-deuterated 1M LiTFSI/DMC electrolyte at 24.8°C. Therefore, the conductivity of cell_B at 25°C lies within the error bar of the value measured using the conductivity cell. Consequently, the analysis of the electrolyte conductivity of the uncycled 6Li–Li cell by impedance spectroscopy in combination with X-ray tomography validates the design of the electrochemical cell and allows the identification of assembly defects (deformed electrodes and entrapped gas bubbles) that should be taken into account for a future cell assembly optimization.

FIGURE 1. X-ray tomography image of an uncycled 6Li–Li cell using a laboratory scanner and recorded at room temperature.
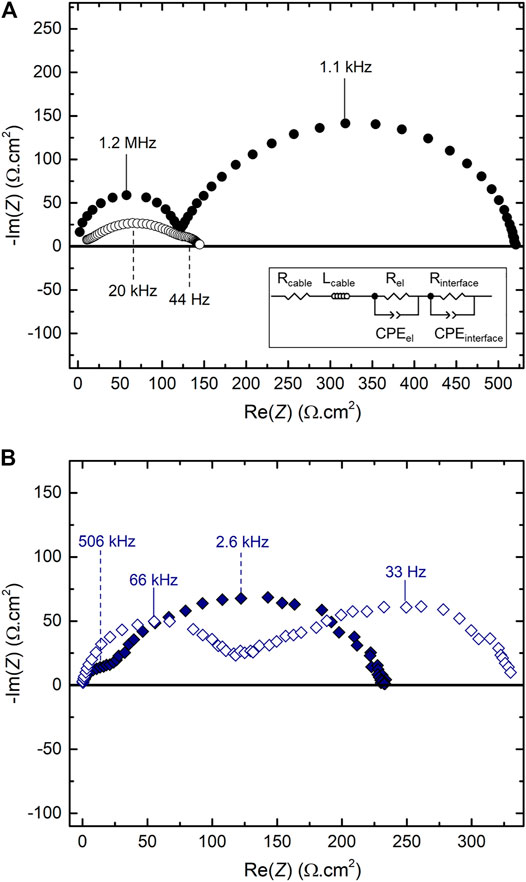
FIGURE 2. Impedance spectra recorded at 25°C of the electrochemical cells (filled symbols) before and (open symbols) after cycling for (A) Cell_A and (B) Cell_B. The inset in (A) shows the electrical equivalent circuit used to fit all the spectra.
The cell replicates were then cycled at a constant low current of 8.4 µA in order to move 6Li (anode) onto the natural Li electrode (cathode). Considering the effective surface, cell_B was cycled at 0.53 mA cm−2. For cell_A, the bubble within the liquid electrolyte induces complex current lines between the two electrodes, and thus an uncertain current density value. The result of the galvanostatic step performed on cell_A and cell_B is provided in Figure 3, showing the cell voltage (E in V vs. Li+/Li) as a function of time (t). The voltage profile of cell_B is almost constant at 0.1 V vs. Li+/Li for 16 h, and then, it increases until a plateau at about 0.45 V vs. Li+/Li. For cell_A, the voltage profile first presents a sharp increase after 5 h with a peak at about 1.7 V vs. Li+/Li at t = 15 h, before decreasing to 0.2 V vs. Li+/Li at t = 27.5 h. For t > 27.5 h, the cell voltage becomes similar to that of cell_B, with E being constant at 0.2 V vs. Li+/Li, followed by a slight increase up to a final value of about 0.53 V vs. Li+/Li, in the same range as the one reached by cell_B. The voltage fluctuation and high polarization of cell_A during the first 27.5 h is attributed to the presence and the movement of the Ar bubble within the PFA tube during the electrochemical step, leading to a geometrical factor modification coupled with an increase of the Li/electrolyte interface due to heterogeneous electrodeposits (Wood et al., 2016).
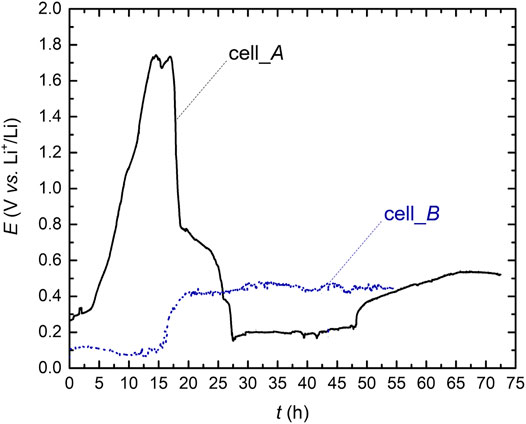
FIGURE 3. Cell voltage at 25°C during the galvanostatic step for (solid curve) Cell_A and (dotted curve) Cell_B.
A cell voltage behavior similar to the one observed for cell_B was reported in the works of Brissot et al. (1999b) and Rosso et al. (2001), focusing on the study of Li dendrite growth mechanisms in Li symmetric cells comprising a polymer electrolyte. The authors show that below a critical current density (J*), the ionic concentration profile, and thus the concentration gradient, throughout the cell evolves to a steady state. The cell voltage attains a constant value which eventually drops to zero when a dendrite makes contact between the two electrodes. For J < J*, the morphology of the electrodeposits observed by Brissot et al. (1999a) is tortuous, forming mostly mossy Li with the presence of needle-like dendrites. This behavior was partly confirmed by Bai et al. (2016) on a Li symmetric cell comprising a liquid electrolyte with an electrode interdistance in the range of several millimeters where the electrodeposited Li morphology remains mostly mossy if the current density is below J* . Based on the work of Brissot et al. (1999b), J* is defined as follows:
with F being the Faraday constant, C being the concentration of salt in the electrolyte, D being the ambipolar diffusion coefficient, and t+ being the cationic transference number.
By considering that the ionic transport properties of the deuterated liquid electrolyte are similar to those of its non-deuterated counterpart, we can take C, t+, and D values equal to 1,000 mol m−3, 0.46, and 3.46 10−6 cm2 s−1, respectively (Borodin and Smith, 2006). Using Equation 3 and considering a distance l equal to the typical PFA tube length of 2 mm, J* is 5.8 mA cm−2. Consequently, the imposed current density of cell_B corresponds to 9% of J*, and the voltage behavior falls within the J < J* case. For cell_A, despite the effect of the Ar bubble, its cell voltage profile also corresponds to the J < J* case. Indeed, even by considering an active surface as being a minor fraction of the effective surface, the current density remains below the J* value. Moreover, for cell_B, the total amount of charges passed during the 54.7 h of the galvanostatic step corresponds to a theoretical displacement of 139 µm of 6Li based on the Faraday law and considering the effective surface. This value is close to the 6Li electrode thickness used in cell_B (145 µm), which means that a quasi-total 6Li oxidation was performed during current imposition. Therefore, for both cells, their current densities used for the Li transfer from the anode to the cathode lie in the J < J* case, and the length of the PFA tube permits the oxidization of most of the anode (6Li) onto the cathode (natural Li) without dendrite short circuit.
At the end of the galvanostatic step, a final impedance measurement was performed on cell_A and cell_B, and the corresponding spectra are added in Figures 2A,B, respectively. For cell_A, the total cell resistance is diminished by a factor of 3 compared to its initial state, with a strong reduction of the interface resistance by a factor of 18 in the lower frequencies range. This situation is certainly due to an increase in the active surface on the cathode via the growth of mossy or dendritic electrodeposits (as shown later by neutron imaging in Figure 4) and a modification of the solid electrolyte interphase (Cheng et al., 2016) on the anode (Rosso et al., 2006). In addition, the electrolyte loop is depressed with a resistance value similar to the initial one, which is ascribed to the presence of both Li deposits and bubbles within the liquid electrolyte, inducing a strong dispersion in the characteristic frequencies. For cell_B, the total cell resistance increased by a factor of 1.4 with the main change observed for the electrolyte resistance (high-frequency loop), while the characteristic frequencies of the two loops are modified. This behavior may be due to a cell constant modification during the galvanostatic step. Based on Figure 1, the 6Li takes the form of a dome on the top of the Al current collector, so the cell constant will gradually change toward a higher constant value while the anode (6Li) is oxidized, and conversely, electrodeposits are formed on the cathode, until most of the 6Li is consumed, inducing a hole in the anode.
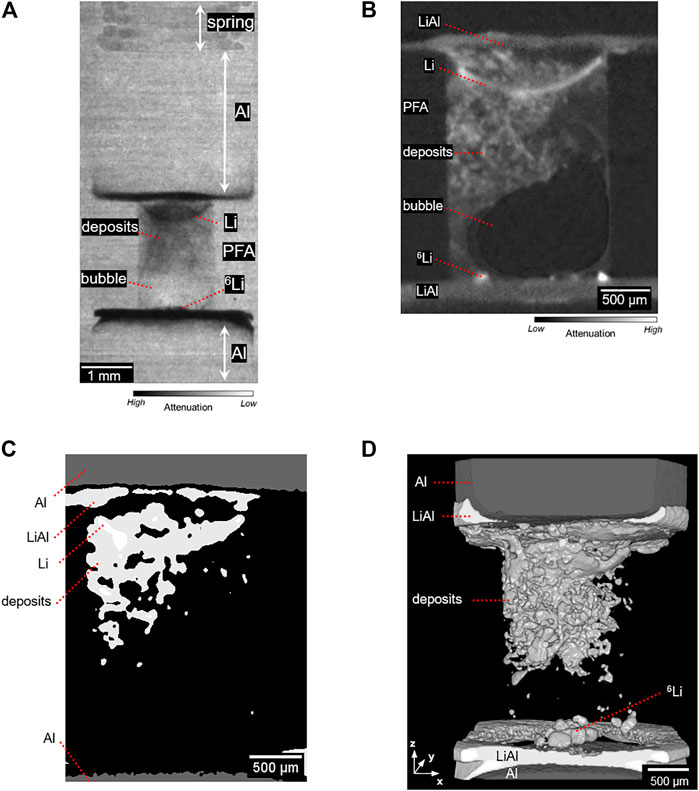
FIGURE 4. Typical image of the cycled 6Li–Li Cell_A recorded at room temperature from (A) neutron radiography (transmission contrasts), (B) slice of the reconstructed 3D stack obtained by neutron tomography (absorption contrasts), (C) result of the segmentation process performed on the slice shown in (B), and (D) volume rendering from the segmentation process.
After the galvanostatic step, the electrochemical cells were taken to the neutron tomography beamline for in situ imaging at room temperature. Therefore, a series of radiographies was first acquired at a large field of view and at different rotation angles in order to quickly inspect each cell. Except cell_A, the radiographies of cell_B and other replicates revealed a damaged assembly and thus were discarded for further tomography imaging. For cell_A, a typical radiography is reported in Figure 4A, where at each pixel, the gray value is proportional to the neutron attenuation of the corresponding region of space. In this image, neutron-transparent materials such as Al (piston and shim) and PTFE (cell casing) appear brighter (given that most of the neutrons are transmitted to the detector) than materials with stronger neutron attenuation such as the stainless steel spring or Li electrodes (Sears 1992). As expected, the Al and PFA materials are suitable for neutron imaging as their attenuation is essentially negligible. The top and bottom Li electrodes appear black in between the Al parts and the PFA tube. In addition, the PFA inner surface is visible from the overall background because of the presence of absorbent materials within the deuterated electrolyte from top to bottom, as detailed in Figure 4A: the natural Li electrode (the cathode in the galvanostatic step) with a spherical cap shape as observed in the uncycled cell by X-ray tomography (Figure 1), the 6Li deposits in the electrolyte, and a less attenuating portion at the bottom, suggesting the presence of a bubble. It can be noted that at the bottom of the PFA tube, the 6Li electrode is almost absent from the radiography, in agreement with its quasi-total oxidation during the electrochemical step (Figure 3). Moreover, at the interface between the PFA tube and the Al parts on both sides of the cell, a highly attenuating material is covering the Al surface and its edges. This is attributed to a chemical and electrochemical degradation of Al areas in contact with Li metal. Tahmasebi et al. (2019) recently reported on the degradation of the Al surface associated with the formation of the LiAl (β) phase, either during electrochemical lithiation or by simple contact between Al and Li metal. Cell_A was subsequently imaged in tomography for 18 h. Figure 4B shows a typical vertical slice of the tomography, showing a cross section of cell_A. The values of the voxels in a tomography are related to the attenuation coefficients of the corresponding volume of space, with higher values for highly attenuating materials, which is the opposite of the radiography images. As observed in the radiography, both Al parts in contact with Li are highly attenuating, indicating the presence of the LiAl phase. At the bottom part, the few 6Li anode remainders appear in bright white. The gray values of the 6Li throughout the reconstructed volume are the highest of all observed materials in the active cell, with some gray saturation at some voxels as shown in the bottom right corner. As expected, the gray values associated to the natural Li electrode (the bended electrode at the top of Figure 4B) are lower than those of the 6Li, as its theoretical neutron attenuation coefficient is 15 times lower (Sears 1992). This result shows that the Li isotope sensibility to neutrons is an effective tool to differentiate between Li electrodes (6Li vs. natural Li) after an electrochemical step. Moreover, inside the electrolyte volume in Figure 4B, a highly neutron-attenuating, irregularly shaped domain is observed and attributed to 6Li deposits, appearing in light gray and white, originating from the natural Li electrode and spreading throughout the electrolyte. In this experiment, the attenuation values from the 6Li deposits are in the same range as those of the natural Li electrode and of the Li reacted with Al, leading to difficulties in distinguishing between each of these domains. Indeed, even if the voxel size is larger than the characteristic diameter of mossy Li or Li dendrites (Bai et al., 2016), the 6Li deposits are visible because of the partial volume effect (Santago and Gage, 1995; Kaestner et al., 2013). Typically, the attenuation coefficient of voxels partially occupied by both deposits and electrolyte will be intermediate between the attenuation of the individual components. The 6Li deposits are also surrounding a dark gray and black volume with gray values close to those of the background air and having a bulb shape confirming the presence of a bubble.
From the tomography imaging, the active cell volume can be segmented into different components, based on their gray level. The Al domain can be easily segmented as it has significantly lower attenuation values. The segmentation of the other domains containing Li (deposits, cathode, and the LiAl alloy) is more delicate, given the comparable attenuation values. The thresholding limits between these are therefore more arbitrary. Figure 4C corresponds to the segmentation of the slice shown in Figure 4B, while a 3D volume rendering is shown in Figure 4D. The 6Li deposits within the electrolyte take the form of a heterogeneous ramified structure. Besides this graphical representation, the segmentation allows a quantitative analysis. The overall deposit volume can be calculated by summing up all the voxels attributed to this material. The result of 0.48 ± 0.10 mm3 is given in Table 1. This value is overestimated as the image resolution is larger than typical electrodeposit dimensions (Bai et al., 2016). It follows that, depending on the threshold value chosen for the segmentation, an overestimation of the deposit volume is probable, which tends to increase with the amount of porosity. So, even if the microstructure has typical dimensions smaller than those of the tomography resolution, this proof-of-concept experiment highlights the potential of neutron imaging in determining the overall shape and nature of heterogeneous electrodeposits as well as cell assembly defects within an electrochemical cell comprising X-ray attenuating materials.

TABLE 1. Comparison of the 6Li deposit volume from the volume segmentation process depending on the tomography techniques and their voxel size.
To get further insight into the fine structure of the deposits, cell_A was then imaged at a synchrotron X-ray tomography beamline. A typical tomography image of the entire cross section of the active cell is shown in Figure 5A. Thanks to the voxel size of 0.64 µm, the 6Li deposits are clearly seen as they attenuate less X-rays than the liquid electrolyte. The 6Li deposits develop a needle-like dendritic morphology in accordance with the finding of Brissot et al. (1999a). In addition, the LiAl domain is easily discernible at the top and bottom parts of the cell, showing interface degradation. A segmentation process was then performed on the X-ray images, and the dendrites in the electrolyte were segmented based on their gray level (very dark dendrites). However, synchrotron tomography has a very coherent X-ray source, leading to dark/light fringes due to phase contrast (Vanpeene et al., 2020). As seen in Figure 5A, the interfaces of the curved Li foil have different gray levels. An automatic grayscale segmentation of the curved foil was therefore unsatisfactory and was thus manually corrected. An illustration of this process is provided in Figure 5B, and the resulting 3D rendering volume is provided in Figure 5C. From this segmentation process, the dendrite volume was calculated to be 0.14 ± 0.01 mm3, a value also included in Table 1. A factor of 3.4 separates the dendrite volumes measured by neutron and synchrotron X-ray analysis, which is mainly due to the difference in imaging resolution.
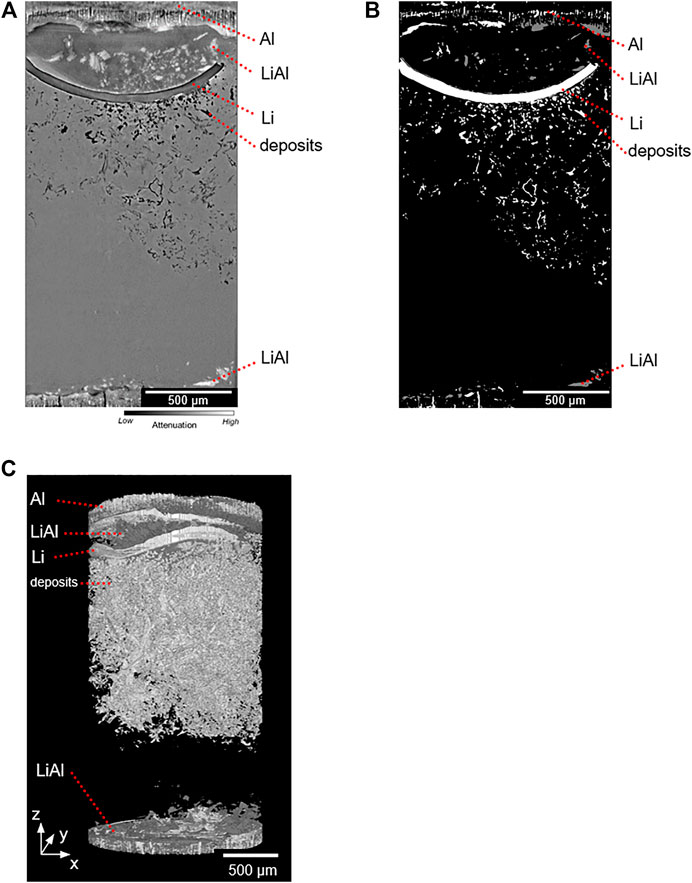
FIGURE 5. Typical image of the cycled 6Li–Li Cell_A recorded at room temperature from (A) synchrotron X-ray tomography imaging, (B) the segmented slice, and (C) volume rendering from the segmentation process.
For completeness, cell_A was imaged at the laboratory X-ray tomograph with a voxel size of 2.0 µm. In Figure 6A, a cross-sectional image corresponding to the same area as the one reported in Figure 5A is shown. Similar observations of the cell can be made compared to the synchrotron X-ray and neutron-based images. It should also be noted that the cell was imaged at the neutron and X-ray beamlines, and laboratory tomograph within few weeks. The morphology of the electrodeposit is then preserved over time. Therefore, post-cycling analyses can be performed with confidence several days or weeks after the electrochemical experiment. After the scan, the segmentation process was performed and the dendrite volume was reconstructed in 3D as depicted in Figures 6B,C, respectively. An Li dendrite volume of 0.15 ± 0.02 mm3 was calculated, a value also reported in Table 1, which is in the same range as the one obtained from synchrotron X-ray imaging. This result is in agreement with the fact that the signal-to-noise and contrast-to-noise ratios of a laboratory tomograph are lower than those for synchrotron beamlines, leading to lower resolution images with lower contrasts (Vanpeene et al., 2020). The dendrite volumes measured with the X-ray sources are similar, while at a larger voxel size, by neutron tomography, the measured dendrite volume is higher by at least a factor of 3 with higher uncertainty. This difference is attributed to lower resolution of the neutron tomography images, leading to the selection of voxels comprising a mixture of Li dendrite and electrolyte (partial volume effect) during the segmentation process. While the neutron imaging resolution is unavoidably lower because of the technical constraints of the technique, the capacity of neutrons to discern different isotopes can be exploited to pinpoint the origin and the composition of the Li comprising the dendrites. It would then be of interest to distinguish the chemical composition within dendrites between Li originating from the anode (6Li in this study) and that from the Li salt of the electrolyte (mainly in 7Li here).
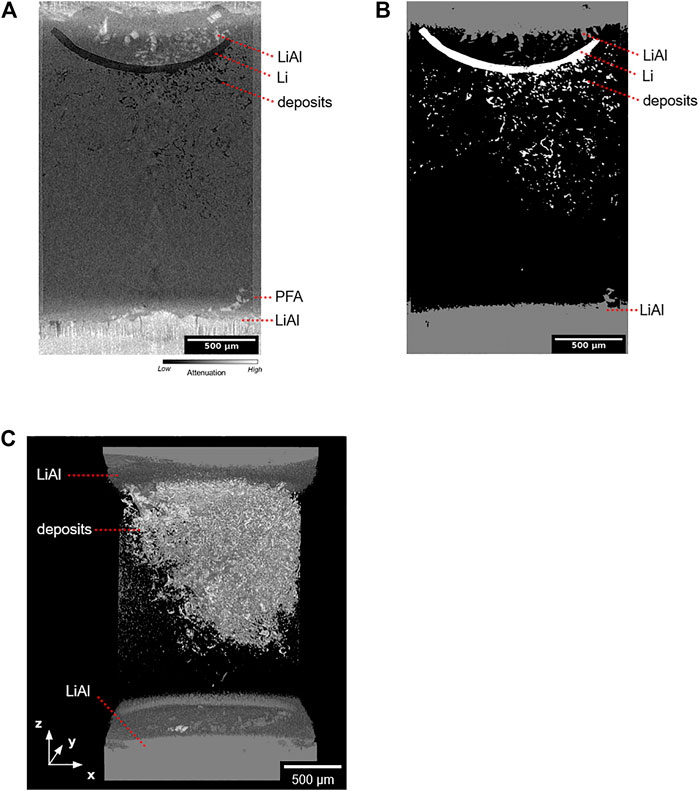
FIGURE 6. Typical image of the cycled 6Li–Li Cell_A recorded at room temperature from (A) laboratory X-ray tomography imaging, (B) segmented slice, and (C) volume rendering from the segmentation process.
Conclusion
We report an in situ neutron tomography imaging of Li electrodeposits in a cycled 6Li–Li cell by taking advantage of the capability of the neutron imaging beamline and the intrinsic contrast of Li isotopes to neutrons. This proof-of-concept experiment shows that the overall morphology of the deposits can be captured by neutron tomography. The deposit volume could be measured and compared to those obtained using X-ray techniques. To go further, several experimental parameters need to be optimized to move toward a higher resolution and contrast in shorter acquisition times. For the proposed electrochemical cell, the use of a neutron-transparent buffer metal layer in between the Al parts and Li metal while maintaining chemical and electrochemical stability is a necessity, as is the reduction of the cell diameter. As for the beamline, the foreseen increase in capabilities will permit the closing of the resolution and contrast gap between neutron and laboratory X-ray tomograph. In addition, the study of uncycled cells also highlights the importance of 3D analyses in order to validate the design of electrochemical cells as they allow the identification of assembly defects such as deformed electrodes or entrapped gas bubbles that must be taken into account for electrochemical and impedance measurements. In situ neutron tomography permits the envisioning of the thorough study of battery failure modes in electrochemical cells comprising X-ray attenuating materials. The capacity of neutrons to discern different isotopes can then be a tool used to get insight into the origin and the composition of the Li deposits by distinguishing Li from the anode (6Li is this study) and that from the Li salt electrolyte (mainly in 7Li here).
Data Availability Statement
The raw data supporting the conclusions of this article will be made available by the authors, without undue reservation.
Author Contributions
DD, AT, FA, RB, and LL designed the project study. LM, LL, EM, AK, RB, AT, and DD conducted the experiments. LM, LL, EM, RB, AT, and DD analyzed the data. LM, FA, EM, RB, AT, and DD wrote the manuscript. All the authors commented on the manuscript.
Funding
This work was supported by the French Agence Nationale de la Recherche ANR grant SHUTTLE (ANR-19-CE05-0023).
Conflict of Interest
The authors declare that the research was conducted in the absence of any commercial or financial relationships that could be construed as a potential conflict of interest.
Acknowledgments
We acknowledge the French Agence Nationale de la Recherche ANR for its financial support. A portion of this work was performed through beamtime proposal to the NeXT beamline at ILL (beamtime no. UGA-52 and UGA-91) and PSICHE beamline at the SOLEIL synchrotron (beamtime no. 20190532).
Supplementary Material
The Supplementary Material for this article can be found online at: https://www.frontiersin.org/articles/10.3389/fenrg.2021.657712/full#supplementary-material
References
Aurbach, D., Zinigrad, E., Teller, H., and Dan, P. (2000). Factors Which Limit the Cycle Life of Rechargeable Lithium (Metal) Batteries. J. Electrochem. Soc. 147, 1274. doi:10.1149/1.1393349
Bai, P., Ju, Li., Brushett, F. R., and Bazant, M. Z. (2016). Transition of Lithium Growth Mechanisms in Liquid Electrolytes. Energ. Environ. Sci. 9, 3221–3229. doi:10.1039/c6ee01674j
Banhart, J., Borbély, A., Dzieciol, Kr., Garcia-Moreno, F., Manke, I., Kardjilov, N., et al. (2010). X-Ray and Neutron Imaging - Complementary Techniques for Materials Science and Engineering. Int. J. Mater. Res. 101, 1069–1079. doi:10.3139/146.110382
Borodin, O., and Smith, G. D. (2006). Development of Many-Body Polarizable Force Fields for Li-Battery Applications: 2. LiTFSI-Doped Oligoether, Polyether, and Carbonate-Based Electrolytes. J. Phys. Chem. B 110, 6293–6299. doi:10.1021/jp055080d
Bouchet, R., Lascaud, S., and Rosso, M. (2003). An EIS Study of the Anode Li/PEO-LiTFSI of a Li Polymer Battery. J. Electrochem. Soc. 150, A1385–A1389. doi:10.1149/1.1609997
Brissot, C., Rosso, M., Chazalviel, J.-N., and Lascaud, S. (1999a). In Situ Concentration Cartography in the Neighborhood of Dendrites Growing in Lithium/Polymer-Electrolyte/Lithium Cells. J. Electrochem. Soc. 146, 4393–4400. doi:10.1149/1.1392649
Brissot, C., Rosso, M., Chazalviel, J.-N., and Lascaud, S. (1999b). Dendritic Growth Mechanisms in Lithium/Polymer Cells. J. Power Sourc. 81 (82), 925–929. doi:10.1016/S0378-7753(98)00242-0
Bruce, P. G., Freunberger, S. A., Hardwick, L. J., and Tarascon, J.-M. (2012). Li–O2 and Li–S Batteries with High Energy Storage. Nat. Mater. 11, 19–29. doi:10.1038/nmat3191
Butler, L. G., Schillinger, B., Ham, K., Dobbins, T. A., Liu, P., and Vajo, J. J. (2011). Neutron Imaging of a Commercial Li-Ion Battery during Discharge: Application of Monochromatic Imaging and Polychromatic Dynamic Tomography. Nucl. Instr. Methods Phys. Res. Section A: Acc. Spectrometers, Detectors Associated Equipment 651, 320–328. doi:10.1016/j.nima.2011.03.023
Cheng, X-B., Zhang, R., Zhao, C-Z., and Zhang, Q. (2017). Toward Safe Lithium Metal Anode in Rechargeable Batteries: A Review. Chem. Rev. 117, 10403–10473. doi:10.1021/acs.chemrev.7b00115
Cheng, X. B., Zhang, R., Zhao, C. Z., Fei, W., Zhang, J. G., and Zhang, Q. (2016). A Review of Solid Electrolyte Interphases on Lithium Metal Anode. Adv. Sci. 3, 1500213. doi:10.1002/advs.201500213
Dahbi, M., Ghamouss, F., Tran-Van, F., Lemordant, D., and Anouti, M. (2011). Comparative Study of EC/DMC LiTFSI and LiPF6 Electrolytes for Electrochemical Storage. J. Power Sourc. 196, 9743–9750. doi:10.1016/j.jpowsour.2011.07.071
Devaux, D., Bouchet, R., Glé, D., and Denoyel, R. (2012). Mechanism of Ion Transport in PEO/LiTFSI Complexes: Effect of Temperature, Molecular Weight and End Groups. Solid. State. Ionics. 227, 119–127. doi:10.1016/j.ssi.2012.09.020
Devaux, D., Harry, K. J., Parkinson, D. Y., Yuan, R., Hallinan, D. T., MacDowell, A. A., et al. (2015). Failure Mode of Lithium Metal Batteries with a Block Copolymer Electrolyte Analyzed by X-Ray Microtomography. J. Electrochem. Soc. 162 (7), A1301–A1309. doi:10.1149/2.0721507jes
Foroozan, T., Sharifi-Asl, S., and Shahbazian-Yassar, R. (2020). Mechanistic Understanding of Li Dendrites Growth by in- Situ/Operando Imaging Techniques. J. Power Sourc. 461, 228135. doi:10.1016/j.jpowsour.2020.228135
Girardi, F., and Pietra, R. (1963). Neutron Activation Analysis of Aluminum. Determination of Gamma-Emitting Impurities with Long Half Lives. Anal. Chem. 35, 173–177. doi:10.1021/ac60195a020
Gireaud, L., Grugeon, S., Laruelle, S., Yrieix, B., and Tarascon, J.-M. (2006). Lithium Metal Stripping/Plating Mechanisms Studies: A Metallurgical Approach. Electrochemistry Commun. 8, 1639–1649. doi:10.1016/j.elecom.2006.07.037
Grey, C. P., and Tarascon, J. M. (2017). Sustainability and In Situ Monitoring in Battery Development. Nat. Mater. 16, 45–56. doi:10.1038/nmat4777
Harry, K. J., Hallinan, D. T., Dilworth, Y., MacDowell, A. A., and Balsara, N. P. (2014). Detection of Subsurface Structures underneath Dendrites Formed on Cycled Lithium Metal Electrodes. Nat. Mater. 13, 69–73. doi:10.1038/nmat3793
Hong, C-, Chong, S-H., and Cho, G-C. (2019). Theoretical Study on Geometries of Electrodes in Laboratory Electrical Resistivity Measurement. Appl. Sci. (Switzerland) 9, 4167. doi:10.3390/app9194167
Ilott, A. J., Mohammadi, M., Chang, H. J., Grey, C. P., and Jerschow, A. (2016). Real-Time 3D Imaging of Microstructure Growth in Battery Cells Using Indirect MRI. Proc. Natl. Acad. Sci. United States America 113, 10779. doi:10.1073/pnas.1607903113
Kaestner, A. P., Lehmann, E. H., Hovind, J., Radebe, M. J., de Beer, F. C., and Sim, C. M. (2013). Verifying Neutron Tomography Performance Using Test Objects. Phys. Proced. 43, 128–137. doi:10.1016/j.phpro.2013.03.016
King, A., Guignot, N., Zerbino, P., Boulard, E., Desjardins, K., Bordessoule, M., et al. (2016). Tomography and Imaging at the PSICHE Beam Line of the SOLEIL Synchrotron. Rev. Scientific Instr. 87, 093704. doi:10.1063/1.4961365
Knoche, T., Zinth, V., Schulz, M., Schnell, J., Gilles, R., and Reinhart, G. (2016). In Situ Visualization of the Electrolyte Solvent Filling Process by Neutron Radiography. J. Power Sourc. 331, 267–276. doi:10.1016/j.jpowsour.2016.09.037
Li, W., Song, B., and Manthiram, A. (2017). High-Voltage Positive Electrode Materials for Lithium-Ion Batteries. Chem. Soc. Rev. 46, 3006–3059. doi:10.1039/c6cs00875e
Li, Z., Huang, J., Liaw, B. Y., Metzler, V., and Zhang, J. (2014). A Review of Lithium Deposition in Lithium-Ion and Lithium Metal Secondary Batteries. J. Power Sourc. 254 (May), 168–182. doi:10.1016/j.jpowsour.2013.12.099
Magnier, L., Devaux, D., Lachambre, J., Lecuyer, M., Deschamps, M., Bouchet, R., et al. (2020). Quantification of the Local Topological Variations of Stripped and Plated Lithium Metal by X-Ray Tomography. ACS Appl. Mater. Inter. 12, 41390–41397. doi:10.1021/acsami.0c10860
Maire, E., Buffière, J. Y., Salvo, L., Blandin, J. J., Ludwig, W., and Létang, J. M. (2001). On the Application of X-Ray Microtomography in the Field of Materials Science. Adv. Eng. Mater. 3, 539–546. doi:10.1002/1527-2648(200108)3:8<539::AID-ADEM539>3.0
Maire, E., and Withers, P. J. (2014). Quantitative X-Ray Tomography. Int. Mater. Rev. 59, 1–43. doi:10.1179/1743280413Y.0000000023
Manke, I., Banhart, J., Haibel, A., Rack, A., Zabler, S., Kardjilov, N., et al. (2007). In Situ Investigation of the Discharge of Alkaline Zn-MnO2 Batteries with Synchrotron X-Ray and Neutron Tomographies. Appl. Phys. Lett. 90, 214102. doi:10.1063/1.2742283
Mirone, A., Brun, E., Gouillart, E., Paul, T., and Kieffer, J. (2014). The PyHST2 Hybrid Distributed Code for High Speed Tomographic Reconstruction with Iterative Reconstruction and A Priori Knowledge Capabilities. Nucl. Instr. Methods Phys. Res. Section B: Beam Interactions Mater. Atoms 324, 41–48. doi:10.1016/j.nimb.2013.09.030
Morigaki, K., and Ohta, A. (1998). Analysis of the Surface of Lithium in Organic Electrolyte by Atomic Force Microscopy, Fourier Transform Infrared Spectroscopy and Scanning Auger Electron Microscopy. J. Power Sourc. 76, 159–166. doi:10.1016/S0378-7753(98)00151-7
Nanda, J., Bilheux, H., Voisin, S., Veith, G. M., Archibald, R., et al. (2012). Anomalous Discharge Product Distribution in Lithium-Air Cathodes. J. Phys. Chem. C 116, 8401–8408. doi:10.1021/jp3016003
Owejan, J. P., Gagliardo, J. J., Harris, S. J., Wang, H. D. S. H., and Jacobson, D. L. (2012). Direct Measurement of Lithium Transport in Graphite Electrodes Using Neutrons. Electrochimica Acta 66, 94–99. doi:10.1016/j.electacta.2012.01.047
Pietsch, P., and Wood, V. (2017). X-Ray Tomography for Lithium Ion Battery Research: A Practical Guide. Annu. Rev. Mater. Res. 47 (July), 451–479. doi:10.1146/annurev-matsci-070616-123957
Riley, G. V., Hussey, D. S., and Jacobson, D. (2010). In Situ Neutron Imaging of Alkaline and Lithium Batteries. ECS Trans. 25, 75–83. doi:10.1149/1.3414005
Rosso, M., Gobron, T., Brissot, C., Chazalviel, J. N., and Lascaud, S. (2001). Onset of Dendritic Growth in Lithium/Polymer Cells. J. Power Sourc. 97 (98), 804–806. doi:10.1016/S0378-7753(01)00734-0
Rosso, M., Brissot, C., Anna, T., Dollé, M., Sannier, L., Tarascon, J. M., et al. (2006). Dendrite Short-Circuit and Fuse Effect on Li/Polymer/Li Cells. Electrochimica Acta 51, 5334–5340. doi:10.1016/j.electacta.2006.02.004
Santago, P., and Gage, H. D. (1995). Statistical Models of Partial Volume Effect. IEEE Trans. Image Process. 4, 1531–1540. doi:10.1109/83.469934
Schindelin, J., Arganda-Carreras, I., Frise, E., Kaynig, V., Longair, M., Tobias, P., et al. (2012). Fiji: An Open-Source Platform for Biological-Image Analysis. Nat. Methods 9, 676–682. doi:10.1038/nmeth.2019
Schröder, D., Bender, C. L., Arlt, T., Osenberg, M., Hilger, A., Risse, S., et al. (2016). In Operando X-Ray Tomography for Next-Generation Batteries: A Systematic Approach to Monitor Reaction Product Distribution and Transport Processes. J. Phys. D: Appl. Phys. 49, 404001. doi:10.1088/0022-3727/49/40/404001
Sears, Varley. F. (1992). Neutron Scattering Lengths and Cross Sections. Neutron News 3, 26–37. doi:10.1080/10448639208218770
Senyshyn, A., Mühlbauer, M. J., Nikolowski, K., Pirling, T., and Ehrenberg, H. (2012). In-Operando’ Neutron Scattering Studies on Li-Ion Batteries. J. Power Sourc. 203, 126–129. doi:10.1016/j.jpowsour.2011.12.007
Song, B., Dhiman, I., Carothers, J. C., Veith, G. M., Liu, Jue., Bilheux, H. Z., et al. (2019). Dynamic Lithium Distribution upon Dendrite Growth and Shorting Revealed by Operando Neutron Imaging. ACS Energ. Lett. 4, 2402–2408. doi:10.1021/acsenergylett.9b01652
Strobl, M., Manke, I., Kardjilov, N., Hilger, A., Dawson, M., and Banhart, J. (2009). Advances in Neutron Radiography and Tomography. J. Phys. D: Appl. Phys. 42, 243001. doi:10.1088/0022-3727/42/24/243001
Sun, F., Gao, R., Dong, Z., Osenberg, M., Kang, D., Kardjilov, N., et al. (2019). Revealing Hidden Facts of Li Anode in Cycled Lithium–Oxygen Batteries through X-Ray and Neutron Tomography. ACS Energ. Lett. 4, 306–316. doi:10.1021/acsenergylett.8b02242
Sun, Fu., Markötter, H., Manke, I., Hilger, A., Alrwashdeh, S. S., Kardjilov, N., et al. (2017). Complementary X-Ray and Neutron Radiography Study of the Initial Lithiation Process in Lithium-Ion Batteries Containing Silicon Electrodes. Appl. Surf. Sci. 399, 359–366. doi:10.1016/j.apsusc.2016.12.093
Sun, F., Zielke, L., Markötter, H., Hilger, A., Dong, Z., Moroni, R., et al. (2016). Morphological Evolution of Electrochemically Plated/Stripped Lithium Microstructures Investigated by Synchrotron X-Ray Phase Contrast Tomography. ACS Nano 10, 7990–7997. doi:10.1021/acsnano.6b03939
Tahmasebi, M. H., Kramer, D., Mönig, R., and Boles, S. T. (2019). Insights into Phase Transformations and Degradation Mechanisms in Aluminum Anodes for Lithium-Ion Batteries. J. Electrochem. Soc. 166, A5001–A5007. doi:10.1149/2.0011903jes
Tan, C., Daemi, S. R., Taiwo, O. O., Thomas, M., Heenan, M., Brett, D. J. L., et al. (2018). Evolution of Electrochemical Cell Designs for In-Situ and Operando 3D Characterization. Materials 11, 2157. doi:10.3390/ma11112157
Tengattini, A., Lenoir, N., Andò, E., Giroud, B., Atkins, D., Beaucour, J., et al. (2020). NeXT-Grenoble, the Neutron and X-Ray Tomograph in Grenoble. Nucl. Instr. Methods Phys. Res. Section A: Acc. Spectrometers, Detectors Associated Equipment 968, 163939. doi:10.1016/j.nima.2020.163939
Vanpeene, V., Villanova, J., Suuronen, J. P., King, A., Bonnin, A., Adrien, J., et al. (2020). Monitoring the Morphological Changes of Si-Based Electrodes by X-Ray Computed Tomography: A 4D-Multiscale Approach. Nano Energy 74, 104848. doi:10.1016/j.nanoen.2020.104848
Wang, H., Downing, R. G., Dura, J. A., and Hussey, D. S. (2012). “In Situ Neutron Techniques for Studying Lithium Ion Batteries.” in Polymers For Energy Storage and Delivery: Polyelectrolytes for Batteries and Fuel Cells. Editor American Chemical Society. Washington, DC: ACS Sympos Vol. 1096, 91–106. doi:10.1021/bk-2012-1096.ch006
Whittingham, M. S. (2004). Lithium Batteries and Cathode Materials. Chem. Rev. 104, 4271–4301. doi:10.1021/cr020731c
Wood, K. N., Kazyak, E., Chadwick, A. F., Chen, K. H., Zhang, J. G., Thornton, K., et al. (2016). Dendrites and Pits: Untangling the Complex Behavior of Lithium Metal Anodes through Operando Video Microscopy. ACS Cent. Sci. 2, 790–801. doi:10.1021/acscentsci.6b00260
Wood, V. (2018). X-Ray Tomography for Battery Research and Development. Nat. Rev. Mater. 3, 293–295. doi:10.1038/s41578-018-0053-4
Zhang, Y., Ravi Chandran, K. S., Jagannathan, M., Bilheux, H. Z., and Bilheux, J. C. (2017). The Nature of Electrochemical Delithiation of Li-Mg Alloy Electrodes: Neutron Computed Tomography and Analytical Modeling of Li Diffusion and Delithiation Phenomenon. J. Electrochem. Soc. 164, A28–A38. doi:10.1149/2.0051702jes
Ziesche, R. F., Arlt, T., Finegan, D. P., Heenan, T. M. M., Tengattini, A., Baum, D., et al. (2020a). 4D Imaging of Lithium-Batteries Using Correlative Neutron and X-Ray Tomography with a Virtual Unrolling Technique. Nat. Commun. 11. 777. doi:10.1038/s41467-019-13943-3
Ziesche, R. F., Robinson, J. B., Kok, M. D. R., Markötter, H., Kockelmann, W., Kardjilov, N., et al. (2020b). Editors’ Choice 4D Neutron and X-Ray Tomography Studies of High Energy Density Primary Batteries: Part I. Dynamic Studies of LiSOCl2 during Discharge. J. Electrochem. Soc. 167, 130545. doi:10.1149/1945-7111/abbbbc
Keywords: lithium metal, electrodeposit, dendrite, neutron tomography, X-ray tomography, synchrotron
Citation: Magnier L, Lecarme L, Alloin F, Maire E, King A, Bouchet R, Tengattini A and Devaux D (2021) Tomography Imaging of Lithium Electrodeposits Using Neutron, Synchrotron X-Ray, and Laboratory X-Ray Sources: A Comparison. Front. Energy Res. 9:657712. doi: 10.3389/fenrg.2021.657712
Received: 23 January 2021; Accepted: 18 May 2021;
Published: 16 June 2021.
Edited by:
Jonghyun Park, Missouri University of Science and Technology, United StatesReviewed by:
Paul Shearing, University College London, United KingdomAnton Tremsin, University of California, Berkeley, United States
Ralf Franz Ziesche, Diamond Light Source, United Kingdom, in collaboration with reviewer PS
Copyright © 2021 Magnier, Lecarme, Alloin, Maire, King, Bouchet, Tengattini and Devaux. This is an open-access article distributed under the terms of the Creative Commons Attribution License (CC BY). The use, distribution or reproduction in other forums is permitted, provided the original author(s) and the copyright owner(s) are credited and that the original publication in this journal is cited, in accordance with accepted academic practice. No use, distribution or reproduction is permitted which does not comply with these terms.
*Correspondence: Didier Devaux, ZGlkaWVyLmRldmF1eEBncmVub2JsZS1pbnAuZnI=