 C. Devin Aluthge
 K. T. M. Udayanga Hemapala
 J. Rohan Lucas1
94% of researchers rate our articles as excellent or good
Learn more about the work of our research integrity team to safeguard the quality of each article we publish.
Find out more
METHODS article
Front. Energy Res. , 16 July 2021
Sec. Smart Grids
Volume 9 - 2021 | https://doi.org/10.3389/fenrg.2021.653015
This article is part of the Research Topic Smart Grid Advancements – Presentations from SPIES 2020 View all 7 articles
This study analyzes the primary and secondary frequency controls of the power system. Further, the article discusses the high-level understanding of keeping a selected feeder’s power supply during an upstream fault condition. The Sri Lankan power system is taken as a case study. Due to the high penetration of wind and solar injection to the Sri Lankan power system, the inertia of the system has been reduced drastically. Simulations have been carried out on a single feeder as it is impracticable to install a large battery energy storage system (BESS). The problems of dynamic stability of the current system due to high solar power penetration are analyzed. The repercussions of these problems to the power system are then discussed related to the stability of the system where there is severe machine tripping. Remedial action needed to be taken to increase the power quality of the power system, namely, BESS and supercapacitors are presented. A comparison of the inertia of the current system and the system when conventional power replaces solar power is also analyzed. The article addresses on how fast-active power injection could be used as an uninterrupted power supply to the selected feeder. It also states the fact that in the case of underfrequency load shedding, the feeder will not experience a power outage due to the BESS. However, BESS limitation and cost analysis are not discussed extensively. The results of analysis show that the selected feeder has uninterrupted power even though the grid was disconnected. Further, an approach is also taken to establish the required reactive power to the feeder as well. Method of combining virtual inertia with inverters is discussed here. All simulations conducted were based on real feeders and data.
Small power systems are prone to having reductions in their inertia with the increasing penetration of renewable energy and consequent loss of the rotating mass of conventional generation. De-loading and integration of energy storage are two methods that can be used to control the frequency and the inertia when renewable energy sources (RESs) are present (Dreidy et al., 2017).
The Sri Lankan power system, with a dispatchable capacity of 5,000 MW in 2020, has a 7% solar contribution during the day peak. As the system increases its solar penetration, the system’s rotational masses are being replaced by PV plants which comprise zero inertia. This decreases the strength of the system, and because of that, the angle stability would not be achieved even in a case of a minor fault in the system. The National Energy Policy (National Energy Policy and Strategies of Sri Lanka, 2019), which was gazetted on the 9th of August 2019, states about establishing reliable supply to all consumers and facing the challenges created due to non-dispatchable power generation. The 2008 energy policy focuses more on 100% electrification and the 2019 policy focuses more on renewable energy development. The main objective of the National Energy Policy is to make energy an affordable and a reliable service.
Under enhancing the share of renewable energy, the policy dictates that research should be conducted to overcome adverse impacts of renewable energy absorption to the power system from intermittent sources such as wind and solar energy. It further expands its scope in 3.7.7 by encouraging energy system storage solutions for firming intermittent renewable sources, voltage and frequency regulation, local grid support, peak shaving, and improving grid resilience.
Section 3.9 of the policy states about future investments about securing land for energy infrastructure. It further states that the best sites are to be located for large-scale renewable energy infrastructure such as wind and solar farms.
A master plan to identify the best sites to locate large-scale renewable infrastructure such as wind and solar farms was to be formulated and published by the end of 2019 with a development time horizon 2020–2025.
Potential offered by vehicle energy storage systems (ESSs) was also to be studied considering ESSs as a local standby energy storage device, deploying those as an automated demand response (ADR) option and a load profile management too.
Small-scale on-grid distributed and off-grid stand-alone applications using renewable energy with local value addition were encouraged as an economic development thrust.
Therefore, it is evident that the future challenges were identified, and the National Energy Policy confirms it. The policy encourages research to be carried out to mitigate the issue. The objective of the article is to present a control mechanism for fast-active power injectors in case of a fault so that the consumers will have an uninterrupted power supply even though large disturbances occur in the system.
With the increase of solar penetration, the dynamic stability has been reduced. The frequency response of such system when 10% of the conventional generation is rejected has been analyzed. The frequency response of the system in the same case when conventional generation is present is discussed later.
The study also consists of a discussion of installing the BESS around the world and its contribution to achieve dynamic stability.
The fourth section addresses the problem by incorporating a generator with unity power factor to be activated as soon as a tripping of a generator occurs. Simulations and discussions are carried out in that section to determine the frequency response of the system when various capacities of generators are taken out of the system. This section is followed by the fifth section where an analysis is done in a single feeder. The feeder is modeled in such a way that there will be a power injection as soon as the grid is disconnected due to UFLS. To establish a smooth transition between the grid and the BESS, the virtual synchronous generator (VSG) concept is incorporated. Simulations are also carried out by combining the VSG with grid following inverters. Currently, there is no method in the country to control the frequency or the voltages in the grid via renewable generation plants.
• Mega lithium-ion battery by Tesla in Australia,
• Imperial irrigation district in California installing the BESS to improve reliability,
• Golden valley electric association uses the Ni–Cd BESS as spinning reserves,
• Danish power system installing the BESS for primary frequency control are some of the implementations of the BESS. Apart from the third, the rest use the BESS to improve the reliability. Therefore, transient stability is not addressed. Furthermore, large systems such as the Australian power system and the American power system will not be affected due to small disturbances unlike the small systems such as in Sri Lanka. Due to this, the need of addressing this issue in countries with large inertia constants is minimum.
The article consists of a discussion which is carried out to evaluate the possibility of achieving dynamic stability of the Sri Lankan power system in case of a disturbance by using the BESS. The study focuses on the Sri Lankan power system, as this is a case study. The outcome of the results is to be used in other low-inertia power systems as well as distribution feeders.
The frequency response of a machine in the power system is a function of the inertia constant as given in Eq. 1.
where f0 is the nominal frequency, Δf is the frequency difference, D is the damping factor, H is the inertia constant, and SB is the nominal rating of the generator
Equation 1 shows that the rate of change of frequency
The steady-state frequency response of the Sri Lankan system was simulated with solar power injection at day peak.
Analysis of the case study was carried out with the total solar penetration at 247 MW from a total system generation of 2,717 MW. As the power output of solar generation is heavily dependent on solar irradiance, solar PV is usually considered as non-dispatchable. In the PSS/E simulation, several rooftop solar generations were lumped to have a total zero-inertia capacity of 247 MW to the 33 kV bus bar at the grid substations.
In case of a large disturbance, the system could be affected in large signal stability. As per Kimbark (1995), the classical method of inertia calculation is defined. Since angle stability has been considered in a large contingency, the variation of the angle is defined as below.
where Δδ is the deviation of load angle, Δt is the time step of simulation, and n is the time step number.
The derivative of the angle determines the frequency of the system.
Two scenarios were considered in the study to observe the frequency behavior of the system. In one, the solar penetration is 247 MW, while in the other, only conventional generation is present. The disturbance was created by withdrawing a conventional generation of 275 MW from the system. With such a sudden reduction of generation, the frequency instantaneously dropped, as seen in Figure 1, for the cases with and without the presence of solar PV.
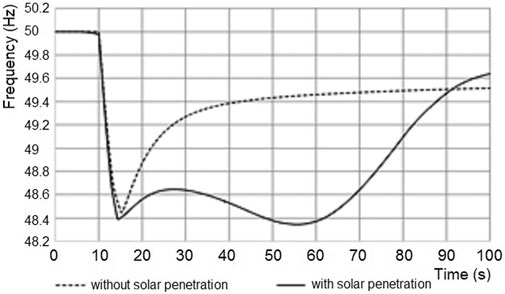
FIGURE 1. Dynamic frequency response.
In both cases, the frequency is seen to settle back due to the load-shedding schemes incorporated in the system. From Figure 1, it is seen that the recovery of the frequency in the system is slower with solar power generation than that without solar power but with more rotational mass. This comparison is shown in Figure 1, where the same contingency is applied to two scenarios with one having no solar penetration.
The sampling time of the PSSE simulation is 0.005 s, and at the 10th second, as per Figure 1, a contingency occurs. A generator injecting 275 MW from a system having a load of 2,718 MW has been tripped. The initial frequency difference in the scenario when solar injection is present is 0.003605 Hz, and the frequency change when solar injection is not present is 0.0033484 Hz. Therefore, there is a decrement of change of frequency by 7% when 247 MW of solar power has been replaced by conventional hydro generation.
In the study by Aluthge et al. (2020), it was stated that the inertia of the system that was modeled was 3.97 s when solar penetration is present and 4.26 s when solar power is been replaced by conventional generation. The difference of frequency deviation was due to this inertia difference.
Two more scenarios were considered with hydropower generation maximized in one and thermal power in the other (Figure 2). It is evident that the hydro maximum scenario settles at a lesser frequency than in the other two. This is because the governor responses have reached maximum in the hydro max situation but not in the other two cases where the frequency settles at the nominal frequency. In a scenario where hydro power is maximum, when the connected machines deliver maximum power, there is no way to increase the power further. It is also seen that the rate of recovery in the thermal maximum scenario is less than that in the remaining systems due to slow governor response. In the simulations, even rooftop solar was lumped together and modeled as large solar farms.
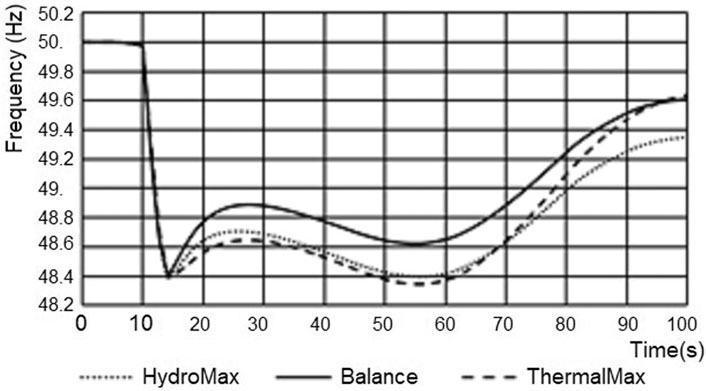
FIGURE 2. Dynamic frequency response when thermal and hydro generation is at their maximum.
A certain drawback in Sri Lanka at present is that the domestic solar generation is directly coupled to the low-voltage distribution network. Therefore, when load shedding operates, rooftop solar also gets cut-off. So, the actual frequency response might deviate from that presented. The load shedding criteria used for different stages in Sri Lanka are as follows:
Stage 1. 48.75 Hz for 100 ms
Stage 2. 48.50 Hz for 500 ms
Stage 3. 48.25 Hz for 500 ms
Stage 4. 48 Hz for 500 ms or 49 Hz + df/dt > 0.85 Hz/s for 100 ms
Stage 5. 47 Hz instantaneous or 49 Hz + df/dt > 0.85 Hz/s for 100 ms
Stage 6. 49 Hz + df/dt > 1 Hz/s for 100 ms
In Figure 2, as per the shedding criteria, only the second stage has operated as expected as the minimum frequency recorded was 48.41 Hz. If more than one load shedding stage had operated, the simulation data will not be accurate as load shedding decreases the PV generation too. This can lead to a further reduction of power and a further drop in frequency, eventually leading to a total black out of the system. Currently, in Sri Lanka, consumers are encouraged to install rooftop solar. This situation will become critical soon if no more conventional power is installed to the system. By using fast-active power injection to the system, the abovementioned problem, as well as the load shedding process, could be minimized. Alternatively, the schemes of load shedding could be modified.
The objective of fast-active power injection is to make the frequency response of the system as close as possible to that without solar penetration, as shown in Figure 1, to achieve steady recovery.
Energy system storage can be implemented with solar PV to achieve dynamic stability. According to Bostrom et al. (2013), the usage of supercapacitors combined with the battery energy storage system is useful to stabilize the system. The combined system has lesser buffering time and short-term fluctuations in output power, which avoid harmful, frequent short-duration reversals of power flow to the battery system. For a battery or supercapacitor to be used effectively, the state of charge (SOC) must be known accurately.
In the case of a battery, the SOC is usually defined as the level of charge (or available capacity) of the battery relative to its full capacity. Due to the absence of an easy method of measuring the charge or available capacity on a continuous basis, there is an ambiguity in the declared result which can lead to confusion and errors (Mpoweruk.com, 2004).
In the case of a supercapacitor, the SOC is defined as in Eq. 3:
In this case, the minimum voltage and the maximum voltage are defined as the high and low voltages of the DC voltage ripple. Researchers (Bostrom et al., 2013) show that even though the charging cycles of the supercapacitors are high, the energy that can be stored is comparatively less than that in a battery. Therefore, using supercapacitors can be useful for voltage dips or spikes that can occur in the solar profile. As discussed in the study by Hiray and Kushare (2013), the supercapacitors can store a large amount of energy. However, unlike in batteries, the supercapacitor has a small charging and discharging time. Hiray and Kushare (2013) have simulated the supercapacitor model to operate in three main scenarios. The normal condition states that the total load is supplied by the generator. The energy discharging mode is reached by injecting energy when there is a fault. Finally, the charging mode is reached when the demand is less than the supply so that the capacitors can be charged. According to Hiray and Kushare (2013), 2 MW for duration of 2 s can be delivered by this mechanism. In this method, the supercapacitor has simply been connected to the grid via an inverter. Simulations have been successfully carried out as per Hiray and Kushare (2013) to inject power in transient conditions. By this method, the supercapacitors can inject power to the grid until the BESS is energized and start delivering power.
Battery energy storage system (BESS) is also a method to inject the active power to the system. According to Hill et al. (2012), in the case of distribution of solar power penetration, the BESS can be used to maintain the solar power generation at a steady value rather than generating as per the profile changes. Solar power being generated during the day creates its own inherent problems. As the generation of solar power increases, the demand of power seen by the utilizer reduces. Therefore, the seen load follows a duck curve as explained in the study by energy Howlader et al. (2017). The critical problem rises if the duck curve affects the base load of the Sri Lankan power system which is 1,200 MW; then large thermal generation plants will have to be de-loaded, allowing them to undergo severe thermal stress. Further, since the ramp rate of these conventional generators is low compared to that of solar PV generation, there will be severe demand–supply load imbalances. The government policy in Sri Lanka is to increase the renewable energy up to 80% of the total energy generation by 2030 as discussed in the presidential manifesto in Sri Lanka (Vistas of Prosperity and Splendor) in 2019. Therefore, the mentioned situation will arise as a share of the base load of the country will also be generated by the renewable energy sources. In the study by Howlader et al. (2017), BESS and pumped storage are suggested to be used to remedy this situation. The BESS is typically connected to the grid in parallel with the source or loads it is providing benefits to, whereas traditional uninterruptible power supplies (UPSs) are installed in series with their loads. The power conversion unit is typically a bidirectional unit capable of four-quadrant operation. Therefore, both active and reactive power can be absorbed as well as generated from this method meeting the demand that is constantly fluctuated due to the variation of solar penetration.
In a small power system, it is not that uncommon to see a frequency deviation of 1 Hz for a small power variation. However, for a large power system, even a frequency deviation of 0.1 Hz requires a variation of thousands of megawatts. This discussion is carried out in the study by Chang-Chien et al. (2007). On January 10, 2019, the European grid faced a frequency dip of 49.8 Hz. The permissible fluctuation of frequency in the European grid was ±10 mHz. In the study by Sperling (2019), it is explained that the frequency had changed from 50 to 49.8 Hz over a time of 1 h. However, in a low inertia small power system, where there is solar penetration, the effect of the frequency can be governed by the BESS as it fluctuates drastically. In case of frequency increment, the generation is more than the demand, and therefore, the BESS can be charged. In case of a machine tripping and thereby the demand rising above the generation, the BESS should discharge. Therefore, unlike in the synchronous generator, the governor operation of a BESS is replaced with frequency threshold values to discharge and charge.
The Australian government with the collaboration of Tesla has installed a Mega Lithium-Ion battery bank with a capacity of 100 MW and can store energy of 129 MWh in 2017 as discussed in the study by Lambert (2018). The battery bank which had been installed is responsible to achieve dynamic stability of the system. It was stated that the newly installed battery bank is responsible for the reduction of frequency control and ancillary service (FCAS) generators, which consist of large and costly gas generators and steam turbines which are powered to compensate the loss of generation during the frequency containment region period. Here, Tesla mega battery bank has taken over 55% of the FCAS services, and therefore, the cost has reduced by 90%. The BESS installed in Australia had saved over $ 40 million during the first year by stabilizing and balancing the region’s unreliable grid.
Lithium-ion batteries of capacity 25 MW are to be installed (Beltran, 2017) in the Belgium system to supply to ancillary services. These are developed due to the increment penetration of RES. Furthermore, the imperial irrigation district (IID) in California, United States, has installed BESS to improve reliability. They too have used lithium-ion batteries as the storage medium. The launched project was a 30 MW/20 MWh battery system. In addition to that, as per Beltran (2017), the installed BESS can fluctuate its production power in a range of 60 MW. It is because that during charging cycles, the power generated is −30 MW and during discharging, 30 MW. A conventional gas turbine generator which has the same ratings could only vary its power output from zero to 30 MW. Furthermore, it takes few minutes to start and synchronize to the grid, whereas the BESS can be coupled with the system within seconds.
The Golden Valley Electric Association (GVEA) installed the nickel–cadmium BESS (Beltran, 2017) as spinning reserves in case of a line fault or a generator fault. The installation capacity was 40 MW. The major difference in GVEA and IID installations is that the Ni–Cd battery does not give the smoothing effect for renewable systems compared to the Li-ion battery. Further, lithium-ion batteries are completely sealed and do not require the electrolyte maintenance needed by nickel–cadmium batteries. In addition, lithium-ion batteries are replaced as soon as they start showing performance issues. In the study by Swierczynski et al. (2013), it was stated that grid-tied energy storage system (ESS) presents itself as a solution for conventional generation units (CGUs).
Considering the study by Swierczynski et al. (2013), the Danish power system has successfully installed a 1.6 MW/0.4 MWh Li-ion energy storage system to achieve primary frequency regulation.
The efficiency of the Li-ion batteries is broadly discussed in the study by Li and Tseng (2015). As per Li and Tseng (2015), the total rechargeable energy cannot be converted into chemical energy. The charging–discharging efficiency is calculated by the ratio of input and output energy of the battery. The ratio between the output energy and the chemical energy stored in the battery can be defined as the energy efficiency under discharging. The stored energy of the battery is as given in Eq. 4:
The open circuit voltage (OCV) can be measured by several methods. The conventional method is used to measure the terminal voltage of the battery, after disconnection, and after a certain time of charging/discharging for the cell to reach to a certain state of charge (SOC) and longtime relaxation. The discharging energy can be denoted by Eq. 5.
The overall efficiency is
According to Barin (Barin et al., 2011), multiple ESSs were analyzed to see the optimal method. There were three aspects considered to compare eight alternatives of ESS. The eight methods of ESSs are as shown below.
• Compressed air
• Pumped hydro
• Supercapacitors
• VRB flow batteries
• Lithium-ion batteries
• Sodium sulfide advanced batteries
• Flywheels
• Hydrogen storage
These methods of energy storages had been evaluated in six aspects. Afterward, these criteria were prioritized by three clusters.
1) Power quality scenario: 1st power quality, 2nd efficiency and load management, 3rd technical maturity, 4th environmental impacts, and 5th costs.
2) Costs scenario: 1st costs, 2nd efficiency and power quality, 3rd load management, 4th technical maturity, and 5th environmental impacts.
3) Environment scenario: 1st environmental impacts, 2nd efficiency and load management, 3rd technical maturity, 4th power quality, and 5th costs.
The lithium-ion BESS is selected as the best over the other alternatives in scenario 1. Flywheels supersede all alternatives in all three scenarios. When comparing the power quality criteria between the flywheel and the lithium-ion battery, Barin et al. (2011) and Liao et al. (2018) stated that the latter is better than the prior. The simulations which had been conducted here only consider the power quality aspect. Therefore, all simulations were conducted by simulating the ESS as a BESS.
Simulations were conducted by using a 50 MW battery supply connected to a load center. Since the sample power system was the Sri Lankan grid, the load center was the Kolonnawa grid substation, as shown in Figure 3.
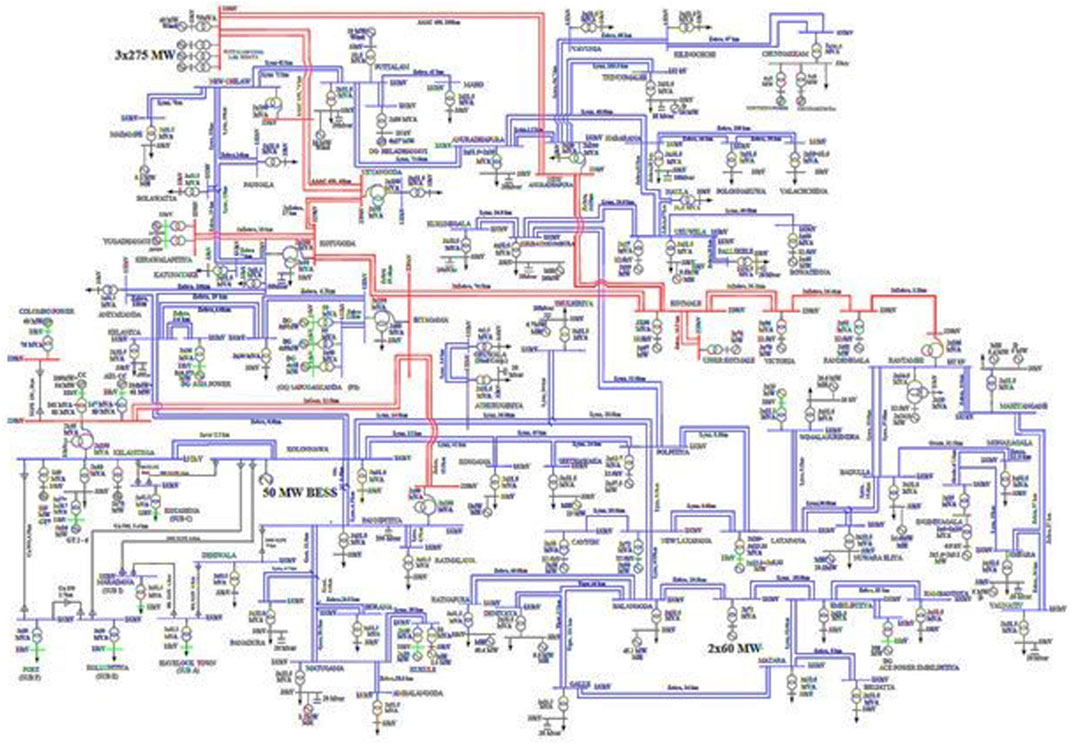
FIGURE 3. 50 MW BESS connected to Kolonnawa bus.
The simulations were done only for machine tripping. The worst-case scenario is an ejection of 275 MW of power generation from the Lakvijaya Power Station at Puttalam. Further, another simulation was conducted by withdrawing 60 MW from the system. In the simulations, the frequency response and the battery charging and discharging cycle were observed. In the simulations, the solar power which was generated was 246 MW. Figure 4 shows the frequency response of the rejection of 275 MW of the power system when the battery is installed and when it is not.
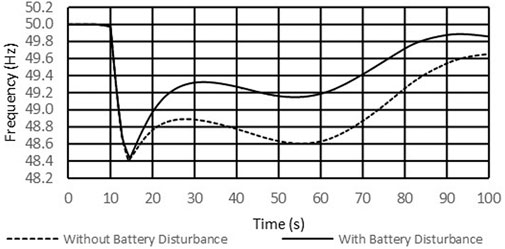
FIGURE 4. Frequency response with and without battery bank in case of 275 MW rejection.
Even though a 50-MW battery bank is incorporated in the system, it is seen that stage one load shedding has commenced. However, due to the presence of the battery, the frequency settles at a favorable value than that in the system without the battery bank.
Figure 5 shows the frequency response when a rejection of 60 MW occurs. The placement of the 60 MW generating plant is shown in Figure 3 too. Observing the graphs, it is possible to see that underfrequency load shedding does not occur in the case when a battery is incorporated. Further, by the charging and the discharging cycle of the two scenarios, it is evident that a battery which can produce more than 50 MW is not necessary for the case of machine disturbances.
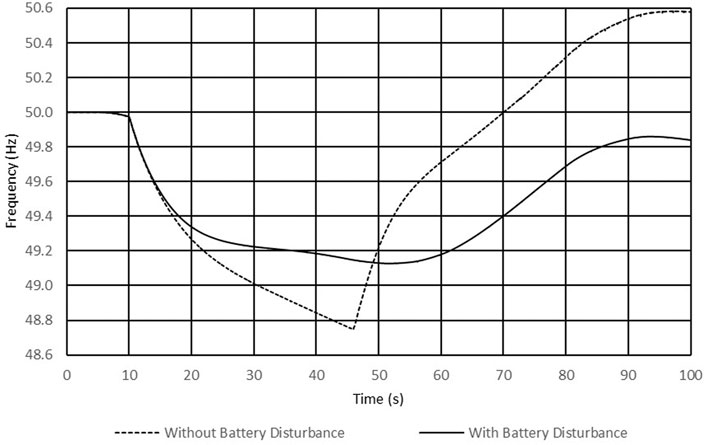
FIGURE 5. Frequency of the system when rejection of 60 MW generation from the system occurs.
Figure 6 shows the power at the Kolonnawa grid substation where the battery bank is installed. It is visible from the graphs that the maximum power output does not saturate at 50 MW. Therefore, installing a battery bank having a rating of more than 50 MW might not be economical. In both scenarios, after 60 s, the power output decreases as the charging cycle activates.
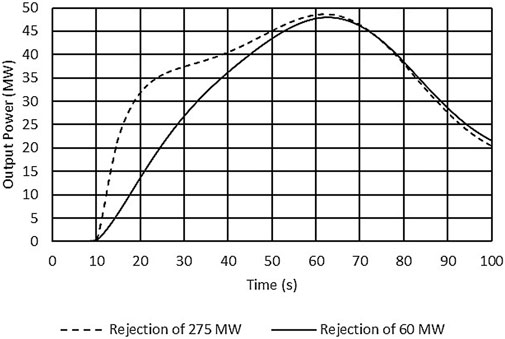
FIGURE 6. Power rejection cycle of the battery bank.
The battery in PSS/E simulations was modeled as generator with unity power factor. The generator model that is used here is REGCAU1, and the excitation system is REECBU1. The control models which were used are shown in Figure 7.
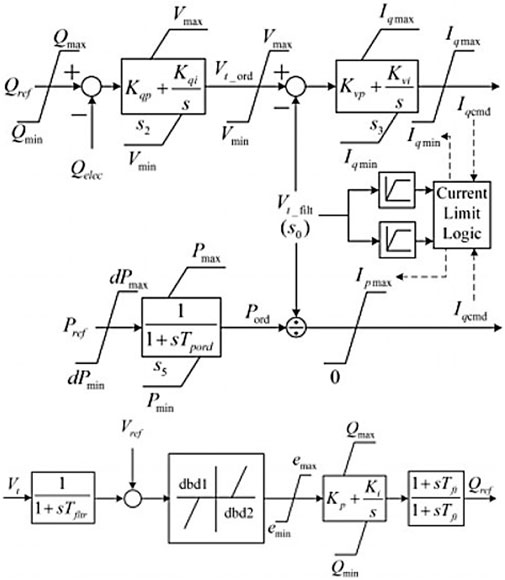
FIGURE 7. The structure of model REECAU1 and REECBU1.
Following are the inputs that were used in the REECAU1 and REPCAU1 models which depict the BESS that is incorporated to the PSS/E.

As per the study by Thomee (2018), there are two regions to frequency response: the frequency containment region (FCR) and the frequency restoration region (FRR). Here, the FCR concentrates on the initial response of the frequency in case of sudden change, whereas the FRR is focused on the recovery component. As soon as a disturbance occurs, the frequency drops, as can be seen in Figures 1, 2, 4, and 5. This drop period is observed in the FCR. This is then followed by a recovery process which can be divided into two sections, namely, automatic FRR and manual FRR. The simulations that were conducted involving BESS were focused mostly on the aFRR. Further, when comparing the BESS over supercapacitors, the reaction speed of the supercapacitor is much faster as per Hiray and Kushare (2013). Therefore, the system is more stable if the BESS is incorporated together with a supercapacitor.
When comparing the frequency responses in Figures 4, 5, it is quite clear that the BESS plays a significant role when the FRR is considered. Further, the difference between FRR and FCR is also improved when the BESS is installed. Table 1 shows changes in values when the BESS is placed and when it is not.
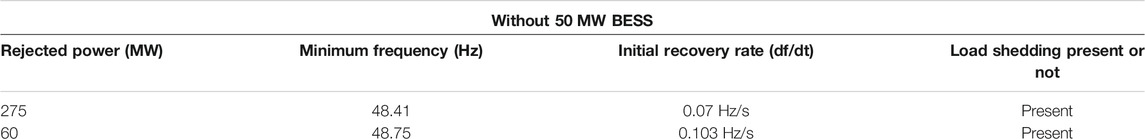
TABLE 1. Frequency and power response.
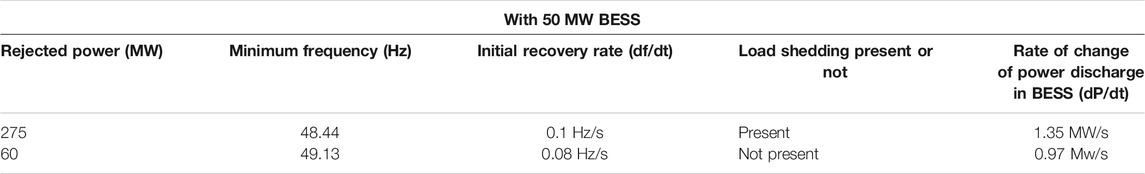
Table 1 reflects the fact that there will be a faster frequency recovery when the BESS is installed. However, when there is a rejection of 60 MW, there is no underfrequency load shedding present when the BESS is incorporated. Therefore, the recovery does not come to the category of frequency recovery after contingency. Due to the presence of the BESS, there is no load shedding present.
The second part of the simulations was conducted by obtaining results in a single feeder. The BESS was oriented in the downstream, and the BESS was modeled to act as an uninterrupted power supply (UPS) to the feeder. So as soon as the frequency falls beyond 49.5 Hz, the BESS takes over the feeder and maintains the frequency at nominal. Here, a distribution feeder was selected, and it was simulated using power system computer aided design (PSCAD). The PCC was decided as the location in which the 33 kV couples itself with the main power system. The Thevenin equivalent impedance was determined using fault level calculations. 0.1338 + 0.5669j was the Thevenin impedance which was incorporated to the variable frequency voltage source at the PCC. Domestic solar penetrations were modeled as constant current sources as the terminal voltage should be maintained as a constant value despite the amount of solar generation. Even though there are huge fluctuations in solar power generation within a few second time, it is negligible compared to distributed generation within 100 s. Figure 8 shows the modeled feeder in PSCAD.
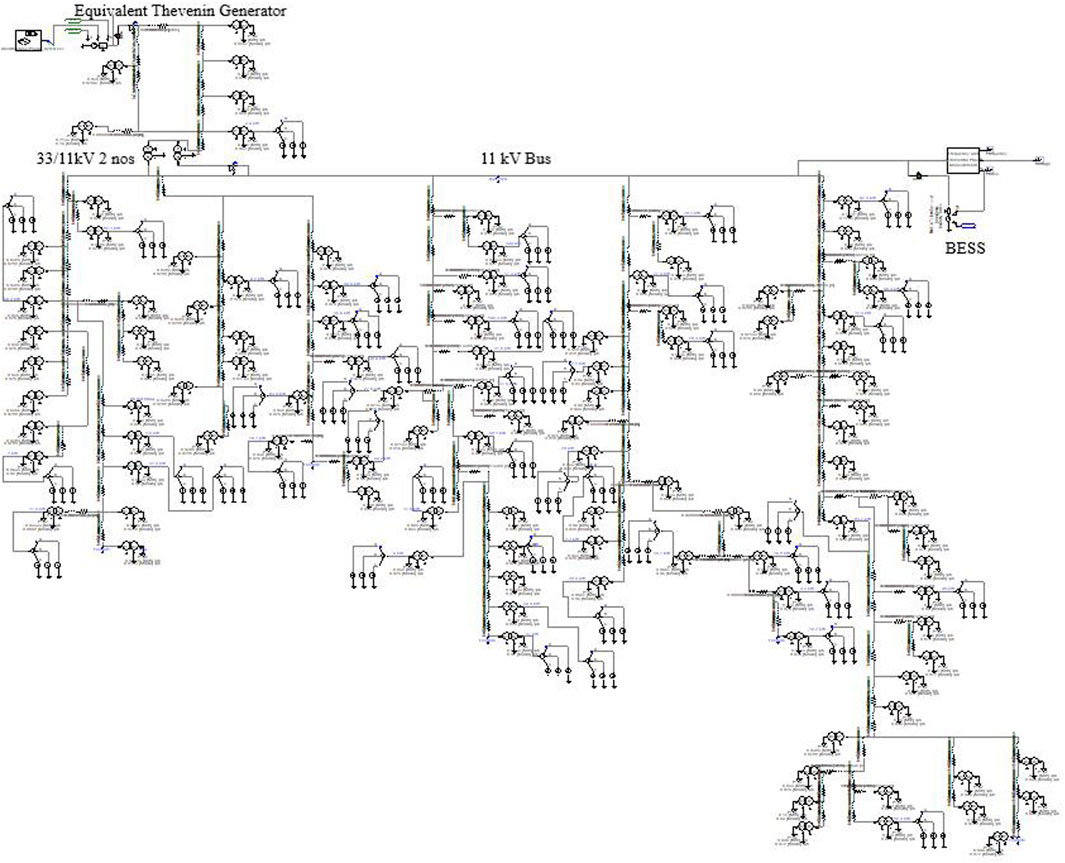
FIGURE 8. Modeled power distribution feeder.
The power injected from the BESS was recorded as 13.3 MVA in the simulation. Obtaining the actual interruptions of the feeder due to UFLS during the year 2019, it was evident that the simulation results were in par with the actual results obtained by the utility. Table 2 shows the actual occasions in which UFLS had been operated shutting down the selected feeder.
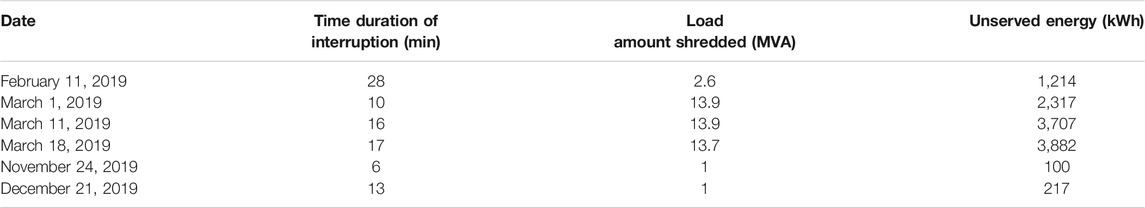
TABLE 2. UFLS instances occurred in the selected feeder.
The transition from the grid to the BESS should be a smooth transition. The BESS power injection was controlled by a sinusoidal PWM inverter. Smooth transition is not present, and the BESS takes over without proper synchronization. At 49.5 Hz, transition is decreased. The grid has been disconnected, and the BESS takes over at the same time. In practical circumstances, this will not happen as there is a time lag between the two incidents.
To find a remedy to the switching problem at hand, the virtual synchronous generator (VSG) concept was incorporated. As per Ujjwol (Tamrakar et al., 2017), there are four types of VSG models. The synchronous generator (SG) model, swing equation model, frequency–power response based approach, and droop-based approach are the four models addressed in the study by Tamrakar et al. (2017). The swing equation model was chosen in this case, and the merits of the method are as follows:
• Simpler model than SG-based model
• Frequency derivative not required
• PLL used only for synchronization
The swing equation model as per Tamrakar et al. (2017) solves the conventional swing equation in the time domain and acts as a synchronous generator.
where
• Pin: input power
• Pout: output power of the inverter
• wm: virtual angular frequency
• wg: grid/reference angular frequency
• J: moment of inertia
• Dp: damping factor
Here, “Pin” is like the input power of a synchronous generator. To simulate the VSG, the damping coefficient and the inertia constant were to be determined. The damping coefficient was selected as 50 MWs, and the moment of inertia was 2,435 kgm2. Figure 9 shows the control system of the VSG. Here, a phase locked loop (PLL) has been incorporated to track the voltage waveform. The PLL signal is determined by the voltage that is been observed at the 11 kV bus bar.
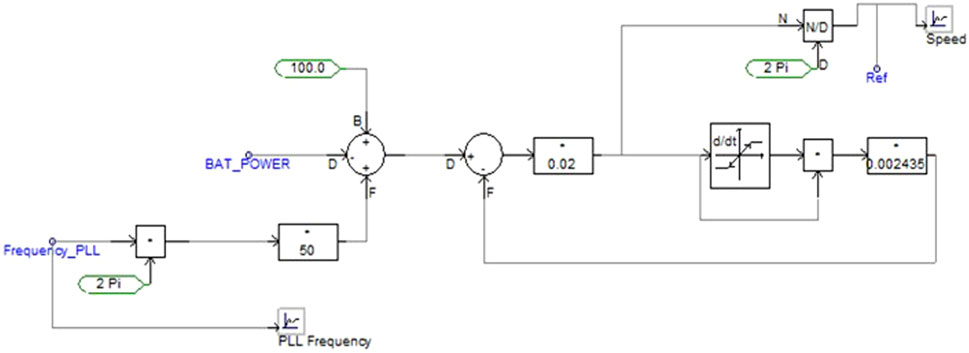
FIGURE 9. Swing equation based VSG model.
The output of the model denoted as “Ref” is the reference frequency to the PWM inverters’ reference waveform.
A smooth transition occurred when the method was implemented, and the voltage waveform at transition is shown in Figure 10. Further, to obtain the required reactive power as well as to achieve the desired voltage at the terminal, the inverter was controlled as per Figure 11. This combines the VSG model shown in Figure 9 with the grid tied inverter model. Here, the indirect method of current sensing is used and is combined with state vector PWM. The proposed method of grid following inverters in Hyosung Kim (Kim et al., 2008) states that the inverter requires current feedback too. However, in the proposed method, as per Figure 11, the voltage is concerned, and it should be maintained at the desired value when unwanted tripping occurs in the feeder due to upstream fault conditions. Therefore, here, only the voltages and the power are considered as the BESS, and remaining power is calculated by observing the discharge current.
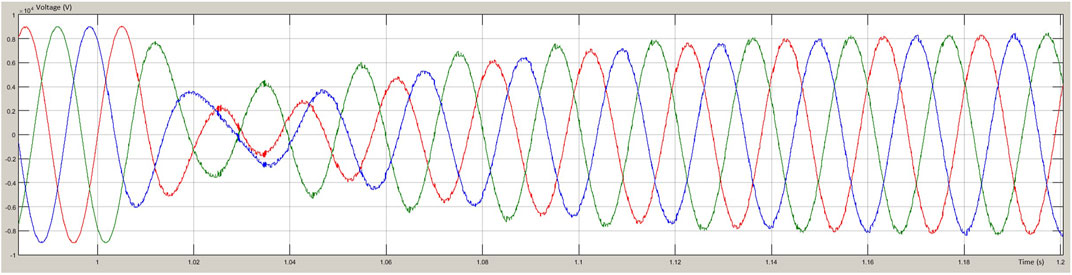
FIGURE 10. Transition from grid to BESS.
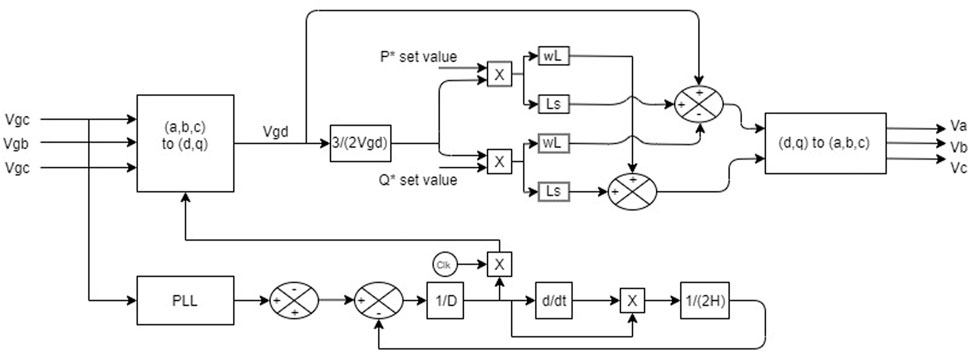
FIGURE 11. Control diagram of the inverter.
The UFLS tripping is not an instantaneous tripping method. As referred earlier, the tripping of a feeder occurs when certain criteria are fulfilled. Therefore, prior to tripping, it is a possible state that the selected feeder will undergo a tripping after finite time duration. This phenomenon was added to the simulation. The BESS was synchronized as soon as the frequency was 49.5 Hz, and the main grid was disconnected from the system at 49.25 Hz. Figure 12 shows the frequency fluctuation of the voltage waveform.
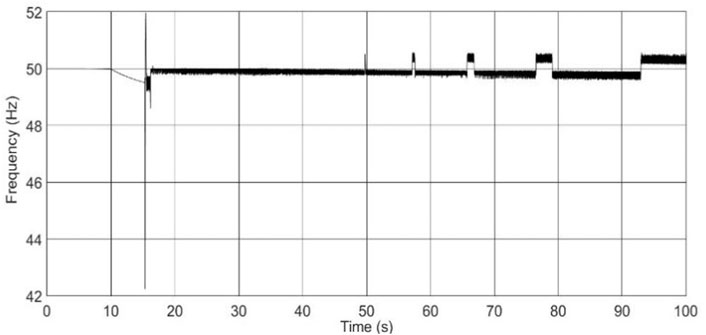
FIGURE 12. Frequency fluctuation of the voltage.
The frequency in Figure 12 was measured using zero crossings. The three-phase voltages were obtained, and the period between the zero crossings was recorded. The frequency has been determined by taking the average of these time durations and calculating the frequency. Equation 8 shows the method of determining the frequency of the simulation.
As per Eq. 8, the frequency is measured within a period of one cycle. As it considers all zero crossings in all three phases, the evaluated time is 20 ms. This results in high-frequency spikes during transition periods even though the voltage waveform has a smooth transition. At 15.75 s, the BESS takes over the feeder. At this moment, Figure 12 shows frequency fluctuation between 42.2 and 52 Hz. In Figure 12, the frequency had not been affected drastically as there is a smooth transition comparing Figures 9, 11. However, the fluctuation is shown from 42.2 to 52 Hz.
However, in the study by Xue et al. (2007), few frequency measurement methods were introduced, which are as follows:
• Modified zero-crossing methods.
• Discrete Fourier transformation
• Orthogonal decomposition
• Signal demodulation
• Phase-locked loop
• Least square optimization
• Artificial intelligence
• Wavelet transform
• Quadratic forms
• Prony method
• Taylor approximation
• Numerical analysis
By following the discrete Fourier transformation method, the frequency and the amplitude of waveform against time are shown in Figure 13. As shown in Figure 13, the fundamental waveform dictates the total voltage waveform. Further, compared to other harmonic components, the fundamental is much more than them.
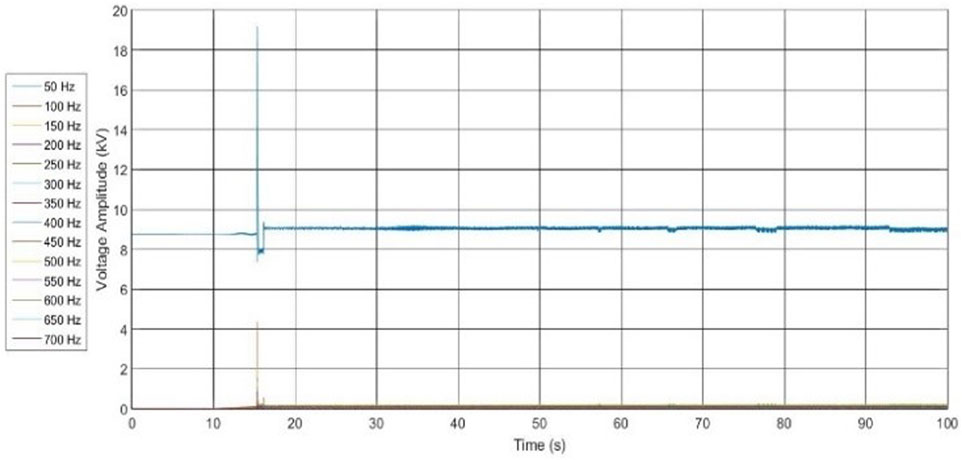
FIGURE 13. Amplitude response of fundamental and harmonic frequencies.
From Figure 13, it is quite visible that the fundamental waveform peak was 8.98 kV, which is the phasor voltage peak of the 11 kV bus. It can be conclusive here that the BESS could effectively take over the selected feeder by using the proposed control mechanism. However, the charging and the discharging methods of the BESS are yet to be determined.
The voltage and the frequency of the selected feeder have been kept at its nominal value via the VSG method. The model which is depicted here can be used in any other feeders, and the fault is occurred in the upstream.
The study has shown that the dynamic stability of the Sri Lankan power system is reduced as the solar power penetration is increased as there is a reduction of the system rotational masses. Figure 1 shows that recovery of the system is smoother in the case of zero solar power penetration and it does not show a steady restoration once solar penetration is present. Further, by analyzing the two inertia constants in the two scenarios, it was possible to state which system is more stable. The inertia constant when solar penetration was present was 3.97 and 4.26 s in the case of conventional generation. Due to the reduction of inertia, the system gets weaker. Therefore, to avoid a complete blackout due to a sudden rejection of power generation in the system, underfrequency load-shedding schemes are being introduced. The installation of the BESS and supercapacitors at load centers would inject active power to the system as soon as a sudden frequency decrease occurs or absorbing active power as soon as a sudden frequency increase is detected.
As per prior research, it was conclusive that supercapacitors have more charging and discharging cycles, but it has less energy storage than the BESS. However, in the simulations that were conducted here, the discussion between supercapacitors and the BESS was not conducted.
Simulations were conducted on the Sri Lankan power system by connecting a BESS at a grid substation. The BESS was modeled as a zero-inertia generator, and the results of the simulations depicted that by installing a BESS, dynamic stability can be achieved as for some contingencies, underfrequency load shedding will not act. The simulations were conducted by using a 50-MW BESS at a heavy load center. However, due to the high capital and maintenance, cost simulations were conducted in the feeder level.
Simulations were also conducted on a single feeder, and the BESS was used as a UPS to the feeder. Therefore, once the frequency was below the threshold value of 49.5 Hz, the BESS took over the feeder. The smooth transition between the grid and the feeder was simulated by incorporating the swing equation–based VSG. For the VSG parameters, a conventional synchronous generator’s parameters were incorporated. The damping coefficient was selected as 50 MWs, and the moment of inertia was 2,435 kgm2. VSG coupled with the inverter which maintained the voltage of the feeder was able to inject both active and reactive power as per the demand. The results obtained were promising as the voltages and the system frequency matched the nominal system parameters.
The constraint lies among the cost, resources, and the inverter technology. These constraints must be addressed in future studies.
The raw data supporting the conclusions of this article will be made available by the authors, without undue reservation.
CA: research student of the University of Moratuwa. KH and JL: supervisors of the project.
The authors declare that the research was conducted in the absence of any commercial or financial relationships that could be construed as a potential conflict of interest.
We thank the University of Moratuwa and the Ceylon Electricity Board (CEB) for giving the necessary resources to conduct the research. We especially thank Eng. Channa Kulasekara for providing us with the necessary data and advising on the research. Further, a part of the content of this manuscript has been presented at the 2020 2nd International Conference on Smart Power and Internet Energy Systems (SPIES 2020), under the heading “Using BESS to Achieve Power System Dynamic Stability when High Solar Penetration is present: Case study Sri Lanka.”
Aluthge, C. D., Udayanga Hemapala, K. T. M., and Lucas, J. R. (2020). Battery Energy Storage System to Improve Reliability Due to under Frequency Load Shedding. In 2020 IEEE 5th International Conference on Computing Communication and Automation. ICCCA, Bangkok, Thailand, September 15–18, 2020. doi:10.1109/iccca49541.2020.9250889
Barin, A., Canha, L. N., Abaide, A. R., Magnago, K. F., Wottrich, B., and Machado, R. Q. (2011). Multiple Criteria Analysis for Energy Storage Selection. Energy Power Eng. 03 (04), 557–564. doi:10.4236/epe.2011.34069
Beltran, C. (2017). "Battery Deployments Solve Grid Challenges", T&D World. [Online]. Available at: https://www.tdworld.com/grid-innovations/generation-and-renewables/article/20969604/battery-deployments-solve-grid-challenges (Accessed November 8, 2019).
Bostrom, A., von Jouanne, A., Brekken, T. K. A., and Yokochi, A. (2013). Supercapacitor Energy Storage Systems for Voltage and Power Flow Stabilization. In 2013 1st IEEE Conference on Technologies for Sustainability (SusTech), Portland, OR, August 1–2, 2013. doi:10.1109/sustech.2013.6617326
Chang-Chien, L.-R., Lin, Y.-J., and Wu, C.-C. (2007). A Real-Time Contingency Reserve Scheduling for an Isolated Power System. IEEE Trans. Reliability. 56 (1), 139–147. doi:10.1109/tr.2006.884588
Dreidy, M., Mokhlis, H., and Mekhilef, S. (2017). Inertia Response and Frequency Control Techniques for Renewable Energy Sources: A Review. Renew. Sust. Energ. Rev. 69, 144–155. doi:10.1016/j.rser.2016.11.170
Hill, C. A., Such, M. C., Chen, D., Gonzalez, J., and Grady, W. M. (2012). Battery Energy Storage for Enabling Integration of Distributed Solar Power Generation. IEEE Trans. Smart Grid. 3 (2), 850–857. doi:10.1109/tsg.2012.2190113
Hiray, P., and Kushare, B. (2013). Controller Design for Supercapacitor as Energy Storage in Medium Voltage AC System. Delaware, USA: Semanticscholar.org.
Howlader, H. O. R., Furukakoi, M., Matayoshi, H., and Senjyu, T. (2017). Duck Curve Problem Solving Strategies with thermal Unit Commitment by Introducing Pumped Storage Hydroelectricity & Renewable Energy,” In 2017 IEEE 12th International Conference on Power Electronics and Drive Systems. (PEDS), Honolulu, HI, Decemeber 12–15, 2017. doi:10.1109/peds.2017.8289132
Kim, H., Yu, T., and Choi, S. (2008). Indirect Current Control Algorithm for Utility Interactive Inverters in Distributed Generation Systems. IEEE Trans. Power Electron. 23 (3), 1342–1347. doi:10.1109/tpel.2008.920879
Li, K., and Tseng, K. J. (2015). “Energy Efficiency of Lithium-Ion Battery Used as Energy Storage Devices in Micro-grid,” In IECON 2015 - 41st Annual Conference of the IEEE Industrial Electronics Society, Yokohama, Japan, November 9–12, 2015. doi:10.1109/iecon.2015.7392923
Lambert, F. (2018). Tesla's Giant Battery in Australia Reduced Grid Service Cost by 90% - Electrek. Available at: https://electrek.co/2018/05/11/tesla-giant-battery-australia-reduced-grid-service-cost/ (Accessed Nov 20, 2019).
Liao, J.-T., Chuang, Y.-S., Yang, H.-T., and Tsai, M.-S. (2018). BESS-sizing Optimization for Solar PV System Integration in Distribution Grid. IFAC-PapersOnLine. 51 (28), 85–90. doi:10.1016/j.ifacol.2018.11.682
Mpoweruk.com (2004). Battery State of Charge Determination. Available at: https://www.mpoweruk.com/soc.htm (Accessed Nov 11, 2019).
“National Energy Policy and Strategies of Sri Lanka” (2019). The Gazette of the Democratic Socialist Republic of Sri Lanka. No. 2135/61.
Swierczynski, M., Stroe, D.-I., Stan, A.-I., Teodorescu, R., Laerke, R., and Kjaer, P. C. (2013), “Field Tests Experience from 1.6MW/400kWh Li-Ion Battery Energy Storage System Providing Primary Frequency Regulation Service, ”In IEEE PES ISGT Europe, Lyngby, Denmark, October 6–9, 2013. doi:10.1109/isgteurope.2013.669527
Sperling, C. (2019). “Grid Frequency Dip of 10 January 2019: Causes and Theories,” Next-kraftwerke.Com. Available at: https://www.next-kraftwerke.com/energy-blog/who-is-disrupting-the-utility-frequency (Accessed Dec, 01. 2020).
Tamrakar, U., Shrestha, D., Maharjan, M., Bhattarai, B., Hansen, T., and Tonkoski, R. (2017). Virtual Inertia: Current Trends and Future Directions. Appl. Sci. 7 (7), 654. doi:10.3390/app7070654
Thomee, L. (2018). "Lithium-Ion Battery Storage for Frequency Control", Pdfs.semanticscholar.Org. Available at: https://pdfs.semanticscholar.org/bd9a/8e9c2c90d79a111b79686c885b040e9171c5.pdf (Accessed Dec 15, 2019).
Keywords: battery energy storage system, supercapacitors, dynamic stability, dynamic frequency response, solar PV, inertia constant, fast-active power injection, UPS
Citation: Aluthge CD, Hemapala KTMU and Lucas JR (2021) BESS as a UPS to Power Systems With High Solar Penetration. Front. Energy Res. 9:653015. doi: 10.3389/fenrg.2021.653015
Received: 13 January 2021; Accepted: 21 June 2021;
Published: 16 July 2021.
Edited by:
Ahmed Al-Durra, Khalifa University, United Arab EmiratesReviewed by:
Gabriela Nicoleta Sava, Politehnica University of Bucharest, RomaniaCopyright © 2021 Aluthge, Hemapala and Lucas. This is an open-access article distributed under the terms of the Creative Commons Attribution License (CC BY). The use, distribution or reproduction in other forums is permitted, provided the original author(s) and the copyright owner(s) are credited and that the original publication in this journal is cited, in accordance with accepted academic practice. No use, distribution or reproduction is permitted which does not comply with these terms.
*Correspondence: C. Devin Aluthge, ZGV2aW4uYWx1dGhnZUBrZHUuYWMubGs=
Disclaimer: All claims expressed in this article are solely those of the authors and do not necessarily represent those of their affiliated organizations, or those of the publisher, the editors and the reviewers. Any product that may be evaluated in this article or claim that may be made by its manufacturer is not guaranteed or endorsed by the publisher.
Research integrity at Frontiers
Learn more about the work of our research integrity team to safeguard the quality of each article we publish.