 Dayan Monzer
 Rodrigo Rivera-Tinoco
 Chakib Bouallou
95% of researchers rate our articles as excellent or good
Learn more about the work of our research integrity team to safeguard the quality of each article we publish.
Find out more
ORIGINAL RESEARCH article
Front. Energy Res. , 20 May 2021
Sec. Carbon Capture, Utilization and Storage
Volume 9 - 2021 | https://doi.org/10.3389/fenrg.2021.650303
This article is part of the Research Topic Molten Carbonate Fuel Cells for Simultaneous CO2 Capture, Power Generation, and Hydrogen Production View all 8 articles
High-temperature steam/CO2 electrolysis process has been the scope of study for the last decades. This study confers a feasible and environmental approach to convert low-carbon electrical energy into chemical energy, stored in the form of synthetic gas (H2 and CO) to be further processed in line with the final use target. It focuses on the Power-to-Methane technology using a high-temperature molten carbonates electrolyzer (MCEC). A large-scale process composed of the built-in MCEC model and the Balance of Plant (BOP) equipment is proposed and simulated with AspenPLUS software, taking into consideration the possible heat integration in the system for saving energy consumption. The proposed full-based process system shows an overall efficiency of 72%. The employment of this carbon neutral process relies on its economic competitiveness. For this reason, an economic assessment is conducted to investigate the economic feasibility of the proposed process. Indeed, the current methane production cost resulting from this process is not as competitive as market prices induced by other technologies. However, a parametric study demonstrating the impact factors on the methane selling price reveals that amelioration in the lifespan of the electrolyzer, accompanied by a reduction in its cost, can be an attractive solution, given the current market technology. This overall analysis sheds light on the role of the proposed process as an environmental-friendly and cost feasible solution for synthetic methane production.
The term, global warming, has been all over the media since the late 19th century. It is defined as the continuous increase in the average temperature of the climate system of the Earth. Researchers confirmed that carbon dioxide (CO2), released from fossil fuels and industrial applications, is considered the principal promoter of global warming, which, in turn, influences the temperature of the Earth's crust causing climate changes (Lacis et al., 2010). In this regard, a worldwide concern toward the objectives of reducing energy consumption, maximizing energy efficiency, switching into alternative fuels, increasing renewable energy share, and reaching a zero CO2 emissions were stated in the agreements: Rio in 1992, Kyoto in 1997, and Paris in 2015 (Klimenko et al., 2019). Unfortunately, the high penetration of renewable energy sources causes difficulty in integrating the electrical energy from renewable energy into the electricity grid because of their intermittency and fluctuation; thus a large-scale energy storage is required. To solve this problem, Power-to-Gas/H2 came as an alternative to store this intermittent energy in the form of chemical fuels, like hydrogen or synthetic gas, through water electrolysis.
The Power-to-Gas concept was studied using different types of electrolysis cells. The electrolysis can be conducted at low temperature using alkaline electrolyzers (AEL) or proton exchange membranes (PEM) or at high temperature using solid oxide electrolyzers (SOEC) or molten carbonate electrolyzers (MCEC). Among these different types of electrolyzers, high-temperature electrolysis cells seem as promising technologies, as their advantage is the low electrical voltage compared to low-temperature processes. This could be potentially converted into a major advantage if the need for thermal energy for steam generation is freely available from waste heat and if the technologies show higher lifespans than the systems available today. From kinetic point of view, high temperature reduces cell overpotential through promoting the electrode activity, which in turn, lowers the energy losses (Rashid et al., 2015).
High-temperature electrolysis technology was under development several years ago, but the effort has concentrated on solid oxide electrolysis cell. The first project was developed in Germany in 1980. Eight years later, the development of this technology has reached an advanced status where a single cell has been operated for a long-term test (Donitz and Erdle, 1985). In the 21st century, this technology recaptured attention with the increase in renewable energy capacity, since it was considered an effective solution to balance between renewable energy fluctuation and energy supply-demand. Several studies were carried out to study the feasibility of SOEC electrolyzer in the Power-to-Gas process. At the SOEC performance level, it was found that the potential losses of the cell can be reduced with the decrease in the current densities and the increase in temperature of the cell (Udagawa et al., 2007). In 2009, a research program was established at the Idaho National Laboratory (INL) to tackle the issues associated with the industrial scaling up of the solid oxide electrolysis cell technology for efficient production of hydrogen from high-temperature steam (Brien et al., 2009). Within this program, a large-scale high-temperature based on solid oxide electrolyzer process performance was evaluated, and it was revealed that the overall syngas production efficiencies could reach 50% for High Temperature Electrolysis (HTE) with reactor outlet temperature above 850°C (O'Brien et al., 2010). Later, Petipas et al. (2013) demonstrated that a pressured high-temperature SOEC based system showed a 91% efficiency that is influenced by the operating power load. In Laoun (2007), the entire efficiency of the water electrolysis was expected to be improved by high pressure or low temperature operation. The latter was confirmed by a research work performed years later by Wendel et al. (2016), which revealed that higher efficiencies can be achieved either with pressurized systems operating at a higher temperature and fuel utilization or with non-pressurized systems running at low temperatures.
More recently, effort has been focused on carbon dioxide capture and utilization, as well as renewable energies, for reducing the CO2 emissions. This target raises the concern on the co-electrolysis of CO2 and H2O in high-temperature electrolysis cells as the concept of the co-electrolysis of CO2 and H2O to produce synthetic gas was first studied by Stoots et al. (2008) and then by Taylor et al. (2009) using a solid oxide electrolysis cell. Stoots et al. (2008) deduced that CO is chemically produced via Reverse Water Gas Shift (RWGS), and there is no electrolysis of CO2. On the contrary, Taylor et al. (2009) showed, through their study on the variation of ASR between H2O electrolysis and CO2 electrolysis, that the reduction of CO2 and H2O occurs in a Ni/YSZ-based SOEC during the co-electrolysis of steam and CO2 to produce CO. Besides, the authors stated that the CO is also produced via RWGS in parallel with the electrochemical reactions. Later, Ni (2012a,b) presented a 2D model to study the co-electrolysis of CO2/H2O in the SOEC for syngas production and assess the contribution of the RWGS reaction to the CO production. It was found that the RWGS reaction significantly alters the H2O/CO2 electrolysis, where its contribution depends on the operating temperature and the inlet gas composition. Also, the study showed that CO is produced by RWGS reaction at low operating potential; however, it is produced via WGS reaction at high operating potential.
Syngas production, mainly CO, within the cell through CO2 electrolysis or RWGS has turned into a promising approach in the Power-to-Gas process. Redissi and Bouallou (2013) has considered the co-electrolysis of H2O and CO2 in the solid oxide electrolyzer when examining the overall Power-to-Gas process. This process revealed an efficiency of 62.3%, which is lower than the system that produces only hydrogen. On the other hand, Er-rbib et al. (2018) evaluated the overall performance of the Power-to-Gas system based on SOEC, showing a 67.1% process efficiency. In their simulation, CO is chemically produced and not electrochemically. Indeed, the concept of co-electrolysis in SOEC is still ambiguous due to the contradictory outcomes.
During these 40 years, high-temperature steam electrolysis using the solid oxide electrolyzer technology has reached an advanced level concerning the electrolyte composition and electrode materials (Hu et al., 2014). However, this technology is mainly functioning at high temperature between 973 and 1,073 K, which leads to various challenges in term of (a) cell degradation, (b) longer start-up/break-in duration, (c) mechanical instability due to thermal stress, and (d) loss of gas tightness (electrolyte/sealant failure) (Pandiyan et al., 2019).
On the contrary, molten carbonate fuel cell technology, that has already been commercialized and implemented in South Korea, the USA, and Europe (Chery et al., 2015a), is now under the scope of interest in the field of CO2 capture and storage accompanied by the renewable energy storage through the co-electrolysis of CO2 and H2O in a molten carbonate electrolysis cell. In fact, this type of electrolyzer is recommended for CO2 transformation since CO2 is highly soluble in the molten carbonates, which are the electrolytes of the MCEC (Chery et al., 2015b).
As for the co-electrolysis of CO2 and H2O in the MCEC, there is still a lack of comprehension regarding the CO2 electrochemical reaction into CO using the conventional fuel cell set-up, which is molten carbonate electrolyte, and the Ni and NiO as catalysts for the fuel and oxygen electrodes, respectively. Most of the studies, that proved the conversion of CO2 into CO or C, were performed using flag electrodes. Peelen et al. (1997) studied the electrochemical reduction of CO2 into CO on a gold flag electrode in 62/38 mol % Li/K carbonate mixture in the temperature range of 575–700°C. Also, Kaplan et al. (2010, 2012) reported the conversion of CO2 to CO by using a cell with a molten electrolyte mixture of lithium carbonate and lithium oxide at 850–900°C. The electrodes were graphite (anode) and titanium (cathode) and not conventional MCFC electrodes (Ni-based materials), and the working temperature was much higher than that of the MCFC system. Despite all the studies performed on high temperature co-electrolysis, there is no concrete evidence for the electro-reduction of CO2 into CO using the conventional MCFC as an electrolyzer. Accordingly, more studies are currently under research to find the best electrocatalyst to promote the CO2 electro-reduction in the MCEC (Meskine et al., 2020).
This study aims to assess the molten carbonate electrolysis cell in the syngas production and energy storage, taking into account all the unitary operations needed to achieve a low energy intensive process that provides syngas in the specifications required. To do so, a fully-proposed process is simulated with AspenPLUS using the built-in MCEC model, and the Balance of Plant (BOP) equipment. The concept of the process is to convert H2O and CO2 into synthetic gas (H2 + CO) and then into synthetic methane, while taking into consideration the possible heat integration in the system for saving energy consumption. Afterward, a process efficiency study is performed to get an overview of the energy efficiency feasibility of the proposed MCEC power plant process. Finally, an economic study is accomplished to comprehend the cost feasibility of such a process and identify the cost-driver parameter of the production cost of methane.
The electrochemical reactions involved in the molten carbonate electrolysis cell are the reduction of H2O with the help of CO2 at the cathode electrode side and the oxidation of the carbonate ions at the anode electrode side, as presented in Equations (1) and (2), respectively. CO2 inlet at the cathode side is essential for producing carbonate ions, thus preventing degradation of the cell caused by the loss of carbonate based electrolyte. According to the study of Bove et al. (2020), it was reported that a low CO2 cathode feed can substantially affect the electrochemistry of the cell.
Many studies have been carried out on the possibility of electrochemical conversion of CO2 into CO, as presented previously in the literature, through the following reaction (Equation 3):
In this study, CO2 electrolysis (Equation 3) is not considered since it was reported that it is kinetically slow compared to H2O electrolysis (Equation 1) (Watanabe, 2016). Nevertheless, carbon monoxide is still chemically produced via RWGS (Equation 4).
On the other hand, the presence of CO2 and H2 in the inlet feed gas can lead to the formation of methane gas inside the cell through a methanation reaction (Equation 5).
The cell potential, Vcell (Equation 6), is an essential parameter in the electrochemical process and is a function of the operating conditions, temperature, gas composition, flow rate, and the current density (j). The electrochemical model consists of three terms: reversible voltage Vrev (Equation 7), that is a function of temperature, Nernst voltage, Vnernst (Equation 8), which depends on both temperature and partial pressure of the gas, and a term named Area Specific Resistance (ASR), representing the overpotential losses of the cell, as presented below.
In fact, the voltage required for operating an electrolysis cell is significantly higher than the theoretical reversible voltage, Vrev, due to the overpotential losses resulting from gas diffusion and transportation, charge transfer, and the resistance of the electrolyte and the electrodes. These losses can be categorized into three types, ohmic resistance losses, activation losses, and concentration losses. From Ohm's law, ohmic losses can be calculated as a function of temperature. Activation losses are determined based on the Butler-Volmer equation that depends on the materials used. For the concentration losses, they express the losses due to the mass diffusion of the reactants from the bulk phase into the reaction phase and are calculated from Fick's law (Ni, 2012b).
However, these losses equations require more detailed experimental data that is lacking in this study. Consequently, a gray-box model, derived from experimental data performed on a solid oxide electrolysis cell by Fu et al. (2010), is adapted for this study because it provided accurate results. Besides, this exponential form model was used by several authors with different coefficients based on their experimental data (O'Brien et al., 2010; Petipas et al., 2013; Mottaghizadeh et al., 2017). Therefore, the overpotenial losses, mentioned in this study, are calculated by the ASR equation below (Equation 9):
In this study, the ASR exponential term equation (Equation 8) with a coefficient A0 equal to 1 Ω.cm2 is considered and corrected by a factor ε (Ω.cm2), which symbolizes the adjustment related to the difference in electrode-based catalyst and to cell materials between the SOEC and the MCEC. The correction factor, ε, is calculated based on the current density vs. cell potential graph in Figure 1, supplied from the experimental work performed at the laboratory of the École Nationale Supérieure de Chimie de Paris (Meskine et al., 2020). The laboratory testing electrolysis cell is a single cell setup with an electrode surface area of 3.14 cm2, developed with the aid of Fiaxell® testing systems. It includes the stack electrodes (fuel electrode Ni and oxygen electrode NiO, 2.1 cm diameter and 0.08 and 0.069 cm thickness, respectively), the electrolytic matrix (γ − LiAlO2, 3.6 cm diameter and 0.05 cm total thickness), and the electrolyte (Li-K 62:38 mol%, 3.6 cm diameter and 1.8 mm total thickness). The cell operates at 650°C and at atmospheric pressure. The cathode side (fuel electrode) of the cell is fed by a gas mixture of 64% H2, 20% H2O, and 16% CO2, while the anode side inlet gas composition is 30% CO2, 15% O2, and 55% N2.
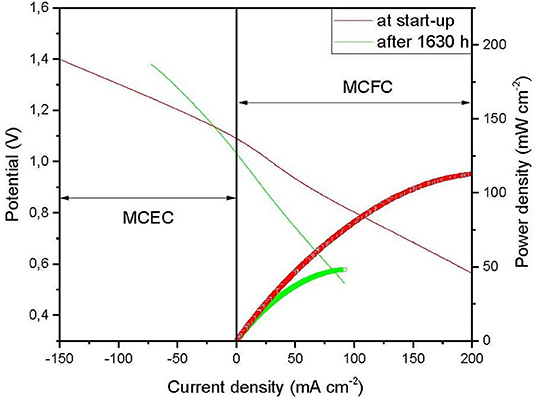
Figure 1. Cell potential vs. current density supplied from the experimental data (Meskine et al., 2020).
The experimental graph in Figure 1 is composed of four curves, where the thin curves correspond to the current voltage profile, and the thick ones represent the cell power trend with the current density, at start-up of the cell (red one) and after 1,630 operating h (green one). In our case, the model is performed at the steady state; therefore, the experimental data is extracted from the thin red curve. From this curve, a linear regression equation of the form y = ax + b is extracted. The slope value, a, in this equation, represents the ASR value. Accordingly, the factor ε is calculated by a simple subtraction phenomenon between the value, a, and the first term of the ASR equation, [A0exp()] value, adapted from Fu et al. (2010).
As for the model results, Figure 2 shows the cell potential in both electrolysis and fuel cell modes as a function of current density, where negative current densities correspond to the electrolysis mode and the positive ones to the fuel cell mode. The results show a satisfactory agreement with the experimental results with an average error of around 2% (Figure 2). Besides, the model is validated by the experimental results obtained by Pérez-Trujillo et al. (2020) at different inlet compositions. The model results agree with the experimental ones with an average error of 1% for 50/25/25% H2O/CO2/H2 inlet gas mixture composition and a 4% for 25/50/25% H2O/CO2/H2 composition.
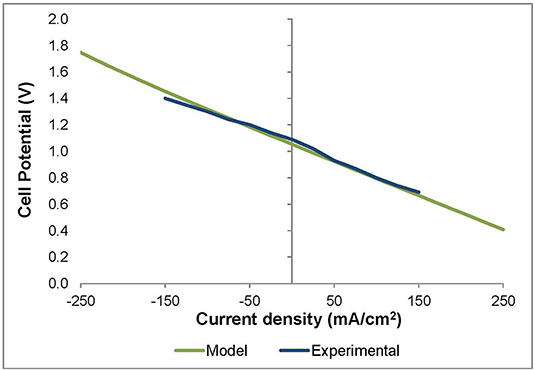
Figure 2. Model and experimental curves representing the cell potential (V) as a function of the current density (mA/cm2) in both electrolysis cell (left) and fuel cell (right) modes.
Another parameter must be taken into consideration when operating the cell. This parameter is called thermo-neutral potential, Vtn, which corresponds to the voltage at which the cell charge or discharge process puts out zero heat. More specifically, if the cell potential is lower than Vtn, the cell is in an endothermic state; thus, the gas outlet temperature will be lower than the inlet temperature. On the contrary, if the cell potential exceeds Vtn, the cell reaches an exothermic state, causing an increase in outlet stream temperature. In other words, this temperature fluctuation can be explained by the fact that the heat produced by electric heating is smaller than the heat required by the reaction at cell potential below Vtn; however, it is higher than the heat required by the reaction when the cell voltage transcends Vtn. Therefore, Vtn is calculated based on the electrolysis heat enthalpy, ΔHTcell, r, using the equation below (Equation 10):
The temperature profile vs. the cell potential resulting from the model, illustrated in Figure 3, is in agreement with the previously stated theoretical fact and the state-of-the-art (Hawkes et al., 2007). From this result, it can be deduced that the model used in this study has been successfully validated.
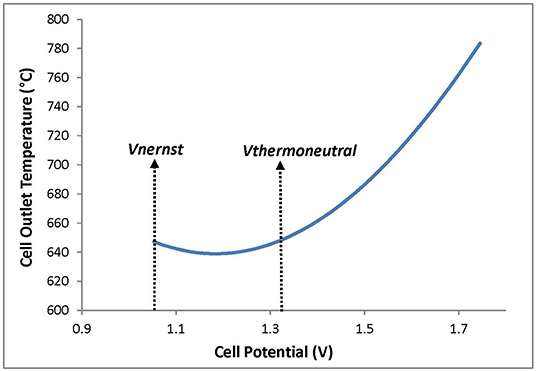
Figure 3. Effect of the cell potential on the outlet temperature of the cell streams during electrolysis cell mode.
Methane is synthesized via a thermo-chemical hydrogenation of a carbon source, carbon monoxide (CO), and/or CO2, with the aid of a metal catalyst (Seemann and Thunman, 2019; Vlap et al., 2019), according to the reactions in Equations (11) and (12). These two reactions are connected to the reverse water-gas shift RWGS reaction which represents an intermediate reaction.
Both reactions are strongly exothermic with a standard reaction enthalpy of ΔHR298K = −205.9 kJ/mol and ΔHR298K = −164.8 kJ/mol, respectively (Seemann and Thunman, 2019). Consequently, the enormous heat released must be removed to avoid thermal degradation of the catalyst and damage to the reactor walls.
The synthetic gas produced from the electrolysis process contains H2, CO2, and CO. For the methanation process to occur, the syngas composition must follow a mole-fraction based ratio (ZH2 − ZCO2)/(ZCO2 + ZCO) of around 3 (Wang et al., 2019).
An MCEC model was applied for a single cell and implemented with the ASPENPLUS software for the process simulation. At the scale-up of the MCEC unit, a number of cells are assembled together and separated by a bipolar plates to form what is called a “Stack.”
For the process simulation, a sensitivity analysis was conducted to study the effect of the inlet composition on the cell potential and syngas composition. From this study, the inlet composition was chosen in a way to get a syngas composition following a specific ratio of 3 required for methanation.
In this process simulation, some assumptions were applied to the MCEC stack model:
• The presented MCEC stack of 250 kW power consumption consists of a series of cells with an electrode active area of 9,000 cm2, based on the industrial surface area of the MCFC cell produced by the Fuel Cell Energy Manufacturers (Fuel Cell Energy Inc., 2005), where the scale-up of the model is performed by determining the number of cells required for the stack to consume 250 kW electric power.
• The possible reactions that may occur within the bipolar plates are not considered.
• The methanation reaction inside the cell is not considered in this study because the inlet conditions of the cell do not meet the ones required to promote methane production.
Figure 4 below shows a decomposition of the Power-to-Gas system into three main subsystems:
1. The Electrolysis Process, which includes the MCEC stack and all additional components that provide the desired operating condition. The main responsibilities of this subsystem are:
• Vaporizing the water and the CO2 feed mixture at the cathode side to generate a fully vaporized stream using the waste heat from the system (Steam generation block)
• Heating the inlet streams of the cell to its target operating temperature, which is 650°C
• Producing syngas within the MCEC stack
2. The Syngas Purification and Post-treatment subsystem, which is responsible for:
• Separating water from syngas
• Compressing and heating the syngas to reach the conditions required for promoting methane synthesis
3. The Methane Synthesis Process which is in charge of:
• Transforming syngas into a methane product within the reactor
• Purifying the produced methane to meet the specification required to inject it into the natural gas (NG) grid
In Figure 4, the solid lines represents the flow streams, while the dashed lines refer to the energy streams where the blue ones correspond to the heat released and the red ones to the heat supplied. The steam generation block refers to the process where the waste heat from the system (blue dashed lines), represented by Q1 (heat released during methanation process), Q2 and Q3 (cooling duties of the product streams of the cell), and Q4 (heat of condensation of water in the methane reactor product), is transferred through a series of heat exchangers into the inlet feed of the cell (red dashed line). This process will be demonstrated in section 2.5.1. Besides, the main thermo-chemical properties of the main streams in Figure 4 are reported in Table 1.
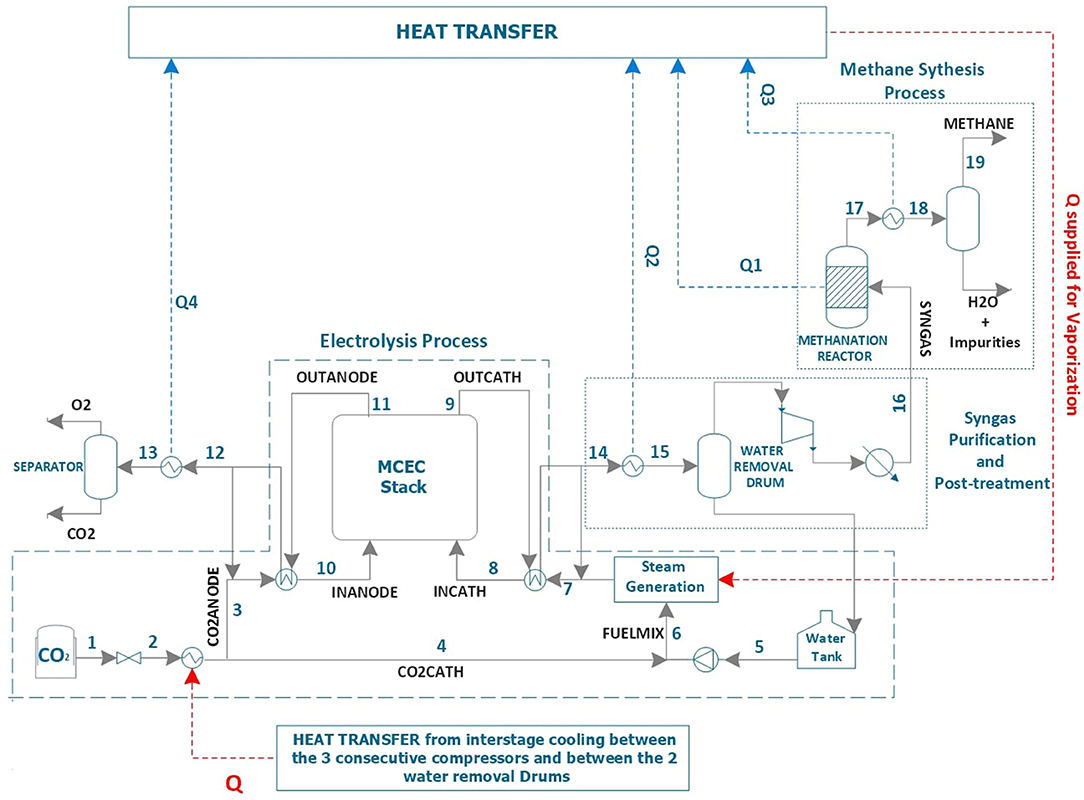
Figure 4. General configuration of the Power-to-Gas (methane) system using MCEC electrolyzer.
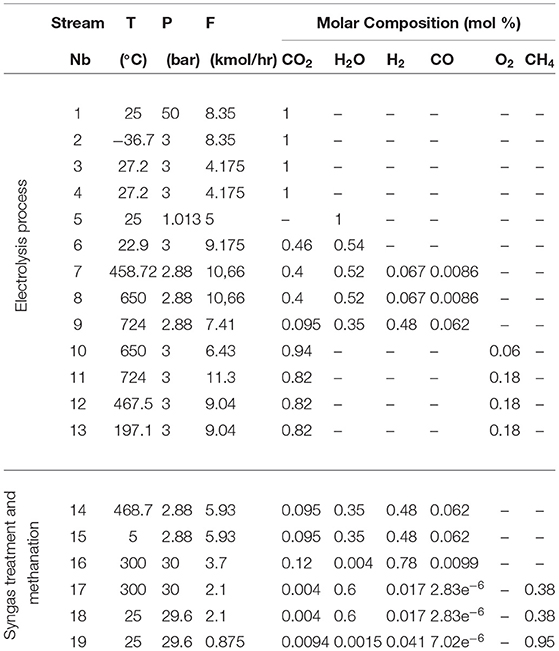
Table 1. Summary of the thermodynamic and chemical properties of the process streams.
At the start-up of the system, water coming from the supply network, at ambient temperature and atmospheric pressure, is pumped to meet the operating pressure 2.94 bar, as shown on the right side of Figure 4. In parallel, a stored CO2 at ambient temperature and 50 bar is expanded via a valve. In this simulation, a pure CO2 is considered and its conditions are chosen based on the fact that CO2 is transported, stored, and handled at two conditions, either ambient temperature and pressure of 45–65 bar or temperature between −35 and −15°C and pressure of 12–25 bar (Properties et al., 1990). The outlet temperature of the valve is below 0°C, so it is reheated through heat exchangers to reach around 35°C.
The CO2 stream is split into two equal flow fractions to supply both sides of the cell since an inlet flow is needed to sweep out the produced CO2 and O2 at the anode electrode side. Besides, this flow fraction of CO2 at the anode electrode side also serves as a cooling utility required to cool down the exiting products before purification.
The electrolysis process operates in two closed loops which are only connected based on the phenomenon occurring at the MCEC stack level. The first loop called oxygen loop (Anode side), presented on the left side of Figure 4, is supplied by the inlet stream, CO2ANODE, and the recycled stream from the outlet stream of the cell, OUTANODE. This mixture stream will be heated up to 650°C by a heat exchanger using the outlet stream, OUTANODE, as a heating utility. Afterward, the outlet stream, OUTANODE, is further cooled down by a heat exchanger where a heat duty, Q4, is released. This stream contains CO2 and O2 that can be separated in order to take advantage of selling oxygen and recycling CO2 into the process.
Regarding the second loop on the cathode side, the stream, named CO2CATH, is mixed with water exiting the pump. The mixture stream is vaporized through a steam generation process, that will be discussed in details in section 2.5.1. After this process, the vaporized stream is mixed with the recycled stream from the cell, which will be heated via a heat exchanger using the outlet stream, OUTCATH, as a heating utility, and an additional heater to reach the target temperature of 650°C.
As for the purification and the post-treatment subsystem, it is initiated by cooling down the OUTCATH stream to condense the contained water and separate it from the rest of the stream to be further stored and reused. This procedure required a heat exchanger, by which a heat duty Q2 is released, and a fan to reach ambient temperature, followed by two drum to remove the condensed water, with an inter-stage cooling via a heat exchanger, to promote water condensation and separation. The heat released by the inter-stage cooling is used to heat up the inlet CO2 and is represented by the red dotted stream, Q, in Figure 4. In Figure 4, a single drum is illustrated, representing water separation.
Subsequently, rich synthetic gas exiting the water removal drum enters a new procedure to be prepared for methanation. First, it is compressed by three consecutive compressors of pressure ratios 2.8 to attain the operating pressure of methanation, which is chosen to be 30 bar. The compressors are accompanied by inter-stage coolers to remove the heat generated by compression, thus lessening the compression work and avoiding mechanical damages. Besides, these inter-stage coolers exchange heat with the CO2 inlet feed through heat exchangers. This overall compression process is summarized by a single compressor in the configuration presented in Figure 4. Finally, the synthetic gas composed of H2, CO, and CO2 passes through a heater to increase its temperature to 300°C, a temperature recommended for the methanation catalyst to be active.
Finally, the syngas stream is fed into an iso-thermal reactor, where methane synthesis will take place. Then, it exits the reactor at a temperature of 300°C to be cooled down into ambient temperature. This step is mainly performed to promote the separation of water and other impurities from the produced methane in order to meet the final use specifications. Throughout this process, the heat released, represented by the heat duty, Q1, in Figure 4, is supplied to the steam generation process. The methane product can be stored and transported to the consumers or can be directly injected into the NG grid. The latter is considered as a final use of the synthetic product. The NG grid requires specifications for the gas before injection. Some countries set out their particular specifications for injecting the NG into the network. For instance, the NG network in France entails specific requirements. Thus, NG, that will be injected into the NG grid in France, must contain <2.5% CO2, <2% CO, and <6% H2 and have a Wobbe index range between 49.1 and 56.52 MJ/Nm3 (MARCOGAZ, 2006). In this study, the final synthetic methane product contains 94.8% CH4, 4.1% H2, 0.9% CO2, 0.15% H2O, and traces of CO and has a Wobbe Index of 52.02 MJ/Nm3 (at 0°C and 1 atm standard conditions). With these properties, it can be deduced that the produced methane strongly satisfies the french grid requirements.
The mixture stream (H2O and CO2) passes through five heat exchangers (HX4, HX5, HX6, HX7, HX8) with different heat sources to obtain a vapor state stream, as shown in Figure 5. The steam generation process utilizes the most available heat sources in the system.
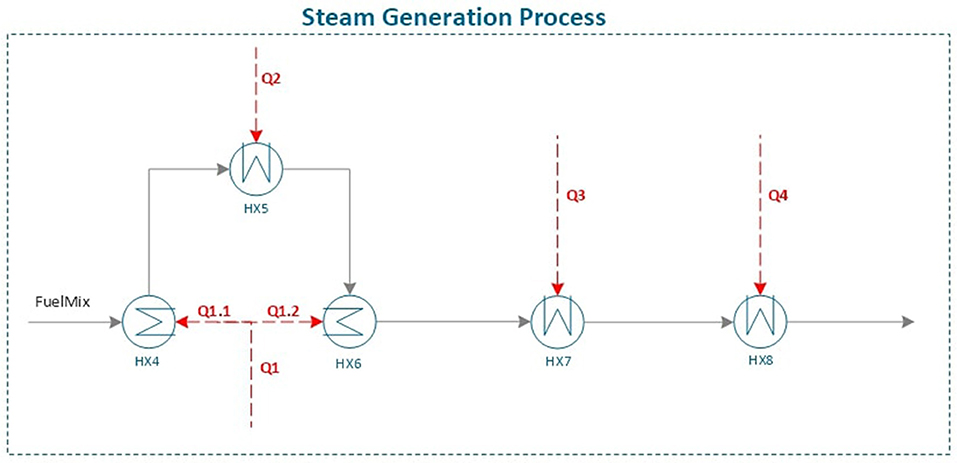
Figure 5. Steam generation subsystem within the full MCEC process system.
Starting with the complementary heat exchangers, HX4 and HX6, presented on the left side of Figure 5:
• The heat source is supplied to the liquid mixture by the steam, which is condensed in HX6 and cooled in HX4
• This steam is generated by the absorbed heat from the methane synthesis reactor to keep it in an iso-thermal state
The feed mixture utilizes the heat remained in the cooling water (Q1.1) through the heat exchanger HX4 and then passes into the second heat exchanger HX5. The heat exchanger HX5 transfers the heat (Q2) between the liquid mixture and the syngas exiting the cell at the cathode side. After that, the partially vaporized feed is supplied with additional heat (Q1.2) through heat exchanger HX6, which uses the steam from methane reactor, and two other heat exchangers HX7. The heat exchanger HX7 transfers the heat (Q3), that is the heat of condensation of the methane product stream exiting the reactor. By these four series heat exchangers, the feed stream is totally vaporized. However, additional heat is provided by the heat exchanger HX8 to further increase the feed temperature. This heat (Q4) is supplied from the outlet stream of the oxygen electrode (anode side) into the feed liquid stream.
The performance of the system is investigated by evaluating the overall efficiency. The efficiency of the MCEC system, ηMCEC, is defined by the ratio of heating power contained in produced methane and the total consumption of the system, which is composed of the power consumed by the stack, , and the consumption of the BOP equipment, .
In order to achieve the best performance of the overall process, several improvements have been performed throughout the process development. This improvement scenario mainly targets the steam generation process and can be presented in three different cases, which are discussed below (see Figure 5).
• Case I: Water and CO2 vaporization using only an electric heater
• Case II: An electric heater accompanied by the heat integration from the system represented by two heat exchangers: HX5 and HX7
• Case III: Three additional process heat exchangers, namely HX4, HX6, and HX8, are added to the previous case, eliminating the need for an electric heater.
The electric energy consumed by the process and the heat contained in the produced methane in the three cases are summarized in Table 2. From this data, the overall performance of the system for the different cases is evaluated. The results, displayed in Figure 6, revealed a considerable improvement of 20% in the efficiency from the first two cases to the third one. While comparing the modifications between the cases, the heat integration via the heat exchangers HX5 and HX7 has slightly improved the performance of the system. However, the noticeable improvement is obtained when the heat exchangers HX4 and HX8 are added, reaching a value of 72%. These heat exchangers supply an overall duty of 70.47 kW. By this step, the primary energy consumed for steam generation, included in the value of , is reduced, leading to an increase in the overall efficiency.
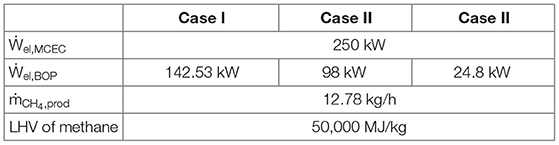
Table 2. The power consumption values of the system for the three cases.
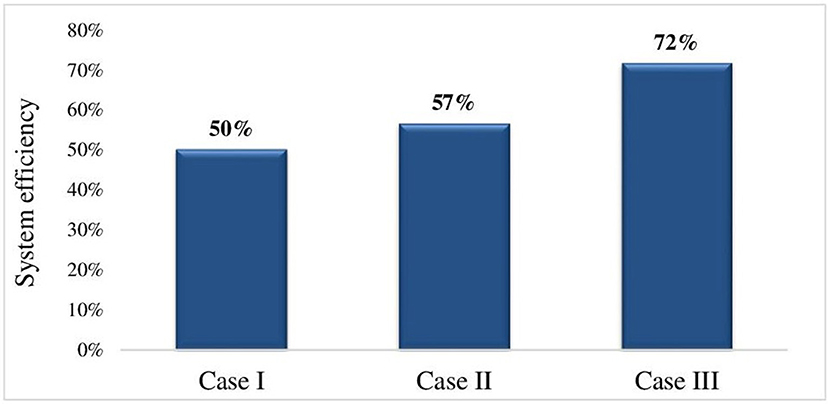
Figure 6. The efficiency evolution of the overall system from Case I into Case III.
Combining the process modification and the pinch integration enables us to manage improvement in the energy efficiency of the process by acting on energy recovery and reuse possibilities. In this study, the pinch integration will not be addressed. However, the hot composite and cold composite curves of the process streams, as well as the grand composite curve, are presented in Figures 7, 8, respectively. These curves correspond to the case III scenario and aim to determine the minimum utility requirements of the system. The results revealed that the minimum heating utility required is 0 kW and the minimum cooling one is 75.16 kW. By comparing these values with that of case I and II, it was found that the minimum heating and cooling utility requirements are lower in case III. The results of the pinch study reveal that the process integration can be further optimized to eliminate the 9 kW heating utility used in the proposed process.
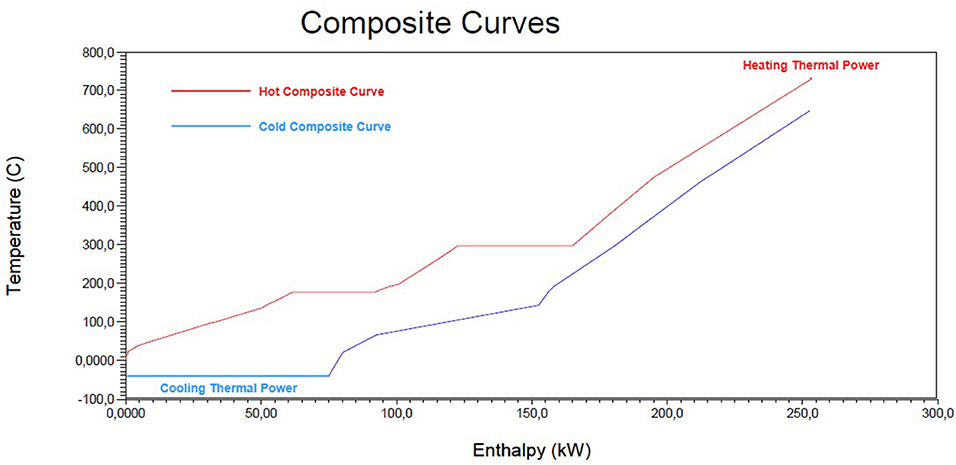
Figure 7. Composite Curves of the process stream for Case III.
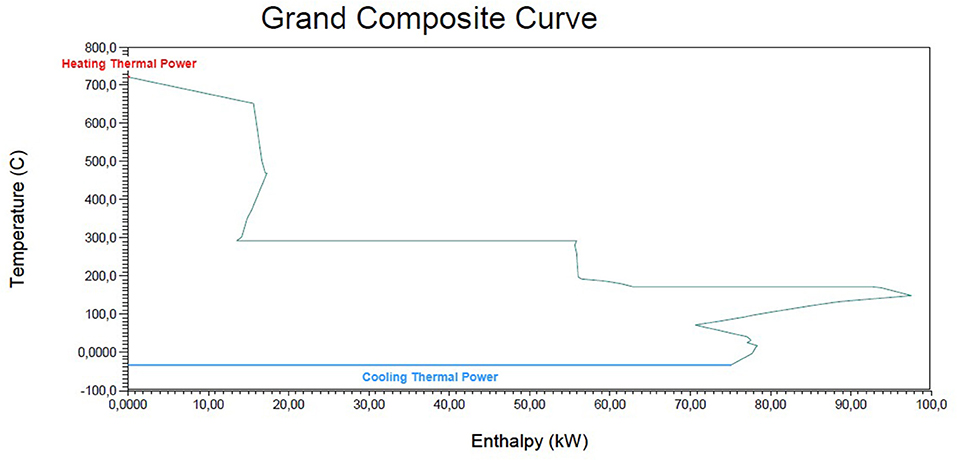
Figure 8. Grand Composite Curve of the process stream for Case III.
Following the overall system simulation, an economic assessment is fulfilled to evaluate the capital investment and the operating expenses of the process plant. The costs of the main equipment are calculated as per kW consumed, based on our own price database with other data presented in the other literature (Rivera-Tinoco et al., 2016; Remick and Wheeler, 2010; Dadhich et al., 2005). It is relevant to note that the data chosen for this study is dated back to 2005 and 2010 and is not updated due to the fact that obtaining new cost data is restricted to institute privacy policies, and it is quite expensive. The chosen data mainly targets the MCEC cost and the purchase price of CO2. For this reason, these parameters were estimated for the reference case, and a sensitivity analysis was performed to investigate the influence of these costs on the selling price of methane. All these expenses have been put together within the Equation (14) stated below (Rivera-Tinoco et al., 2016), intending to estimate the actualized cost per amount of methane.
where:
CTAi Actualized total cost (€/kg)
Cinvest Investment cost excluding electrolyzers (€)
Celectrolyzer Investment cost of electrolyzer (€)
Cenergy Operating cost related to energy consumption (€)
Cfeedstock Annual feedstock cost (water, CO2) (€)
Creplace Investment cost of replacement of the equipment and electrolyzer (€)
Cmaintenance Maintenance expenses excluding replacement expenses as a % of energy costs (€)
Pi Annual production of component i (methane) (kg)
t Year in which expenses are executed
T Lifespan of production unit (years)
τ Actualization rate
In this assessment, the investment cost, CAPEX, is determined by considering the cost of the cell and all the required balance of plant equipment costs. Along with that, a replacement cost is calculated according to the lifespan of each equipment, the operating hours, and the overall lifetime of the plant which are chosen to be 8,000 h/year and 20 years, respectively. The maintenance cost is postulated at a level of 3% of operating costs and an actualization rate of 10%. For the operating cost OPEX, it is calculated as per kg of water and CO2 required and as per kW of the electrical power consumed. It is relevant to note that investment cost and lifetime of the balance of plant equipment, the water cost, maintenance cost, and the actualization rate are kept fixed throughout the overall study.
At the very beginning, it should be mentioned that the cell stack cost, lifespan, and the cost of CO2 feedstock are assumed to be among a range of price values acquainted in the literature (Remick and Wheeler, 2010; Dadhich et al., 2005). Besides, the price of the molten carbonate electrolysis cell is assumed to be the same as the molten carbonate fuel cell due to the same material structure and catalyst used. In this simulation, the investment cost of the MCEC, which includes all of the fuel cell module, the BOP equipment, and the installation and commissioning expenses, and the lifetime of the cell are fixed to be 3,500€/kW and 10,000 h, respectively (Remick and Wheeler, 2010), while fixing all other equipment cost and lifetime. Regarding the feedstock expenses, the cost of water is fixed at 3€/ton (Rivera-Tinoco et al., 2016), and the price of the captured CO2 is assumed to be 50€/ton, which can fluctuate depending on the technology used to capture it (Dadhich et al., 2005). For the electricity cost, a value of 80€/MWh is fixed, where this cost may change from one country to another depending on the renewable energy sources used to generate electricity.
Using this pricing database, the price of the methane was found to be 12.58€/kg. This value is extremely high compared to the market price, which is 1.103€/kg in Europe (European Commission, 2017). In addition to the final methane price, a cost breakdown scenario is presented in Figure 9 to have a valuable overview of the cost details and to know the major contributor for cost reductions. According to the graph, the CAPEX, including both first investment at year 0 and the replacement expenses throughout the lifetime of the plant, represents around 75% of the total cost. Consequently, these results provide a beneficial perspective regarding the parameters corresponding to cost reduction.
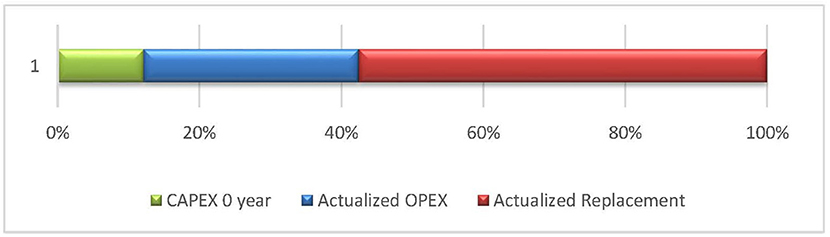
Figure 9. Methane cost breakdown based on CAPEX, OPEX, and replacement of the equipment.
The target of this study is to gain a better understanding of the cost drivers and find out the limits of the cost reductions. As known, two complementary costs are involved while performing an economic study, which are the capital investment, CAPEX, and the operating cost, OPEX. The reference case revealed a higher CAPEX over the OPEX. Therefore, four parameters related to both the CAPEX and OPEX are investigated within a logical range. Besides, the cost of methane is assessed under the variation of:
• Lifespan and cost of the electrolyzer (CAPEX)
• Captured CO2 Cost and electricity expenses (OPEX)
First of all, the electrolyzer counts as the major contributor to the large investment and replacement costs, which gives the notion for studying the influence of the cost with variation in both the lifetime and the investment price of the electrolyzer.
Figure 10A illustrates the fluctuation between the OPEX and the CAPEX, mainly the replacement expenses with the increase in the lifespan of the electrolyzers. The variation of the lifespan of the electrolyzer from 10,000 to 20,000 h dramatically reduces the replacement cost by around 30%. A further increase in the lifetime of the cell causes an additional replacement cost reduction of 12%. This variation in the replacement cost can be translated to a decrease in the methane cost, as shown in Figure 11. The cost of methane is reduced by 39%, while increasing the lifetime of the cell by 10,000 h. In general, a 50% reduction in methane cost is obtained with 50,000 h of lifespan instead of 10,000 h. Thus, the lifespan of the electrolyzer largely impacts the final price of methane, which means that more effort is required to improve the lifetime of the electrolysis cell.
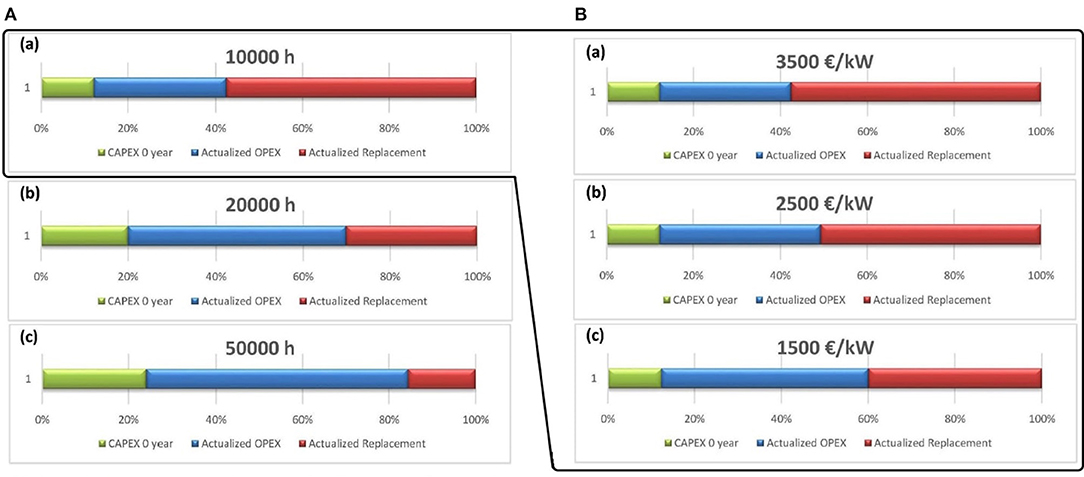
Figure 10. Methane cost breakdown based on CAPEX, OPEX, and replacement of equipment against variation on lifespan of the electrolyzer (A) and price (B). (A) Cell's lifetime of (a) 10,000 h, (b) 20,000 h, into (c) 50,000 h. (B) Electrolyzer's price of (a) 3,500€/kW, (b) 2,500€/kW, into (c) 1,500 €/kW.
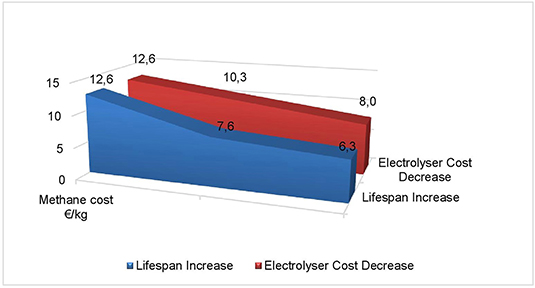
Figure 11. Methane cost as a function of the electrolyzer's lifespan and cost.
On the other hand, another parameter, the capital cost of the electrolyzer, may affect the price of methane. In Figure 10B, the cost breakdown with variations to the price of the electrolyzer at a fixed lifespan of 10,000 h is presented. This demonstration aims to evaluate the extent of influence of the cost of the cell compared to the lifetime of the cell. Following the results shown in Figures 10B, 11, a slight alteration in the replacement cost with a decrease in the capital cost of the electrolyzer compared to that of the lifetime variation can be regarded (Figure 10B). This minor variation contributes to a reduction of around 36% in the cost of methane (Figure 11). Moreover, it can be noticed from Figures 10A,B that the cost breakdown at a lifespan of 20,000 h and at an electrolyzer cost of 1,500€/kW are approximately analogous. This observation asserts the significant need to improve the lifetime of the cell since a slight increase in the lifespan has the same impact as a considerable decrease in the price of the cell. Despite the small impact of the cost of the electrolyzer, a decrease in its cost, accompanied by an improvement in its lifespan, can be an economically effective target scenario.
Apart from the CAPEX impact on the price of methane, the captured CO2 cost and the electricity expenses, representing the OPEX, are assessed to identify their effect on the cost of methane. In Figure 12A, the cost breakdown of methane is presented with variation in the captured CO2 cost between 20 and 100€/ton. In fact, the price of the purchased CO2 depends on the technology used by the supplier to capture CO2. As expected, the operating cost diminishes with low CO2 price. This minor decrease in the operating cost leads to a slight drop in methane price. While viewing the influence of decreasing CO2 price from the reference case value to 20€/kg, a 9% reduction in the methane cost is noticed. Therefore, it can be deduced that the purchase price of CO2 has a slight or even negligible influence on the methane market price.
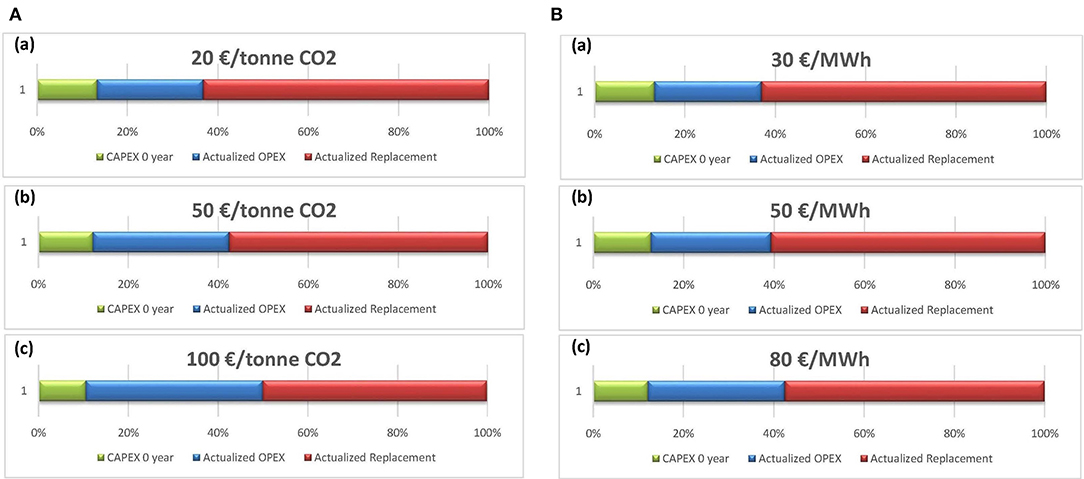
Figure 12. Methane cost breakdown based on CAPEX, OPEX, and replacement of the equipment against variation on CO2 (A) and electricity cost (B). (A) CO2 cost from (a) 20€/ton, (b) 50€/ton, into (c) 100€/ton. (B) Electricity cost from (a) 30€/MWh, (b) 50€/MWh, into (c) 80€/MWh.
The electricity charge is a complementary parameter within the operating cost. The fluctuation in this price will certainly affect the OPEX of the plant. To better conceive the degree of this modification, a parametric study on the electricity cost is conducted, and the outcomes are displayed in Figure 12B. The depreciation of the electricity cost from 80 to 30€/MWh slightly modifies the OPEX with an entire reduction of around 7%, coupled with a decrease of 1.11€/kg in the price of methane. This assessment demonstrated the insignificant impact of the electricity cost on both the OPEX and the price of methane.
As inspired by the parametric study, the best state for having an approximate competitive methane selling price with the current market price is proposed. In terms of priority, the lifespan of the electrolyzer proved to be the major influencing factor on the methane selling price. Therefore, improvement in the durability and lifetime of the electrolyzer will be an effective target. Thereafter, the investment cost of the electrolyzer comes as a supplementary parameter for the high methane price. Regarding the OPEX parameters (CO2 and electricity expenditures), they contribute to minor effects on the methane cost. In conclusion, an improved lifetime of the electrolyzer, a low cell cost per kW, and a low utility cost can result in a relatively low methane marketing price. These conditions were assessed and a methane price of 2.83€/kg was estimated, which is 78% lower than the reference case. It is obtained at the following state:
• 45,000 h lifespan
• 1,000€/kW electrolyzer cost
• 30€/MWh Electricity
• 20€/ton CO2
Because of the huge influence of the CAPEX on the methane cost, a lower methane selling price can be gained at lower CAPEX, which is obviously achieved in this case scenario. In the final analysis, this scenario can provide a promising opportunity for implementing an environmental-friendly NG production plant if all the previously stated conditions can be achieved. The obtained price of 2.83€/kg becomes interesting as compared to 1.103€/kg in the gas market, since it can be directly used when the production plant is established in a particular region, whereas the current NG spot price still requires transportation and injection services.
An interesting advantage of the methane produced from Power-to-Gas is the CO2 credits that can generate income. For instance, an income of 20€/ton of CO2, instead of a conventional expense, reduces the operating cost of the process as well as the selling price of methane. Consequently, this methane produced by this process becomes economically competitive to conventional NG. The computation reveals that a minimum CO2 credit of 9€/ton of CO2 can provide a methane selling price of 1.089€/kg methane under favorable conditions of lifespan and other OPEX (electricity price), which is lower than the price in the current gas market. In fact, it can be typically perceived that the price of methane will decrease with an increase in CO2 credit. This beneficial impact of CO2 credits would encourage the implementation of Power-to-Gas plants in future as a part of the energy transition and storage strategy.
Power-to-Gas is a technology that serves as a way-out for two main issues. On the one hand, this solution fulfills the cumulative necessity for energy storage related to renewable energy integration in power grid. On the other hand, it can be an effective route for the sequestration and reuse of the captured CO2 in the form of synthetic fuels. The main objective of this study is to demonstrate the capability and the economic feasibility of this technology using molten carbonate electrolysis through process simulation and sensitivity analysis.
A large-scale process composed of the built-in MCEC model and the BOP equipment is proposed and simulated with AspenPLUS software. The simulation covers both the electrolysis and the methane synthesis processes, starting from raw material preparation to the production of the syngas, which undergoes further purification and compression to reach the feed specification of the methanation process ending within the production of the synthetic methane product. In this proposed process, the steam required for electrolysis is generated using the internal heat of the system without the need for any external energy for heating. The elimination of the external energy supply for heating shows an improvement in the overall performance of the system with an efficiency of 72 %.
Following this simulation, an economic study is carried out to comprehend the feasibility of such a process and identify the cost-driver parameter of the production cost of methane. Regarding the current status, this process cannot handle the economic competition against conventional methane synthesis processes. According to the sensitivity study performed, it was found that the lifespan and cost of the electrolyzer are the main contributors to the production cost of methane, while the utility expenses (electricity and CO2) show a negligible impact on methane cost. Finally, a proposed scenario, that has been economically studied, revealed a reduction of 78% in the production cost of methane. This scenario involves a less expensive electrolyzer with an improved lifetime and low operating expense.
In conclusion, this process technology can be an attractive way to store energy and reuse CO2, if more effort and improvements are performed on the technical and economic aspects of the cell. From a technical viewpoint, improving the operation conditions of a molten carbonate electrolyzer is recommended to promote CO production through CO2 electrolysis, while avoiding the consumption of the produced H2 via the reverse water gas shift reaction. In this manner, vast amounts of methane are produced with the same power input, leading to an increment in the overall efficiency. Also, this process may be economically competitive with other technologies, if the lifetime of the cell is improved and the cost is reduced, in addition to a further increase in the carbon tax imposed on CO2 emissions.
The original contributions presented in the study are included in the article/supplementary material; further inquiries can be directed to the corresponding author/s.
DM carried out the modeling and simulation, and the analysis under the support and supervision of RR-T and CB. All authors reviewed the results and approved the final version of the manuscript.
This study was supported by the French National Research Agency (ANR) with the MCEC project of the reference ANR-17-CE05-0025.
The authors declare that the research was conducted in the absence of any commercial or financial relationships that could be construed as a potential conflict of interest.
We would like to acknowledge Chimie ParisTech for their collaboration and support in the experimental research.
Bove, D., Audasso, E., Barckholtz, T., Kiss, G., Rosen, J., and Bosio, B. (2020). Process analysis of molten carbonate fuel cells in carbon capture applications. Int. J. Hydrogen Energy 46, 15032–15045. doi: 10.1016/j.ijhydene.2020.08.020
Brien, J. E. O., Herring, J. S., Stoots, C. M., McKellar, M. G., Harvego, E. A., Condie, K. G., et al. (2009). “Status of the INL high- temperature electrolysis research program–experimental and modeling,” in 4th Information Exchange Meeting on the Nuclear Production of Hydrogen (Idaho), 1–13.
Chery, D., Lair, V., and Cassir, M. (2015a). Overview on CO2 valorization: challenge of molten carbonates. Front. Energy Res. 3:43. doi: 10.3389/fenrg.2015.00043
Chery, D., Liar, V., and Cassir, M. (2015b). 2015 Chery CO2 Electrochemical Reduction Into CO of C in MC Thermodynamics. Amsterdam: Elsevier Ltd. doi: 10.1016/j.electacta.2015.01.216
Dadhich, P., Dooley, J., Fujii, Y., Hohmeyer, O., and Riahi, K. (2005). Cost and Economic Potential. IPCC Special Report on Carbon Dioxide Capture and Storage. New York, NY: Cambridge University Press, 341–362.
Donitz, W., and Erdle, E. (1985). High-temperature electrolysis of water vapor-status of development and perspectives for application. Int. J. Hydrogen Energy 10, 291–295. doi: 10.1016/0360-3199(85)90181-8
Er-rbib, H., Kezibri, N., and Bouallou, C. (2018). Performance assessment of a power-to-gas process based on reversible solid oxide cell. Front. Chem. Sci. Eng. 12, 697–707. doi: 10.1007/s11705-018-1774-z
European Commission (2017). Final Report: Study on the Implementation of Article 7(3) of the “Directive on the Deployment of Alternative Fuels Infrastructure”–Fuel Price Comparison, Vol. 7. Brussels: European Commission.
Fu, Q., Mabilat, C., Zahid, M., Brisse, A., and Gautier, L. (2010). Syngas production via high-temperature steam/CO2 co-electrolysis: an economic assessment. Energy Environ. Sci. 3, 1382–1397. doi: 10.1039/c0ee00092b
Fuel Cell Energy Inc. (2005). Molten Carbonate Fuel Cell–Product Design Improvement. Danbury, CT: Fuel Cell Energy Inc.
Hawkes, G. L., O'Brien, J. E., Stoots, C. M., Herring, J. S., and Shahnam, M. (2007). Computational fluid dynamics model of a planar solid-oxide electrolysis cell for hydrogen production from nuclear energy. Nucl. Technol. 158, 132–144. doi: 10.13182/NT07-A3831
Hu, L., Rexed, I., Lindbergh, G., and Lagergren, C. (2014). Electrochemical performance of reversible molten carbonate fuel cells. Int. J. Hydrogen Energy 39, 12323–12329. doi: 10.1016/j.ijhydene.2014.02.144
Kaplan, V., Wachtel, E., Gartsman, K., Feldman, Y., and Lubomirsky, I. (2010). Conversion of CO2 to CO by electrolysis of molten lithium carbonate. J. Electrochem. Soc. 157:B552. doi: 10.1149/1.3308596
Kaplan, V., Wachtel, E., and Lubomirsky, I. (2012). Titanium carbide coating of titanium by cathodic deposition from a carbonate melt. J. Electrochem. Soc. 159, E159–E161. doi: 10.1149/2.016211jes
Klimenko, V. V., Klimenko, A. V., and Tereshin, A. G. (2019). From Rio to Paris via Kyoto: how the efforts to protect the global climate affect the world energy development. Therm. Eng. 66, 769–778. doi: 10.1134/S0040601519110028
Lacis, A. A., Schmidt, G. A., Rind, D., and Ruedy, R. A. (2010). Atmospheric CO2: principal control knob governing earth's temperature. Science 330, 356–359. doi: 10.1126/science.1190653
Laoun, B. (2007). Thermodynamics aspect of high pressure hydrogen production by water electrolysis. Rev. Energ. Renouv. 10, 435–444.
MARCOGAZ (2006). Injection of Gases From Non-Conventional Sources Into Gas Networks. Final Recommendation. WG-Biogas-06-18. D497. Brussels: MARCOGAZ.
Meskine, H., Gu, E., Cassir, M., Albin, V., Mel, A., and Lair, V. (2020). CO2 electrolysis in a reversible molten carbonate fuel cell: online chromatographic detection of CO. Int. J. Hydrogen Energy 46, 14913–14921. doi: 10.1016/j.ijhydene.2020.08.028
Mottaghizadeh, P., Santhanam, S., Heddrich, M. P., Friedrich, K. A., and Rinaldi, F. (2017). Process modeling of a reversible solid oxide cell (r-SOC) energy storage system utilizing commercially available SOC reactor. Energy Convers. Manage. 142, 477–493. doi: 10.1016/j.enconman.2017.03.010
Ni, M. (2012a). 2D thermal modeling of a solid oxide electrolyzer cell (SOEC) for syngas production by H2O/CO2 co-electrolysis. Int. J. Hydrogen Energy 37, 6389–6399. doi: 10.1016/j.ijhydene.2012.01.072
Ni, M. (2012b). An electrochemical model for syngas production by co-electrolysis of H2O and CO2. J. Power Sources 202, 209–216. doi: 10.1016/j.jpowsour.2011.11.080
O'Brien, J. E., McKellar, M. G., Harvego, E. A., and Stoots, C. M. (2010). High-temperature electrolysis for large-scale hydrogen and syngas production from nuclear energy–summary of system simulation and economic analyses. Int. J. Hydrogen Energy 35, 4808–4819. doi: 10.1016/j.ijhydene.2009.09.009
Pandiyan, A., Uthayakumar, A., Subrayan, R., Cha, S. W., and Krishna Moorthy, S. B. (2019). Review of solid oxide electrolysis cells: a clean energy strategy for hydrogen generation. Nanomater. Energy 8, 2–22. doi: 10.1680/jnaen.18.00009
Peelen, W. H., Hemmes, K., and De Wit, J. H. (1997). CO2 reduction in molten 62/38 mole% Li/K carbonate mixture. Electrochim. Acta 43, 763–769. doi: 10.1016/S0013-4686(97)00141-2
Pérez-Trujillo, J. P., Elizalde-Blancas, F., McPhail, S. J., Della Pietra, M., and Bosio, B. (2020). Preliminary theoretical and experimental analysis of a molten carbonate fuel cell operating in reversible mode. Appl. Energy 263:114630. doi: 10.1016/j.apenergy.2020.114630
Petipas, F., Brisse, A., and Bouallou, C. (2013). Model-based behaviour of a high temperature electrolyser system operated at various loads. J. Power Sources 239, 584–595. doi: 10.1016/j.jpowsour.2013.03.027
Properties, P., Properties, C., and Division, G. (1990). Safety advice. Elderly Care 2:22. doi: 10.7748/eldc.2.2.22.s22
Rashid, M. M., Mesfer, M. K. A., Naseem, H., and Danish, M. (2015). Hydrogen production by water electrolysis: a review of alkaline water electrolysis, PEM water electrolysis and high temperature water electrolysis. Int. J. Eng. Adv. Technol. 4, 2249–8958.
Redissi, Y., and Bouallou, C. (2013). Valorization of carbon dioxide by co-electrolysis of CO2/H2O at high temperature for syngas production. Energy Proc. 37, 6667–6678. doi: 10.1016/j.egypro.2013.06.599
Remick, R., and Wheeler, D. (2010). Molten Carbonate and Phosphoric Acid Stationary Fuel Cells: Overview and Gap Analysis. Colorado: NREL.
Rivera-Tinoco, R., Farran, M., Bouallou, C., Auprêtre, F., Valentin, S., Millet, P., et al. (2016). Investigation of power-to-methanol processes coupling electrolytic hydrogen production and catalytic CO2 reduction. Int. J. Hydrogen Energy 41, 4546–4559. doi: 10.1016/j.ijhydene.2016.01.059
Seemann, M., and Thunman, H. (2019). “Methane synthesis,” in Substitute Natural Gas from Waste: Technical Assessment and Industrial Applications of Biochemical and Thermochemical Processes, eds M. Materazzi and P. U. Foscolo (London: Elsevier), 221–243. doi: 10.1016/B978-0-12-815554-7.00009-X
Stoots, C. M., O'brien, J. E., Herring, J. S., Lessing, P. A., Hawkes, G. L., and Hartvigsen, J. J. (2008). High Temperature Electrolysis for Syngas Production. U.S. Pat. Appl. Publ. (US20080023338A1), 12 pp.
Taylor, P., Ebbesen, S. D., Graves, C., and Mogensen, M. (2009). Production of Synthetic Fuels by Co-electrolysis of Steam and Carbon Dioxide. London: Taylor & Francis.
Udagawa, J., Aguiar, P., and Brandon, N. P. (2007). Hydrogen production through steam electrolysis: model-based steady state performance of a cathode-supported intermediate temperature solid oxide electrolysis cell. J. Power Sources 166, 127–136. doi: 10.1016/j.jpowsour.2006.12.081
Vlap, H., Mellema, R., Verhaegh, N., Aalfs, D., Zeijlmaker, R., van Halen, B., et al. (2019). METHANATION–Technical Fundamentals and Market. DNV GL.
Wang, L., Rao, M., Diethelm, S., Lin, T. E., Zhang, H., Hagen, A., et al. (2019). Power-to-methane via co-electrolysis of H2O and CO2: the effects of pressurized operation and internal methanation. Appl. Energy 250, 1432–1445. doi: 10.1016/j.apenergy.2019.05.098
Watanabe, T. (2016). Molten Carbonate Fuel Cells, Vol. 4. New York, NY: Springer. doi: 10.1007/978-3-319-14409-2_45
Wendel, C. H., Kazempoor, P., and Braun, R. J. (2016). A thermodynamic approach for selecting operating conditions in the design of reversible solid oxide cell energy systems. J. Power Sources 301, 93–104. doi: 10.1016/j.jpowsour.2015.09.093
Abbreviations
CO2 Carbon Dioxide
Carbonate ion
H2, O2, N2 Hydrogen, Oxygen, Nitrogen
H2O Water
ASR Area Specific Resistance
BOP Balance of Plant
CAPEX CAptital EXpenses
CO Carbon Monoxide
Li/K Lithium Potassium Electrolyte Mixture
MCEC Molten Carbonate Electrolysis Cell
MCFC Molten Carbonate Fuel Cell
Ni Nickel
Ni/YSZ Nickel-Yttria-Stabilized Zirconia
NiO Nickel Oxide
OPEX OPerating EXpenses
ReSOC Reversible Solid Oxide Cell
RWGS Reverse Water Gas Shift
SOEC Solid Oxide Electrolysis Cell
WGS Water Gas Shift
Variables
ṁCH4,prod Mass flowrate of the methane produced by the process, kg/h
Ẇel,BOP Power consumed in the Balance of Plant equipments, kW
Ẇel,MCEC Power in the MCEC stack, kW
ηMCEC Energy efficiency of the full-based MCEC process, %
LHV Lower Heating Value, MJ/kg
Keywords: Molten Carbonate Electrolysis Cell, CO2, power-to-gas, methane synthesis, economic assessment
Citation: Monzer D, Rivera-Tinoco R and Bouallou C (2021) Investigation of the Techno-Economical Feasibility of the Power-to-Methane Process Based on Molten Carbonate Electrolyzer. Front. Energy Res. 9:650303. doi: 10.3389/fenrg.2021.650303
Received: 06 January 2021; Accepted: 14 April 2021;
Published: 20 May 2021.
Edited by:
Timothy A. Barckholtz, ExxonMobil, United StatesReviewed by:
Ligang Wang, North China Electric Power University, ChinaCopyright © 2021 Monzer, Rivera-Tinoco and Bouallou. This is an open-access article distributed under the terms of the Creative Commons Attribution License (CC BY). The use, distribution or reproduction in other forums is permitted, provided the original author(s) and the copyright owner(s) are credited and that the original publication in this journal is cited, in accordance with accepted academic practice. No use, distribution or reproduction is permitted which does not comply with these terms.
*Correspondence: Chakib Bouallou, Y2hha2liLmJvdWFsbG91QG1pbmVzLXBhcmlzdGVjaC5mcg==
Disclaimer: All claims expressed in this article are solely those of the authors and do not necessarily represent those of their affiliated organizations, or those of the publisher, the editors and the reviewers. Any product that may be evaluated in this article or claim that may be made by its manufacturer is not guaranteed or endorsed by the publisher.
Research integrity at Frontiers
Learn more about the work of our research integrity team to safeguard the quality of each article we publish.