
94% of researchers rate our articles as excellent or good
Learn more about the work of our research integrity team to safeguard the quality of each article we publish.
Find out more
ORIGINAL RESEARCH article
Front. Energy Res. , 30 March 2021
Sec. Bioenergy and Biofuels
Volume 9 - 2021 | https://doi.org/10.3389/fenrg.2021.643371
This article is part of the Research Topic Torrefaction Pretreatment for Biomass Upgrading: Fundamentals and Technologies View all 7 articles
 Zhuo Xu1
 Shreyas S. Kolapkar1
 Stas Zinchik1
 Ezra Bar-Ziv1
 Lucky Ewurum2
 Armando G. McDonald2
 Jordan Klinger3*
 Eric Fillerup3
 Kastli Schaller3
 Corey Pilgrim4
The amount of waste generation has been increasing with a significant amount being landfilled. These non-recyclable wastes contain large number of fiber and plastic wastes which can be treated with thermal processes to turn them into energy sources since they have high calorific values, are abundant and usually tipping fees are paid to handle them. This paper studied the torrefaction of non-recyclable paper (fiber) wastes, mixed plastic wastes (MPW) and their blends at different ratios in the temperature range of 250–400°C through thermogravimetric analysis (TGA). The solid residues after the experiments were analyzed by nuclear magnetic resonance (NMR) spectroscopy. Significant synergy between fiber and MPW were observed at the range 250–300°C, showing both increase in the reaction rate as well as the overall mass loss. At 250°C, the maximum mass loss rate was more than two times higher and the mass loss at the end of the experiments were also much higher compared to the expected results. In addition, synergy was weakened with an increase of temperature, disappearing at 400°C. The existence of such interactions between fiber and plastic wastes indicates that the natural energy barriers during the individual torrefaction in paper waste or plastic waste could be bypassed, and the torrefaction of fiber and plastic blend can be achieved at lower temperatures and/or shorter residence times. The MPW and fiber wastes were also compounded by extrusion (to produce pellets) at 220°C with different blend ratios. The fiber-MPW pellets from extrusion were characterized by IR spectroscopy, rheology, thermal analysis and flexural properties and showed significant chemical changes from the non-extruded blends at the same ratios. From IR characterization, it was found that there was significant increase in hydroxyl (OH) group on account of the carbonyl (C = O) and etheric (C-O-C) groups. The interaction between paper and MPW can be attributed to the plastic polymers acting as a hydrogen donor during the reactive extrusion process. Synergistic effects were also found from mechanical and rheological properties.
The amount of waste generated across the world has been increasing, among which the paper and mixed plastic wastes (MPW) are the major contributors to this growth (paper waste and MPW are part of organic waste, which has other components). For instance, the United States alone produced 67 million tons of paper waste and 35.4 tons of MPW in 2017, with 18.4 million tons of paper wastes and 26.8 tons of MPW being sent landfilled (Enviromental Protection Agency, 2017). Landfilling these wastes is not only an insufficient way of utilizing resources, but it also produces greenhouse gases along with other hazardous materials during the decomposition process (Papadopoulou et al., 2007). Since these wastes are abundant and usually have negative cost due to the tipping fees, a potential alternative is treating these wastes through torrefaction and turn them into an energy source.
Torrefaction has been proposed as a process for thermal chemical conversion of various feedstocks to increase the heating value and make the material more friable (Chen and Kuo, 2011; Chen et al., 2015; Chen et al., 2019; He et al., 2018; He et al., 2019; Xu et al., 2018). The synergies between biomass and plastics during thermochemical conversion have also been well explored in the past decades (Chattopadhyay et al., 2008; Han et al., 2014; Olajire et al., 2014; Zhang et al., 2016; Burra and Gupta, 2018; Chen et al., 2020). Sharypov et al. studied the effects of co-pyrolyzing polypropylene (PP) and hydrolytic lignin at 400°C (Sharypov et al., 2003). It was found that with 30 wt% of lignin added to the PP sample, the light product yields reached three times compared to the results from only PP. The addition of the lignin also increased the olefin content in the heavy liquid products. However, since the study was limited to the interactions between lignin and PP, the results of treating both paper wastes and MPW are still lacking. Oyedun et al. conducted research on pyrolyzing biomass (bamboo) and polystyrene (PS) with different blend ratios (Oyedun et al., 2014). Synergistic effects were observed, and a mathematical model was developed to explain the data. The results showed that this synergy could reduce the overall energy usage by 6.2% with 25% of PS. The study also indicated that the synergy can be mainly attributed to the interaction between the lignin and plastic.
Zhou et al. studied the behaviors of co-pyrolysis of biomass (Chinese pine wood dust) and plastic (high density polyethylene (HDPE), low density polyethylene (LDPE) and PP with TGA from room temperature up to 650°C (Zhou et al., 2006). Significant synergies between biomass and plastics were found at high temperature region (530–650°C). Furthermore, synergistic effects observed between the biomass with both HDPE and PP are higher compared to biomass with LDPE. The above two studies provided more details regarding the reduction of activation energy enabled by the interactions between biomass and mixed plastics.
Xue and Bai studied the synergistic effects through co-pyrolyzing polyethylene (PE) with acid pretreated corn stover (Xue and Bai, 2018). It was seen that the synergy was greatly enhanced compared to the results obtained by co-pyrolyzing raw corn stove and PE, which increased the oil yield with higher carbon content and lower oxygen content. A more recent study by Salvilla et al. investigated the synergistic co-pyrolysis of biomass (corn stover and wood waste) with pulverized plastics including PP, LDPE and HDPE using TGA (Salvilla et al., 2020). This synergy was observed at ∼500°C, and it was attributed to the hydrogen that was donated from the plastics during the co-pyrolysis. It was also observed that the activation energy of plastic decomposition was reduced. These studies were carried out at pyrolysis temperatures where the main product is liquid.
In this study, the focus was on lower temperature treatment, carried out at 250–400°C, referred to as torrefaction, with solid as the main product. Further, previous studies used various types of biomass, cellulose, hemicellulose, and lignin, while paper wastes consist of cellulose, hemicellulose, lignin, and various chemical additives (Hubbe et al., 2007). They differ significantly from natural biomass and its constituents including the additives (Farhat et al., 2017). The high temperature pyrolysis results are not applicable to the low temperature torrefaction of paper-MPW to produce solid fuels.
Therefore, it is essential to learn if similar interactions exist between paper and MPW, which is the objective of this study. Synergistic effects between the non-recyclable MPW and paper wastes during torrefaction were observed in a previous study (Zinchik et al., 2020), showing significant synergistic effect between fiber and MPW at 300°C with fiber-MPW (60–40%). The current study expands to other blends and temperatures in the range of 250–400°C. Further, the effects of compound extrusion process were also investigated through studying the rheological and mechanical properties of the composites. This approach can help in designing mixed paper-MPW torrefaction processes for the industrial systems.
The materials in this study were waste industrial paper wastes, MPW and commercially available LDPE (Rainier Plastics), cellulose powder (Avicel PH-101, ∼50 µm particle size, Fluka) as well as hemicellulose (extracted xylan). The paper wastes and MPW have been described in detail in the prior studies (Xu et al., 2018; Xu et al., 2020). The paper wastes are a mixture of paper, carton and cardboard, label matrix residuals, wax papers, and laminated non-recyclable papers; and the plastic wastes consist of LDPE, PE, polyethylene-terephthalate (PET), polyamide-nylon, polyvinylchloride (PVC), PP, and some other materials. These wastes were received and had been through a primary size reduction to a coarse size of < 100 mm. They were then passed through a low RPM, high-torque twin-shaft shredder (Taskmaster TM8500). The rotor blades were approximately 6 mm thick, and size reduced the material to fiber bundles approximately 6 mm x 12–25 mm. A final size reduction step was performed in a knife mill (Model 4 Wiley Mill, 800 RPM) and the material to pass through a 2 mm screen. This size enables homogenization of the sample, and therefore it is good representation of the heterogeneous feedstock.
Compositional analysis for structural and extractive carbohydrates and lignin was performed following the Laboratory Analytical Procedures developed at National Renewable Energy Laboratory (NREL) (Sluiter and Sluiter, 2011). The solids are initially prepared between 20 and 80 mesh followed by water and ethanol-based solvent extractions to determine non-structural carbohydrates, proteins, waxes, and resins, etc. The extracted material then goes to a two-stage sulfuric acid hydrolysis and insoluble Klason lignin determined gravimetrically and the acid-insoluble lignin content determined by UV spectroscopy at 240 nm (extinction coefficient of 12 L g−1 cm−1). The sugars were analyzed via high-performance liquid chromatography (HPLC).
Ultimate analysis was performed using a LECO TruSpec C/H/N and S add-on module, with a modified ASTM D5373–16 method to accommodate fiber wastes samples that use a slightly different burn profile of 4 slm for 40°s, 1 slm for 30°s, and 4 slm for 30°s of ultra-high purity O2. ASTM D4239–17 was used to determine elemental sulfur content, and oxygen content was calculated by subtraction (Dupuis et al., 2019).
Thermal conductivity was measured in a transient plane source (ThermTest Inc. TPS15000 hot disc thermal constants analyzer) (Williams et al., 2017). The samples are housed in a heated oven (LF2 SP 3kW, Vecstar) during the tests. Power to the sensor was provided by a TSX3510P Aim TTi power supply. Gold tipped leads connected the power supply, thermal sensor (Mica 4,921, radius of 9.719 mm, Themtest), thermistor, and reference resistor to two multimeters (0.002% accuracy to 100 nV, up to 2000 Hz, Keithley). Outputs from the power supply and the multimeters were fed into a custom build Virtual Instrument (VI) constructed in Labview (National Instruments). During the tests, a current is sent through the resistive element sensor to generate heat. The thermal diffusivity of the sample is used as a fitting parameter to match the measured and theoretical change is resistance within the sensor as the interface temperature changes. The transient resistance of the sensor was determined by recording the voltage potential across the sensor and that of a 10.05 Ohm reference resistor. The temperature rise at the sensor-solid interface was targeted at approximately 1.0°C to ensure good experimental resolution, in addition to maintaining an assumed semi-infinite medium and quiescent atmosphere in the sample chamber. For these tests, the pulse sequence was performed at 0.09 V for 100 s, then 1.0 V for 160 s, then 0.11 V for 100 s.
The MPW crumb and MPW/fiber crumb material (50/50 and 75/25) were blended in 0.5 kg batches using a Kitchen Aid mixer. The blended formulations (0.5 kg each) were each fed into the 18-mm co-rotating twin-screw extruder (Leistritz, L/D ratio of 40, 200 rpm, 4.7 kW motor, base torque 18%) using a mass loss twin screw feeder (K-Tron) at 0.5 kg/h. The extruded material exited from a 9 mm diameter die as rods and were cooled by forced air (Adefisan et al., 2017). The eight heated extruder barrel zones were maintained at 220°C.
The softening point of the various extruded material formulations and LDPE was determined by thermomechanical analysis (TMA) on a Perkin Elmer TMA-7 instrument on thin sections (3 mm × 3 mm × 0.5 mm) from −25°C–250°C at 5°C/min using a penetration probe. The melting temperature and degree of crystallization on the extruded MPW (10 mg) was performed by differential scanning calorimetry (DSC) on a Perkin Elmer DSC-7 instrument from 25 – 300°C at 10°C/min.
The thermogravimetric analysis was performed in a LECO TGA 701. This unit has a 19-sample (approximately 1 g) carrousel that is fully enclosed in a nitrogen-purged (10 slm) oven. For these tests, all 19 crucibles were loaded with either the wastepaper, commercial cellulose powder, and MPW for replication and the statistical significance of the extracted results. The samples were first heated at 110°C to eliminate moisture and then the temperature increased to the set temperature with the rate of 16°C/min. Over the experiment, the carousel rotated, and samples were weighted approximately every 15 s between the crucibles with full revolutions taking 5 min each. After the transient data were retrieved, the 19 sample traces were composited to obtain a TGA curve that is representative of the 0.07 Hz mass recording as well as the variability of the material and the technique. Mass was recorded to 0.0001 g (0.01–0.05% of initial mass) by the thermally isolated, low-drift balance.
Fourier-Transform Infrared Spectroscopy (FTIR) spectra were obtained using a Nicolet-iS5 FTIR spectrometer, 64 scans, with an attenuated total reflectance accessory (ZnSe crystal, iD5) and data analyzed and averaged with the OMNIC v9.8 software.
Solid samples were mixed with 10% adamantane (by mass) to use as an internal standard to provide a basis to compare the different samples semi-quantitatively, as the densities of carbon species differed greatly as the torrefaction temperature was changed. The paper/adamantane mixtures were ground to a uniform particle size with a mortar and pestle and were then loaded into 4 mm ZrO rotors and capped with Kel-F rotor caps. The spectra were obtained using a standard Bruker HX magic-angle spinning (MAS) probe as part of a Bruker Avance III spectrometer with a field strength of 9.4 T (1H ν = 400.03 MHz, 13C ν = 100.59 MHz). The torrefied paper samples were spun at νR = 15 kHz. The standard cross-polarization (CP) experiment was used for these experiments (Pines et al., 1972; Schaefer et al., 1975). 1H NMR spectra were recorded for each sample to determine the center of the excitation profile for the CP experiment. CP/MAS conditions were first optimized on the 325°C torrefied paper sample and used for the remaining samples. Proton nutation frequency was set at 92.6 kHz with a decoupling field strength of 48.0 kHz (under the SPINAL64 decoupling program) (Fung et al., 2000). The Hartman-Hahn condition (contact time) was optimized at 1.8 msec For the CP/MAS experiments the relaxation delay was set to 4 s, the sweep width was set to 745 ppm, and the total number of transients per experiment was 3,072. Also, the time domain of the free-induction decay (FID) consisted of 4,004 points but due to that the quick relaxation of the FID the processed spectra was cut-off after 900 points, to reduce the amount of noise.
When processing the NMR data, care was taken to normalize the peak heights within the individual spectra to the adamantane peak at 36.4 ppm and to the mass percentage of the sample. Spectra were then further normalized on a mass basis using mass loss values from TGA. Spectral deconvolutions of the 0–50 ppm region were run using MestReNova™ (Mestrelab Research) to provide the isolated peak heights for normalization.
Dynamic rheological measurements (complex viscosity, η*) were carried out on a Bohlin CVO 100 rheometer, using serrated parallel plates (25 mm Ø), in an oscillating mode with an extended temperature control module on compression molded discs (2.5 mm × 25 mm Ø) of extruded materials, LDPE, and MPW crumb samples at 180°C (0.01–100 Hz at an applied strain of 0.25%). Data were analyzed using the Bohlin rheology v6.51 software.
The extruded rod samples, MPW crumb and LDPE (13 g) were hot-pressed (PHI hydraulic press, 300 × 300 mm2) at 180°C in a 75 mm Ø pellet die over 20 min and then cooled to room temperature. The flattened material was cut into flexural specimens (3 mm × 14 mm strips). Three-point flexural tests (strength and modulus) were performed on an Instron 5500R-1132 universal test machine (5 kN load cell) on specimens (≥ 6 replicates) according to ASTM Standard D 790 with a crosshead speed of 1.31 mm/min, span of 48 mm, and tested until specimen failure or 5% strain, whichever occurred first. Data were collected and processed using Bluehill v3.2 software (Instron).
The major constituents of paper waste were determined by compositional analysis. The results were obtained on a normalized and ash-free basis the carbohydrates and lignin, where balance was made of other unidentified material and other minor sugars. The paper wastes consist of 65.5% cellulose (glucan), 18.0% hemicellulose (xylan (13.8%), mannan (3.6%) and arabinan (0.6%) and 14.3% lignin, and was similar to other reported values (Curling et al., 2001; Moreira and Filho, 2008).
Ultimate and compositional analyses were performed to help determine the elemental distribution and chemical changes the paper and MPW experienced through torrefaction. The inorganic content (measured as ash after combustion) was found to be 10.59 wt% and 6.51 wt% for paper and MPW, respectively. Along with these values, the initial volatile matter and fixed carbon for paper waste were 77.5 wt% and 11.9 wt%, respectively; for MPW the volatile matter and fixed carbon were 90.6 wt% and 2.9 wt%, respectively. Ash-free elemental analysis of the major constituents of paper and MPW are shown in Table 1. Results are given in wt% with mol% in parenthesis. As is shown in the table, paper wastes contain much higher oxygen compared to MPW, and the hydrogen content in MPW is significantly higher than in paper waste.

TABLE 1. Ash-free elemental analysis of the major constituents of paper and plastic waste. Results are given in wt% with mol% in parenthesis.
Biot Number (Bi) and Thermal Thiele Modulus (M) were calculated to determine the heat transfer regime of the experimental setup as follows:
It is essential to determine the thermal conductivity of the paper waste since it contains both paper waste and cardboard. The parameters used to calculate Bi and M are summarized in Supplementary Table S1
To calculate M, the reaction rate with a function of temperature has to be known. In this study, the measured reaction rate is shown in Figure 1, showing the mass loss rate vs. time at various temperatures. The maximum mass loss rate is approximately at the same time, however, the width in the mass loss rate is wider as the temperature decreases. Also, note that the thermal conductivity of the paper waste was measured at 25°C with pressure of 1 atm. According to Lavrykov and Ramarao, the thermal conductivity of paper would increase as temperature increase (Lavrykov and Ramarao, 2012). Therefore, Bi was calculated with the smallest thermal conductivity and the maximum mass loss rate was selected for the calculation of M, as these would provide the worst-case scenario. Any larger thermal conductivity and smaller reaction rate would yield lower Bi and M values, respectively. To convert mass loss rate from units of s−1 to kg/m3-s, it was multiplied by its density as measured in this study (Refer to Supplementary Table S1).
With the parameter above, the Bi and M at different temperatures can be calculated and the results given in Table 2.
Since Bi equals 0.04, which is much smaller than 1, it indicates that the samples are thermally thin. Therefore, the heat convection from the oven to the sample surface is much slower than the heat conduction into the sample; for M << 1, it indicates that the heat conduction into the sample is much faster than the reaction rate. Thus, the particle temperature throughout was uniform and equals to the gas temperature (which is measured), and the reaction rate was governed by the heat convection from the oven to the surface of the sample (Xu et al., 2018).
To study the torrefaction of the waste blends, it is essential to understand the torrefaction behavior of the paper wastes. Figure 2 depicts the experimental results of paper wastes torrefaction using TGA at 250°C, 300 and 400°C. From Figures 2a1,a2, it was found that the maximum mass loss rate at 250°C was only ∼0.00003 (s−1), the rate dropped to ∼ 0.00001 after ∼10,000 s and remained constant until the 15,000 s, while the mass loss reached ∼21%, with an almost linear increase after ∼1,000 s. Figures 2b1,b2 shows the results of mass loss rate and mass loss of paper waste torrefaction at 300°C. The peak value of mass loss rate reached ∼0.00034 (s−1), which is much higher compared to the maximum rate of 250°C. The mass loss had a two-stage behavior, it reached ∼45% mass loss at ∼2,000 s and after which the reaction rate continues to slow down, and the mass loss reached ∼60% mass loss after 8,000 s. The torrefaction behavior of paper wastes at 400°C was similar to 300°C, while it has higher maximum mass loss rate (∼0.0018 s−1) and the first stage ended at ∼1,000 s, with mass loss of ∼65% mass loss. The mass loss keeps rising with a lower rate and reached ∼90% after 6,000 s. It was observed that the reaction rate depends on both temperature and the constituents of the paper wastes, detailed discussion is provided in the end of this section.
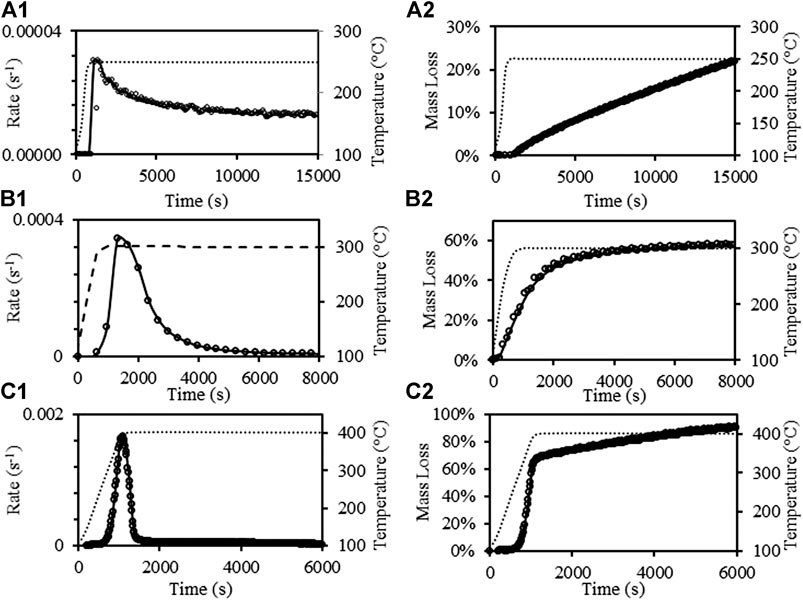
FIGURE 2. Mass loss rate of paper wastes torrefaction at: 250°C (a1), 300°C (b1), 400°C (c1); mass loss of paper torrefaction at: 250°C (a2), 300°C (b2), 400°C (c2).
To further understand the chemical changes occurred during the paper waste torrefaction, NMR spectroscopy was performed on the solid residues after the TGA experiments at various temperatures. In the 13C NMR spectra of the low-temperature torrefaction processes (<275°C), the peaks present between 50 and 100 ppm correspond to the carbons within the cellulosic framework of the material (Figure 3A) (Maunu, 2009). As the torrefaction temperature increased, a steady decline in the cellulose content was observed until it is fully converted at temperatures above 300°C. The broad peak centered at 127 ppm during the same span (Figure 3B), shows very little reduction in intensity at these lower temperatures, though it too disappears by the final torrefaction temperature of this study. This broad peak is largely comprised of lignin signals that lie in the aromatic region of the 13C NMR spectrum (Lauer et al., 1972). The NMR spectral data suggests that cellulosic carbon decomposes more readily at increasing temperatures through carbonization. As indicated in Hu et al. lignin retains its structure at temperatures below 280°C, starts to slowly degrade and increase surface area between 310 and 330°C, and past the critical temperature of 365°C it turns into an aromatic hydrocarbon framework (Hu et al., 2014). The thermal decomposition of a constituent at ∼31 ppm is also observed (Figure 3C) which begins to degrade at 250°C. In biomass, this peak is often associated with the waxy cutin component (Love et al., 1998), however, in this case it is likely waxy aliphatic finish present on components of the wastepaper.
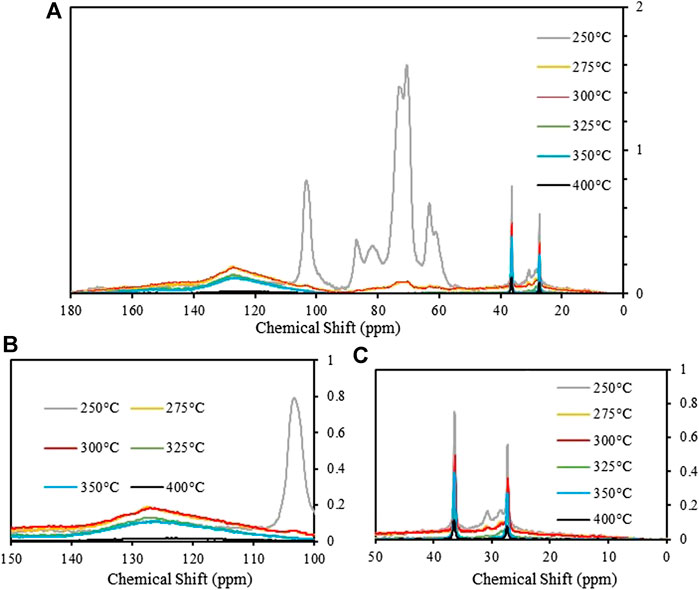
FIGURE 3. (a)13C{1H} CP/MAS NMR spectrum of torrefied paper at temperatures from 200–400°C showing asymmetric degradation of carbon species at increasing temperatures; (b)13C{1H} CP/MAS NMR spectrum of torrefied paper centered around 127 ppm showing degradation of aromatic carbon throughout the temperature regime; (c)13C{1H} CP/MAS NMR spectrum of torrefied paper in the aliphatic region showing thermal decomposition of peak at 31 ppm. The peaks at 36.5 and 27.4 ppm are from the adamantane standard used for peak normalization.
The torrefaction of MPW was also studied as shown in Figure 4. FTIR analysis of 30 random MPW pieces identified the mix to be 39% PE, 27% poly (ethylene-co-vinylacetate) (PEVA), 27% PET, 3% polyamide-nylon, and 3% PP. Our previous study has characterized these MPW, and it was found that these wastes are mainly consist of LDPE, PE, PET, PP, polyamide-nylon, PVC and other materials (Zinchik et al., 2020). From Figures 4a1,a2, it was observed that the maximum mass loss rate at 250°C was ∼0.00002 (s−1) and the rate remained constant until 8,000 s with mass loss reaching ∼14%. This was due mainly to content of PP and nylon which degrade with relatively low rate at this temperature (Peterson et al., 2001; Ito and Nagai, 2010). Figures 4b1,b2 show the results of mass loss rate and mass loss of MPW torrefaction at 300°C. The peak value of mass loss rate reached ∼0.00034 s−1, which was much higher compared to the maximum rate of 250°C. It reached ∼45% mass loss at ∼2,000 s and after which the reaction rate continued to slow down, and the mass loss reached ∼60% after 8,000 s. The MPW torrefaction behavior at 400°C Figures 4c1,c2 were rather different compared to 250 and 300°C. It has a higher maximum mass loss rate (∼0.0016 s−1) and the rate decreased after it reached a peak value. The mass loss keeps rising and reached an asymptotic value of ∼40% after 8,000 s. This behavior was consistent with other literature findings, as LDPE, PE and PP would require higher temperature to degrade (Gao et al., 2003; Aboulkas et al., 2010).
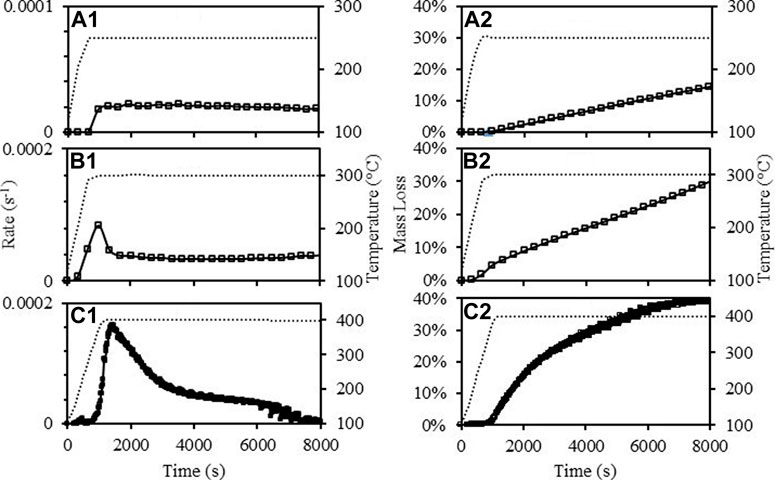
FIGURE 4. Mass loss rate of MPW torrefaction at: 250°C (a1), 300°C (b1), 400°C (c1); mass loss of paper torrefaction at: 250°C (a2), 300°C (b2), 400°C (c2).
In this study we examined both extruded and non-extruded MPW-fiber blends to determine the impact of loose blend mixtures compared to a more uniformly extruded material. Compounding extrusion of the MPW-fiber waste was initially performed at 160°C and showed that the material was not consistent showing unmolten particles (nylon and PET) distributed throughout the extrudate. To alleviate this problem, compounding extrusion was then performed at 220°C and resulted in a homogenized uniform extrudate and this temperature was used for MPW-fiber formulations. Figure 1 (Refer Supplementary Figure S1) shows cross sections of extruded (at 220°C) and non-extruded MPW, indicating the quality and uniformity of the pellets produced by compounded extruded pellets.
The extruded MPW rod was analyzed by differential scanning calorimetry DSC (Figure 5A and 5 melting peaks were observed at 101°C, 117 and 121°C, 175°C, and 252°C and assigned (based on standards) to PEVA, LDPE, HDPE, PP and PET, respectively. This MPW composition is in general agreement with FTIR analysis of 30 random plastic pieces, except for nylon.
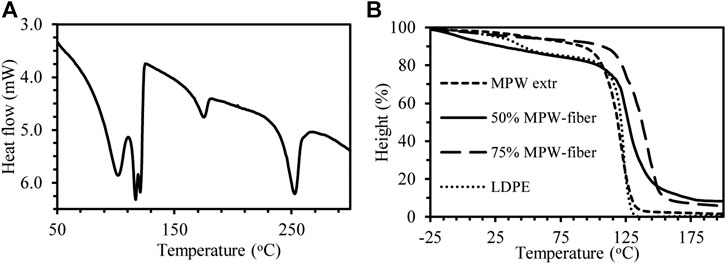
FIGURE 5. (a) DSC thermogram of extruded MPW; (b) TMA thermograms of extruded MPW, extruded MPW-fiber (50/50 and 75/25), and LDPE.
The softening temperature (Ts) of the extruded MPW, MPW-fiber formulations and LDPE were determined by TMA (Figure 5B). Two Ts’s were recorded for LDPE at 33 and 113°C. While the mixed extruded MPW had a Ts of 111°C and the addition of fiber increased this slightly to 116°C (25% fiber) and 118°C (50% fiber). The softening point of the mixture was dominated by PE as the major component of the mix.
TGA experiments were performed at different temperatures with various blend ratios to study the interactions between paper and MPW, and the results are shown below in Figures 6, 7. Similar to Torrefaction of Mixed Plastic Wastes, “_exp” denotes the experimental results and the “_cal” denotes the reconstructed results according to linear mixing rules. The MPW-fiber weight ratio of the blend is also noted in each plot. Figures 6a–c represents the results at 250°C, Figures 7a–c shows the results at 300 and 400°C results are depicted in Figure 7d.
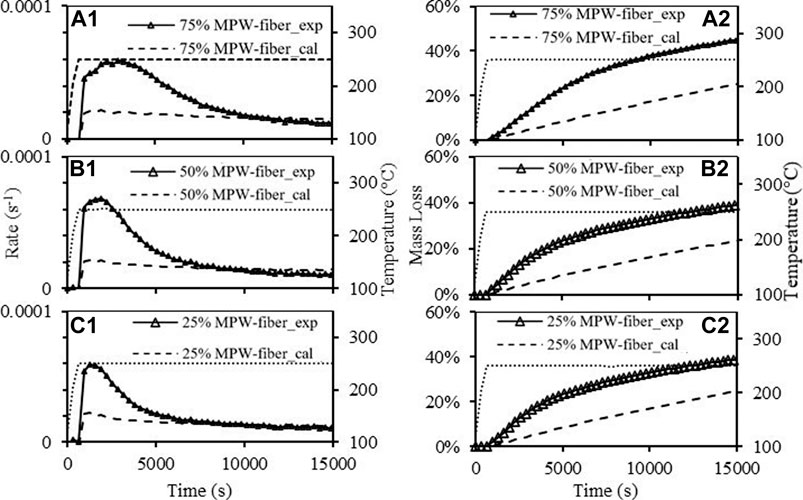
FIGURE 6. Mass loss rate of paper-MPW torrefaction at 250°C with paper-MPW blend ratio of (a1, 3:1), (b1, 1:1), (c1, 1:3); Mass loss of paper-MPW torrefaction at 250°C with paper-MPW ratio of (a2, 3:1), (b2, 1:1), (c2, 1:3).
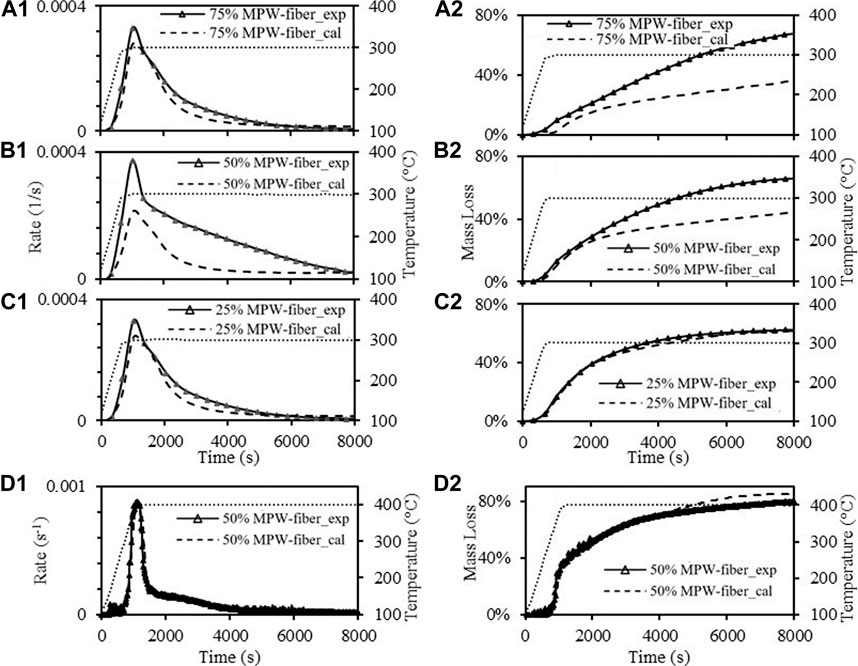
FIGURE 7. Mass loss rate of paper-MPW torrefaction at 300°C with paper-MPW ratio of (a1, 3:1), (b1, 1:1), (c1, 1:3); 400°C with paper-MPW ratio of (d1, 1:1); Mass loss of paper-MPW torrefaction at: 300°C with paper-MPW ratio of (a2, 3:1), (b2, 1:1), (c2, 1:3).
Figures 6a–c show significant synergistic effects between paper and MPW during torrefaction at 250°C. In all three experiments with different ratios, it can be found that the maximum mass loss rate was more than doubled and the mass loss at the end of the experiments were also much higher compared to the expected results. It can also be observed that different blend ratios have impacts on the significance of the synergistic effects. For instance, the mass loss of the paper-MPW ratio 1:3 sample reached ∼43% after 15,000 s Figure 6a2, while the sample of the lowest MPW composition (25%) only reached ∼38% mass loss after the same time Figure 6c2. At 300°C, although the reaction rates are faster and the mass losses are higher than 250°C, the overall synergistic effects were less significant. In addition, the blend ratio has a larger impact on the synergistic effects. For instance, the effects of the synergy on the mass loss rate with paper-MPW ratio of 1:3 and 1:1 are less significant compared to 250°C Figures 7a1,b1, while the final mass loss after 8,000 s were still much higher than expected values. This finding was close to another previous study with paper-MPW ratio of 3:2, which were thermally treated at 300°C (Zinchik et al., 2020). However, with paper-MPW ratio of 3:1 at 300°C, the synergistic effects were almost insignificant. And at higher temperature (400°C) with paper MPW ratio 1:1, there were no synergistic effects observed as shown in Figure 7d.
From the results of Figures 6, 7, it can be concluded that synergistic effects depend inversely on temperature, where the strongest effect is observed at 250°C. Additionally, higher MPW composition leads to more synergistic effects. As seen from Table 1, MPW has significantly higher hydrogen than paper waste, which leads us to hypothesize that MPW is acting as a hydrogen donor during torrefaction. It has been hypothesized by Lin et al. that the radicals derived from paper wastes during the process also intensified the scission of the polymer chain, participated in polymer radical terminations, and inhibited polymer intermolecular hydrogen transfer reactions; which increases the overall reaction rate (Lin et al., 2020). These interactions between material components act to enhance the global degredation rates while the decomposition is relatively slow (low temperatures), but are obscured by the increased rate of the torrefaction chemistries at higher temperatures.
The existence of interactions between fiber and MPW indicates that the natural energy barriers during the individual torrefaction in paper waste or MPW could be bypassed, and the torrefaction of fiber and MPW blend can be achieved at lower temperatures and/or shorter residence times. This is clearly observed from the results of Figures 6, 7, which indicate that there are significant impacts to the degradation trajectory that are not explainable by simple linear component mixing laws. This enhanced degradation offers an opportunity in industrial processing, through bypassing the natural energy barriers during the torrefaction chemistry in waste plastic-paper or waste plastic alone. For example, if torrefaction is sought as a method of creating an enhanced solid fuel or to making biomass fibers more compatible to matrix with plastics in composites, the degradation can be achieved at a much low temperature and/or lower reactor residence time. As discussed above, the content of carbon is significantly enriched in the fiber chars around 40–50% mass loss. At 250°C, this extent of reaction is not realizable even at the extended reaction times in the analytical techniques studied here and the maximum mass loss values based on individual components was not expected to be much higher than 20%. Indeed, for the fiber content these values were not observed until 300°C and residence times approaching 60 min. Through taking advantage of the interactions of the paper and plastic components, similar results are realizable at either lower temperatures (250°C, similar residence time of 60–90 min) or lower residence times (300°C, 30 min). Identifying such interactions could lead to operating reactors at lower temperatures with less energy input or even greater energy export as co-product, less thermal losses, or a lower residence time that could substantially reduce capital investment or increase throughput. Further, operating the thermal reactor at lower temperatures offers less expensive and exotic reactor and materials of construction options. For example, inexpensive silicon-based seals can be continuously exposed to reaction temperatures around 250°C, whereas more expensive and less resilient graphite or vermiculite seals are often used above 280°C. Lower reaction temperatures can also decrease any corrosion effects from formed organic acids, or halogens present in waste plastics (such as chlorine that would evolve as HCl). As another example (and further evidenced by the composite testing that follows), Wang et al. demonstrated how waste fiber degradation between 25–70% mass loss enhanced the ability of fibers to reinforce plastic composites, improve weatherability, and resist microbial action (Wang et al., 2019). Future work will quantify the energy barriers and process kinetics and evaluate these potential economical benefits in schemes for producing a solid fuel as well as biomaterials. As mentioned above, biomass and plastic synergistic effects were observed at high temperature pyrolysis, where liquids are the main products of degradation. From this study, which focuses on low temperature torrefaction with the major product being solid fuel, shown synergistic effects were observed, which differ significantly from the high temperature pyrolysis studies.
To further study the synergistic effect between fiber and plastic polymers, the pellets produced from fiber-MPW by reactive extrusion were characterized by various methods.
Figures 8a,b show an FTIR spectrum of paper-MPW without extrusion and with extrusion at 1:1 ratio. C-H stretching bands were observed in all the samples at 2,916 cm−1 and 2,850 cm−1, which can be attributed to methylene groups (Mayo, 2004). O-H stretching band also exists between 3,100 cm−1 to 3,600 cm−1 in all the samples (Wang et al., 2014). Broad carbonyl (C=O) band at was found in all the samples 1,690–1750 cm−1, which can be attributed to ester in linkage in PET and amide linkage in nylon (Mayo, 2004). Paper was also identified at 1,505 cm−1 with a small band associated with lignin (Dence, 1992). In addition, C–O stretching in wood cellulose and hemicellulose was observed in region between 1,000 and 1,070 cm−1; cis-bands at 727 cm−1 and trans-vinylene bands at 974 cm−1 were found in all the samples as well (Pandey, 1999; Mayo, 2004). We observe slight differences between the non-extruded samples and the extruded ones. Similar results were obtained for other blend ratios as well.
In order to study the chemical changes occurred during the reactive extrusion, the following indices were used: Carbonyl index (CI), cellulose index (CeI), and hydroxyl index (HI). The indices were defined as a ratio of the band intensity at 1720 cm−1, 1,024 cm−1, and 3,342 cm−1, respectively, to the band 2,916 cm−1 for the -CH2- groups (Wei et al., 2013). The relative changes in hydroxyl, carbonyl, and cellulose that occurred during torrefaction were analyzed by calculating CI, CeI, and HI respectively (Zinchik et al., 2020).
To show the changes in CI, CeI, and HI we defined the following relative indices:
These new variables will show the relative change of each of these indices because of the reactive extrusion process. Figure 9 shows these indices for two MPW-fiber (50/50 and 75/25, fiber to MPW ratios); the line at unity depicts no change in the index. The HI increases after extrusion by ∼27% for both blends, whereas, the CI are reduced by 30% and the CeI is reduced by ∼27%. It can be concluded that the increase in HI (the hydroxyl group) was on account of the reduction of the CeI and CI. This is indicative to transfer of hydrogen atoms to the C=O and C-O-C groups and as a consequent the increase of the OH group. It also indicates that the reduction in cellulose content was due to dehydration and degradation reactions (Wang et al., 2014).
Dynamic rheological measurements were also obtained on the extruded materials, compression molded MPW crumb, and LDPE. Figure 10 shows the complex viscosity (η*) of all melt samples to decrease with shear rate at 180°C. This behavior is indicative of shear-thinning of non-Newtonian fluids such as polymer melts (Shenoy, 1999). The η* (at 1 s−1) for LDPE (reference material) was low at 2,760 Pa.s. The compression molded and extruded MPW waste materials respectively, have η* of 8,260 Pa.s and 19,200 Pa.s. By compounding the MPW in an extruder, good dispersion, distribution, and interaction of the various plastics was achieved strengthening the polymer melt resulting in a two-fold higher viscosity. The two plastic mixed samples had a higher viscosity that LDPE alone. The addition of 25 and 50% fiber to MPW increased its η* approximately 2- and 4-fold, respectively. The entangled fibers reinforced the polymer matrix as well as enhanced interactions between the two, thus increased its viscosity (Shenoy, 1999; Wang et al., 2019). This trend is also observed in wood plastic composite systems (Adefisan and McDonald, 2019).
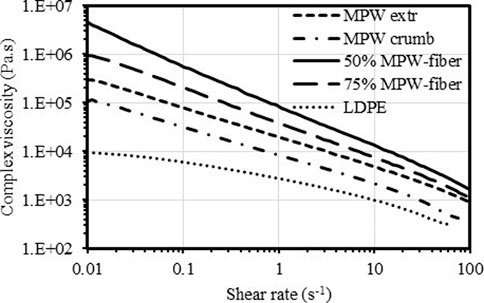
FIGURE 10. Flow curves (complex viscosity vs shear rate) at 180°C of extruded MPW, extruded MPW-fiber (50/50 and 75/25), compression molded MPW crumb and LDPE.
Figure 11 shows the complex viscosity at shear rate of 1 s−1, for of LDPE, MPW crumbs, extruded MPW, extruded MPW-fiber (50/50 and 75/25). It is to be noted that the complex viscosity of MPW crumbs is higher than that of LDPE (a major component in MPW). The important part is that when MPW is extruded, it has complex viscosity seven times higher than that of LDPE and 2.3 times more than non-extruded MPW (MPW crumbs, see Supplementary Figure S1. This is a direct evidence of the synergistic effects within plastic components themselves. When fiber is added to MPW and extruded, the complex viscosity increases significantly over non-extruded and extruded MPW, with strong effect of the fiber content in the blend.
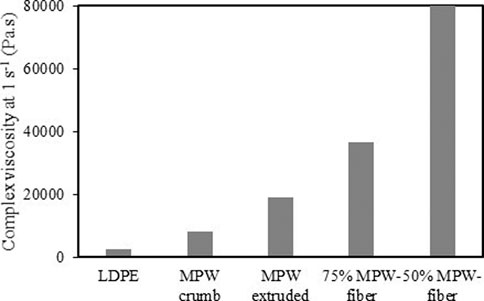
FIGURE 11. Complex viscosity at 1 s−1 shear rate at 180°C of LDPE, MPW crumbs, extruded MPW, extruded MPW-fiber (50/50 and 75/25).
Flexural tests were carried out for extruded MPW, extruded MPW-fiber (50/50 and 75/25), compression molded MPW crumb and LDPE. Figure 12A shows the flexural modulus for the same samples shown in Figure 11. The LDPE and MPW have similar values for the flexural modulus, 213 ± 10 MPa and 195 ± 10 MPa, respectively. When the MPW is extruded, it increases flexural modulus by 40%–278 ± 10 MPa, which is a strong indication of the synergy between the various polymer components in MPW. When fiber is added to MPW and extruded, the flexural modulus increases significantly; the 75%MPW-25%fiber blend shows increase of almost a factor of three and the 50%MPW-50%fiber blend increases further by a factor of six over the non-extruded MPW. The flexural strength shows a similar behavior, though less pronounced, as seen in Figure 12B. This improvement in mechanical properties by addition of fibers is also observed in wood plastic composite systems (Fabiyi and McDonald, 2010; Adefisan and McDonald, 2019; Wang et al., 2019).
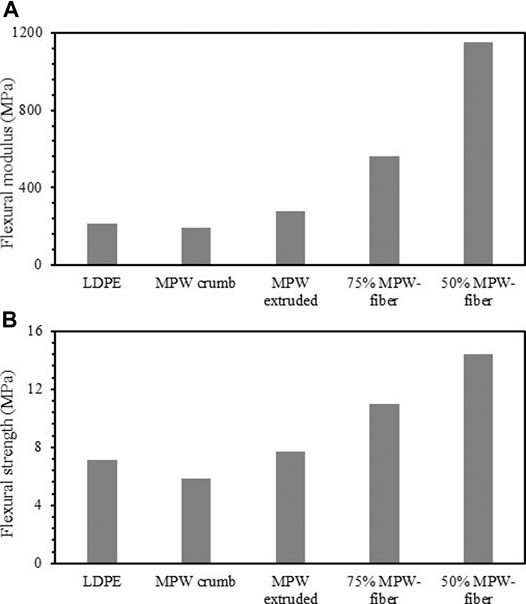
FIGURE 12. (a) Flexural modulus and (b) Flexural strength of LDPE, MPW crumb, extruded MPW, extruded MPW-fiber (50/50 and 75/25).
In this study, the torrefaction of paper wastes, MPW and paper-MPW blends at various temperatures were studied. Synergistic effects were observed between paper plastic wastes during torrefaction. It was also found that at lower temperatures (250°C), the maximum mass loss rate was more than doubled and the mass loss at the end of the experiments were also much higher compared to the expected results. In addition, with higher plastic content, the effects are more significant, both increasing the reaction rate as well as the overall mass loss. However, there is no synergy observed at higher temperature (400°C). The existence of such interactions between fiber and plastic wastes indicates that the natural energy barriers during the individual torrefaction in paper waste or plastic waste could be bypassed, and the torrefaction of fiber and plastic blend can be achieved at lower temperatures and/or shorter residence times. The reactive extrusion at 220°C also showed there exists chemical changes during the process, which reduces the C-O and carbonyl index and increased hydroxyl content. The interaction between paper and plastic wastes during torrefaction can be attributed to the plastic acting as a hydrogen donor during the torrefaction of the paper, and the radicals derived from paper wastes also intensified the scission of the polymer chain, initiating the scission of the polymer chain, which increases the overall reaction rate and mass loss. It was also found that complex viscosity of the extruded MWP-fiber blends is seven times higher than LDPE and 2.3 times more than non-extruded MPW. The results of flexural testing indicated that there exist synergistic effects not only between the MPW and fiber wastes, but also with the MPW. These synergistic effects can greatly help to design the process parameters to valorize mixed paper-plastic wastes.
The original contributions presented in the study are included in the article/Supplementary Material, further inquiries can be directed to the corresponding author.
ZX analyzed the data and wrote the manuscript. SK and SZ helped in data analysis and manuscript review. LE and AM performed the extrusion experiments, analyzed the extruded pellets and contributed to the manuscript in the appropriate sections. EF, KS, and CP characterized the feedstock, carried out the TGA experiments, analyzed the char samples and contributed to the related sections in manuscript writing. EB-Z and JK supervised the entire work, analyzed the data and helped in manuscript writing.
The authors declare that the research was conducted in the absence of any commercial or financial relationships that could be construed as a potential conflict of interest.
We acknowledge the support from 1) Battelle/Idaho National Laboratory (INL) Grant contract number 209856; 2) National Science Foundation grant number 1827364; 3) the M.J. Murdock Charitable Trust for their support in the purchase of the twin-screw extruder; and 4) supported by the United States. Department of Energy (DOE), Office of Energy Efficiency and Renewable Energy (EERE), Bioenergy Technologies Office (BETO), under DOE Idaho Operations Office Contract DE-AC07–05ID14517.
The Supplementary Material for this article can be found online at: https://www.frontiersin.org/articles/10.3389/fenrg.2021.643371/full#supplementary-material.
Aboulkas, A., El harfi, K., and El Bouadili, A. (2010). Thermal degradation behaviors of polyethylene and polypropylene. Part I: Pyrolysis kinetics and mechanisms. Energ. Convers. Manag. 51, 1363–1369. doi:10.1016/j.enconman.2009.12.017
Adefisan, O. O., and McDonald, A. G. (2019). Evaluation of the strength, sorption and thermal properties of bamboo plastic composites. Maderas Cienc. y Tecnol. 21, 3–14. doi:10.4067/S0718-221X2019005000101
Adefisan, O. O., Wei, L., and McDonald, A. G. (2017). Evaluation of plastic composites made with Laccosperma secundiflorum and Eremospatha macrocarpa canes. Maderas. Cienc. y Tecnol. 19, 517–524. doi:10.4067/S0718-221X2017005001101
Burra, K. G., and Gupta, A. K. (2018). Synergistic effects in steam gasification of combined biomass and plastic waste mixtures. Appl. Energ. 211, 230–236. doi:10.1016/j.apenergy.2017.10.130
Chattopadhyay, J., Kim, C., Kim, R., and Pak, D. (2008). Thermogravimetric characteristics and kinetic study of biomass co-pyrolysis with plastics. Korean J. Chem. Eng. 25, 1047–1053. doi:10.1007/s11814-008-0171-6
Chen, R., Zhang, S., Cong, K., Li, Q., and Zhang, Y. (2020). Insight into synergistic effects of biomass-polypropylene co-pyrolysis using representative biomass constituents. Bioresour. Technol. 307, 123–243. doi:10.1016/j.biortech.2020.123243
Chen, W.-H., and Kuo, P.-C. (2011). Isothermal torrefaction kinetics of hemicellulose, cellulose, lignin and xylan using thermogravimetric analysis. Energy 36, 6451–6460. doi:10.1016/j.energy.2011.09.022
Chen, W.-H., Peng, J., and Bi, X. T. (2015). A state-of-the-art review of biomass torrefaction, densification and applications. Renew. Sust. Energ. Rev. 44, 847–866. doi:10.1016/j.rser.2014.12.039
Chen, W.-H., Wang, C.-W., Ong, H. C., Show, P. L., and Hsieh, T.-H. (2019). Torrefaction, pyrolysis and two-stage thermodegradation of hemicellulose, cellulose and lignin. Fuel 258, 116–168. doi:10.1016/j.fuel.2019.116168
Curling, S., Clausen, C. A., and Winandy, J. E. (2001). The effect of hemicellulose degradation on the mechanical properties of wood during brown rot decay. Int. Res. Group Wood Preservation, 1–10. doi:10.1007/s13399-020-00861-4
Dence, C. W. (1992). The determination of lignin. Methods Lignin Chem., 33–61. doi:10.1007/978-3-642-74065-7_3
Dupuis, D. P., Grim, R. G., Nelson, E., Tan, E. C. D., Ruddy, D. A., Hernandez, S., et al. (2019). High-octane gasoline from biomass: experimental, economic, and environmental assessment. Appl. Energ. 241, 25–33. doi:10.1016/j.apenergy.2019.02.064
Enviromental Protection Agency (2017). Advancing sustainable materials management: 2017 fact sheet assessing trends in material generation, recycling, composting, combustion with energy recovery and landfilling in the United States. Available at: https://www.epa.gov/sites/production/files/2019-11/documents/2017_facts_and_figures_fact_sheet_final.pdf (Accessed November 11, 2020).
Fabiyi, J. S., and McDonald, A. G. (2010). Effect of wood species on property and weathering performance of wood plastic composites. Compos. Part. A. Appl. Sci. Manuf. 41, 1434–1440. doi:10.1016/j.compositesa.2010.06.004
Farhat, W., Venditti, R., Quick, A., Taha, M., Mignard, N., Becquart, F., et al. (2017). Hemicellulose extraction and characterization for applications in paper coatings and adhesives. Ind. Crop Prod. 107, 370–377. doi:10.1016/j.indcrop.2017.05.055
Fung, B. M., Khitrin, A. K., and Ermolaev, K. (2000). An improved broadband decoupling sequence for liquid crystals and solids. J. Magn. Reson. 142, 97–101. doi:10.1006/jmre.1999.1896
Gao, Z., Kaneko, T., Amasaki, I., and Nakada, M. (2003). A kinetic study of thermal degradation of polypropylene. Polym. Degrad. Stab. 80, 269–274. doi:10.1016/S0141-3910(02)00407-X
Han, B., Chen, Y., Wu, Y., and Hua, D. (2014). Co-pyrolysis behaviors and kinetics of plastics – biomass blends through thermogravimetric analysis. J. Therm. Anal. Calorim. 115, 227–235. doi:10.1007/s10973-013-3228-7
He, Q., Guo, Q., Ding, L., Gong, Y., Wei, J., and Yu, G. (2018). Co-pyrolysis behavior and char structure evolution of raw/torrefied rice straw and coal blends. Energ. Fuels 32, 12469–12476. doi:10.1021/acs.energyfuels.8b03469
He, Q., Ding, L., Gong, Y., Li, W., Wei, J., and Yu, G. (2019). Effect of torrefaction on pinewood pyrolysis kinetics and thermal behavior using thermogravimetric analysis. Bioresour. Technol. 280, 104–111. doi:10.1016/j.biortech.2019.01.138
Hu, J., Shen, D., Wu, S., Zhang, H., and Xiao, R. (2014). Effect of temperature on structure evolution in char from hydrothermal degradation of lignin. J. Anal. Appl. Pyrolysis 106, 118–124. doi:10.1016/j.jaap.2014.01.008
Hubbe, M. A., Venditti, R. A., and Rojas, O. J. (2007). What happens to cellulosic fibers during papermaking and recycling? A review. BioResources 2, 739–788. doi:10.15376/biores.2.4.739-788
Ito, M., and Nagai, K. (2010). Thermal aging and oxygen permeation of Nylon-6 and Nylon-6/montmorillonite composites. J. Appl. Polym. Sci. 118, 928–935. doi:10.1002/app.32424
Lauer, D., Motell, E. L., Traficante, D. D., and Maciel, G. E. (1972). Carbon-13 chemical shifts in monoalkyl benzenes and some deuterio analogs. J. Am. Chem. Soc. 94, 5335–5338. doi:10.1021/ja00770a032
Lavrykov, S. A., and Ramarao, B. V. (2012). Thermal properties of copy paper sheets. Dry. Technol. 30, 297–311. doi:10.1080/07373937.2011.638148
Lin, X., Zhang, Z., Wang, Q., and Sun, J. (2020). Interactions between biomass-derived components and polypropylene during wood–plastic composite pyrolysis. Biomass Conv. Bioref., 1–13. doi:10.1007/s13399-020-00861-4
Love, G. D., Snape, C. E., and Jarvis, M. C. (1998). Comparison of leaf and stem cell-wall components in barley straw by solid-state 13C NMR. Phytochemistry 49, 1191–1194. doi:10.1016/s0031-9422(98)00103-4
Maunu, S. L. (2009). “13C CPMAS NMR studies of wood, cellulose fibers, and derivatives,” in Charact. Lignocellul. Materials. Editors Q. Thomas, and Q. Hu. (Hoboken: Blackwell), 227–248.
Mayo, W. D. (2004). Characteristics of alkanes. in Course notes on the interpretation of infrared and Raman spectra. Editors D.W. Mayo F.A. Miller and R.W. Hannah, (United States: John Wiley and Sons), 33–72.
Moreira, L. R. S., and Filho, E. X. F. (2008). An overview of mannan structure and mannan-degrading enzyme systems. Appl. Microbiol. Biotechnol. 79, 165–178. doi:10.1007/s00253-008-1423-4
Olajire, A., Zhi, C., Hanson, S., and Wai, C. (2014). Thermogravimetric analysis of the pyrolysis characteristics and kinetics of plastics and biomass blends. Fuel Process. Technol. 128, 471–481. doi:10.1016/j.fuproc.2014.08.010
Oyedun, A. O., Gebreegziabher, T., Ng, D. K. S., and Hui, C. W. (2014). Mixed-waste pyrolysis of biomass and plastics waste–a modelling approach to reduce energy usage. Energy 75, 127–135. doi:10.1016/j.energy.2014.05.063
Pandey, K. K. (1999). A study of chemical structure of soft and hardwood and wood polymers by FTIR spectroscopy. J. Appl. Polym. Sci. 71, 1969–1975. doi:10.1002/(sici)1097-4628(19990321)71:12<1969:aid-app6>3.0.co;2-d
Papadopoulou, M. P., Karatzas, G. P., and Bougioukou, G. G. (2007). Numerical modelling of the environmental impact of landfill leachate leakage on groundwater quality - a field application. Environ. Model. Assess. 12, 43–54. doi:10.1007/s10666-006-9050-x
Peterson, J. D., Vyazovkin, S., and Wight, C. A. (2001). Kinetics of the thermal and thermo-oxidative degradation of polystyrene, polyethylene and poly(propylene). Macromol. Chem. Phys. 202, 775–784. doi:10.1002/1521-3935(20010301)202:6<775:aid-macp775>3.0.co;2-g
Pines, A., Gibby, M. G., and Waugh, J. S. (1972). Proton-enhanced nuclear induction spectroscopy. a method for high resolution nmr of dilute spins in solids. J. Chem. Phys. 56, 1776–1777. doi:10.1063/1.1677439
Salvilla, J. N. V., Ofrasio, B. I. G., Rollon, A. P., Manegdeg, F. G., Abarca, R. R. M., and de Luna, M. D. G. (2020). Synergistic co-pyrolysıs of polyolefin plastics with wood and agricultural wastes for biofuel production. Appl. Energ. 279, 115668. doi:10.1016/j.apenergy.2020.115668
Schaefer, J., Stejskal, E. O., and Buchdahl, R. (1975). High-resolution carbon-13 nuclear magnetic resonance study of some solid, glassy polymers. Macromolecules 8, 291–296. doi:10.1021/ma60045a010
Sharypov, V., Beregovtsova, N., Kuznetsov, B., Baryshnikov, S., Marin, N., and Weber, J. (2003). Light hydrocarbon liquids production by Co-pyrolysis of polypropylene and hydrolytic lignin. Chem. Sustain. Dev. 11, 427–434.
Shenoy, A. V. (1999). “Rheology of filled polymer systems,” in Library of congress cataloging-in-publication data (Netherland: Springer Science&Business Media Dordrecht), 54–111.
Sluiter, J., and Sluiter, A. (2011). Summative mass closure: Laboratory analytical procedure (LAP) review and integration: feedstocks; issue date: April 2010; Revision date: July 2011. Available at: http://www.nrel.gov/biomass/analytical_procedures.html (Accessed October 16, 2020).
Wang, X., Sotoudehniakarani, F., Yu, Z., Morrell, J. J., Cappellazzi, J., and McDonald, A. G. (2019). Evaluation of corrugated cardboard biochar as reinforcing fiber on properties, biodegradability and weatherability of wood-plastic composites. Polym. Degrad. Stab. 168, 108955. doi:10.1016/j.polymdegradstab.2019.108955
Wang, Z., Pecha, B., Westerhof, R. J. M., Kersten, S. R. A., Li, C. Z., McDonald, A. G., et al. (2014). Effect of cellulose crystallinity on solid/liquid phase reactions responsible for the formation of carbonaceous residues during pyrolysis. Ind. Eng. Chem. Res. 53, 2940–2955. doi:10.1021/ie4014259
Wei, L., McDonald, A. G., Freitag, C., and Morrell, J. J. (2013). Effects of wood fiber esterification on properties, weatherability and biodurability of wood plastic composites. Polym. Degrad. Stab. 98, 1348–1361. doi:10.1016/j.polymdegradstab.2013.03.027
Williams, C. L., Westover, T. L., Petkovic, L. M., Matthews, A. C., Stevens, D. M., and Nelson, K. R. (2017). Determining thermal transport properties for softwoods under pyrolysis conditions. ACS Sustain. Chem. Eng. 5, 1019–1025. doi:10.1021/acssuschemeng.6b02326
Xu, Z., Zinchik, S., Kolapkar, S. S., Bar-ziv, E., Hansen, T., Conn, D., et al. (2018). Properties of torrefied U.S. Waste blends. Front. Energ. Res. 6, 65. doi:10.3389/fenrg.2018.00065
Xu, Z., Albrecht, J. W., Kolapkar, S. S., Zinchik, S., and Bar-Ziv, E. (2020). Chlorine removal from U.S. Solid waste blends through torrefaction. Appl. Sci. 10, 3337. doi:10.3390/app10093337
Xue, Y., and Bai, X. (2018). Synergistic enhancement of product quality through fast co-pyrolysis of acid pretreated biomass and waste plastic. Energ. Convers. Manag. 164, 629–638. doi:10.1016/j.enconman.2018.03.036
Zhang, X., Lei, H., Zhu, L., Zhu, X., Qian, M., Yadavalli, G., et al. (2016). Bioresource Technology Thermal behavior and kinetic study for catalytic co-pyrolysis of biomass with plastics. Bioresour. Technol. 220, 233–238. doi:10.1016/j.biortech.2016.08.068
Zhou, L., Wang, Y., Huang, Q., and Cai, J. (2006). Thermogravimetric characteristics and kinetic of plastic and biomass blends co-pyrolysis. Fuel Process. Technol. 87, 963–969. doi:10.1016/j.fuproc.2006.07.002
Keywords: fiber waste, plastic waste, torrefaction, synergy, extrusion
Citation: Xu Z, Kolapkar SS, Zinchik S, Bar-Ziv E, Ewurum L, McDonald AG, Klinger J, Fillerup E, Schaller K and Pilgrim C (2021) Bypassing Energy Barriers in Fiber-Polymer Torrefaction. Front. Energy Res. 9:643371. doi: 10.3389/fenrg.2021.643371
Received: 18 December 2020; Accepted: 12 February 2021;
Published: 30 March 2021.
Edited by:
Wei-Hsin Chen, National Cheng Kung University, TaiwanReviewed by:
Lu Ding, East China University of Science and Technology, ChinaCopyright © 2021 Xu, Kolapkar, Zinchik, Bar-Ziv, Ewurum, McDonald, Klinger, Fillerup, Schaller and Pilgrim This is an open-access article distributed under the terms of the Creative Commons Attribution License (CC BY). The use, distribution or reproduction in other forums is permitted, provided the original author(s) and the copyright owner(s) are credited and that the original publication in this journal is cited, in accordance with accepted academic practice. No use, distribution or reproduction is permitted which does not comply with these terms.
*Correspondence: Jordan Klinger, am9yZGFuLmtsaW5nZXJAaW5sLmdvdg==
Disclaimer: All claims expressed in this article are solely those of the authors and do not necessarily represent those of their affiliated organizations, or those of the publisher, the editors and the reviewers. Any product that may be evaluated in this article or claim that may be made by its manufacturer is not guaranteed or endorsed by the publisher.
Research integrity at Frontiers

Learn more about the work of our research integrity team to safeguard the quality of each article we publish.