 Xiang-Feng Liu1,2
 Ling Wang1,2*
- 1The New Type Key Think Tank of Zhejiang Province, China Research Institute of Regulation and Public Policy, Hangzhou, China
- 2China Institute of Regulation Research, Zhejiang University of Finance and Economics, Hangzhou, China
Subsidy policy to electric vehicles in China was initially launched in 2001. This study uses the perspective of the characteristics of subsidy policy and applies generalized propensity score matching (GPS) to estimate the impact of different subsidy policy intensities on the change in consumer demand for EVs and find the interval to optimize. The study shows that the optimization interval of the policy is in the 40%–70% treatment level, which maximizes the effect of the subsidy on China’s EVs. For a treatment effect lower than 40%, it is difficult to effectively create an incentive to enter the EVs market in China because consumers think that the product is difficult to satisfy the demand of too low technology; by contrast, for the treatment level higher than 70%, the cost of the high endurance mileage power battery increases exponentially, and the complementary effect of subsidies is insufficient. Consequently, we propose three suggestions: The government should 1) use big data technology to supervise subsidies and design a real-time reporting mechanism and punishment mechanism for subsidy-misuse; 2) adopt the incentive regulation to promote the battery range of new energy vehicles (e.g., optimizing the subsidy ladder, innovating the form of subsidies) and gradually eliminate low-technology product; and 3) reasonably design a targeted regulatory mechanism that increases the cost of fraud and breach of contract to encourage firms to truthfully report technical indicators.
Introduction
Electric vehicles (EVs) are the main types of new energy vehicles in China and are the target of financial subsidies implemented by governments. Under many policy incentives, China’s EVs, especially domestic EVs, are among the world's best in terms of the level of scale development and the speed of technological progress. In 2018, the International Energy Agency (IEA) published the paper ‟IEA Global Electric Vehicle Outlook, 2018.” According to its data, China’s EV ownership in 2017 was approximately 40% of the world’s, which in that year was approximately 3.1 million. These achievements are inseparable from the Chinese government’s sustained financial policy support. However, the subsidy policy of EVs has also led to price distortions and serious deception; thus, the government and academia have started to review the effectiveness of the subsidy policy. The EVs subsidy policy was proposed in 2017, various ministries and commissions of China have adjusted the subsidy policies for EVs for many times to improve technical efficiency and achieve technological progress. Therefore, how to adjust subsidy policies that change the demand and future development of China’s EVs industry has become a common topic of concern in practice and academia and the focus of the Chinese government’s policymaking. Hence, from the perspective of the characteristics of subsidy policy, we use generalized propensity score matching (GPS) to estimate the impact of subsidy policy intensities on the change in consumer demand for EVs. The aim of this study is twofold: On the one hand, this study overcomes a gap in the literature, namely, studies have not focused on factors of subsidy policy; on the other hand, we provide an important theory and recommendation for the government to optimize the structure of subsidy policy.
The existing researches on government subsidies for China’s EVs have focused on the effect of subsidy policies (Helveston et al., 2015; Li et al., 2016; Li et al., 2019; Sheldon and Dua, 2019a; Sheldon and Dua, 2019b). Some researchers claim that subsidies do not affect the willing to adopt today’s BEVs and mid-range PHEVs in China, whereas consumers prefer low-range PHEVs despite subsidies (Helveston et al., 2015). (Yang et al., 2019). compare two kinds of subsides by establishing Cournot duopoly model and Stackelberg model to find that subsides policy can effectively expand the market share of domestic new energy vehicles with less technology. Beresteanu and Li (2011), Li et al. (2016), Li et al. (2019) analyzed the impact of subsidy policy on the uptake of product and subsidy modes, and found that the overall subsidy policy has significant effect. As incentive subsidies policies will have a significant impact, policy-makers should introduce policies aimed at ensuring a smooth transition to the electrification of China’s vehicle fleet (Ouyang et al., 2020). Based on the data of China’s plug-in electric vehicles, (Sheldon and Dua, 2020), adopt the choice model to predict PEV market share under various subsidy scenarios, they find that PEVs have improved China’s new vehicle fleet fuel economy by roughly 2%, reducing total gasoline consumption by roughly 6.66 billion liters under expensive subsidies. On the contrary, reviewing the feasible fuel and/or electricity energy intensity of LDVs and arguing that the severity of impending anthropogenic global warming merits, (Harvey, 2020), think that subsidies for EVs should be scaled back or eliminated.
However, little is known about effectiveness of targeted designs of subsidy policy. Xiao et al. (2020a), Xiao et al. (2020b) find that the optimal subsidies should include the environmental cost of GHG emissions and the enterprise's profits excluding the innovation risk. Targeted subsidy designs for PEVs will have a greater impact than blanket subsidies (Sheldon and Dua, 2019a; Sheldon and Dua, 2019b). So, this paper adopts micro data to analyze the impact of targeted designs of subsidy policy on consumer demand. Therefore, the two marginal contributions of this paper are as follows: First, this study attempts to manage the new energy subsidy policy, analyze the influence of different subsidy policy intensities on the market’s consumer demand, avoid the problem in the literature of entire adjustment, and study how to adjust the policy, to provide recommendations for the government to formulate and optimize the subsidy policy. Second, from the perspective of research data, this study uses monthly micro data collected from motor manufacturers from 2017 to 2018 for empirical research. Compared with the research that has used the data of listed companies, this study overcomes the corresponding research selectivity bias and other problems; compared with the research on industry-level data, this study attempts to relax the homogenization hypothesis to conduct microcosmic and unbiased research.
The arrangement of the remainder of this paper is as follows: Methodology mainly introduces the use of the model and GPS statistical strategy; Data mainly shows how we managed the data preprocessing and the descriptive analysis; Empirical Analysis and Discussion mainly analyzes and discusses the results of empirical research, to ensure the overall robustness of the model and avoid false regression; and Sensitivity Test adopts the method of eliminating the control variables to test the robustness of the model. The final part summarizes the whole paper, and based on the conclusion, offers corresponding suggestions and supporting regulatory policies.
Methodology
Econometric Model
In this paper, the construction method of demand estimation variables mainly refers to the construction of a demand estimation model in the empirical analysis of industrial organization theory. Due to the strong heterogeneity of the products consumed by the representative consumers studied in this paper, which is mainly reflected in different brands, classes, and types of vehicles, simply using the LOGIT demand model would inevitably create the problem of the unrelated choice independence hypothesis (Berry, 1994). Therefore, this paper adopts the nested logit demand model often used in the empirical model of industrial organizations (Deng and Ma, 2010; Dai and yuan, 2013; Zhou, 2017; Li et al., 2019).
The econometric model is as follows:
First, we describe the strategic process for consumers to purchase Chinese EVs. Based on the assumption that consumers have decided to buy EVs, the process is mainly divided into three decision-making levels. In the first decision-making level, consumers mainly consider whether to buy Chinese EVs by comparing these EVs with foreign EVs, of which Tesla is the main brand; thus, the brand of foreign EVs is used as the control group of the Chinese EVs market. At the second decision-making level, consumers mainly consider pure EV manufacturers (Firms), that is, various manufacturers’ brands in the market, where
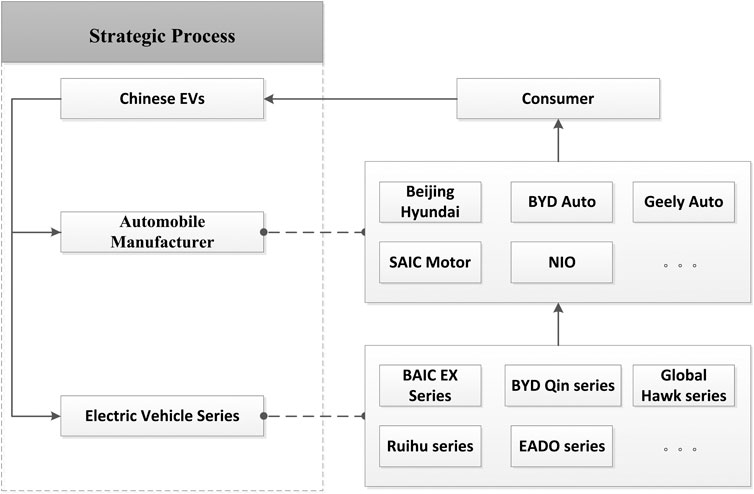
FIGURE 1. Decision-making of consumers purchasing Chinese EVs.
Second, the utility function of Chinese EVs is designed. In this paper,
where,
Combining Eqs 1,2, we also find that
Third, according to Berry (1994), we obtain the market share of all types of automobile brands in all Chinese EV markets and build the demand model, which comprises the corresponding market share and consumer demand. The market share of corresponding model
In the same manner, the market share among the corresponding manufacturer groups can be also expressed as:
Combining Eqs 4,5, we will obtain the market share of corresponding vehicle
We will assume that consumers choose the foreign EV (Tesla) that is imported, regarding this type of vehicle as a benchmark, and assume that
Here, by calculating Eqs 6,7, we can obtain:
Consequently, we can obtain the corresponding statistical model (9) by substituting Eq. 8 into corresponding Eq. 2.
For the corresponding share difference on the left side of Eq. 9, we can calculate the corresponding EVs’ market sales volume. Therefore, the overarching variables of this paper are transformed into the corresponding market share natural logarithm difference through the demand estimation model and can then be processed through the sales data (sale) of various manufacturers and vehicle types in the market to achieve the research purpose.
However, in the actual measurement and statistics process, because the measurement model involves price, market share, and intragroup market share, and other factors. OLS and other methods cannot overcome the endogenous problems; thus, the coefficients estimated must be biased. For this reason, we considered using propensity score matching (PSM) to eliminate the endogenous problems. In addition, this study is based on the analysis of the characteristic effect of subsidy policy, and traditional PSM is inappropriate for the treatment of continuous variables1; thus, this paper adopts GPS as the method for improvement.
Statistical Strategy of the Generalized Propensity Score Matching Method
GPS was first proposed by (Hirano and Imbens, 2004). Since traditional PSM is only applicable to 0–1 treatment variables and cannot solve the problem of continuous treatment variables, GPS has been widely used since it was proposed, especially in international trade, R&D cooperation intensity, and targeted poverty alleviation (Yang et al., 2019). Based on our review of the literature, we propose that the advantage of this method is its management of specific policies in a structured manner; thus, this method is consistent with the goal of this study.
Therefore, the corresponding statistical strategies of this study are as follows:
First, we construct the conditional distribution of the treatment variables and calculate the GPS of the variables. The treatment variable analyzed is the amount of the government subsidies. Because the research object is Chinese EVs, there is no case when the subsidy amount is 0; thus, the distribution of variables conforms to the normal distribution hypothesis proposed by Hirano and Imbens, (2004). Thus, we will obtain the corresponding conditional distribution of treatment variables as follows:
where
where,
Second, based on the first step of estimating the corresponding GPS value and treatment variable subsidy amount, we will construct the conditional expectation of the corresponding consumers demand for EVs; thus, we can obtain:
where,
Third, the dose-response function is estimated and used to assess the average potential outcome for each level of the treatment in which the scholars are interested. According to the corresponding multiple coefficients
where
Data
The data used in this paper are mainly the monthly micro data released by the China Automobile Association and China Passenger car Federation and published research from January 2017 to December 2018, including the price data of Chinese EVs for two years, the sales data of different series of vehicles of various manufacturers and so forth; the data of Tesla cars in the group is mainly from the global import and export data, which is from China Customs micro database. The main purpose of using micro data is to solve the problem of subsidy heterogeneity that has been difficult to resolve at the industry level, for example, different financial subsidies for EVs with different endurance mileage, and when the same manufacturer continuously introduces the same series to fulfill the subsidy policy. In summary, this paper uses this data to conduct in-depth analysis of different series of EVs, and this method not only conforms to the consistent research ideas of the automobile industry but also overcomes the difficulty of capturing and characterizing the heterogeneity subsidy intensity.
In addition, to make a detailed description of each EV series, this study collects and matches the corresponding vehicle technology variables, for example, vehicle wheelbase, vehicle use, vehicle grade, and pure electric vehicle range, from websites, for example, those for automobile homes, the Sohu automobile network, and first electric. Due to the corresponding subsidy policies of the government, there are corresponding subsidy regulations, subsidy intensities, and subsidy starting times for different subsidy endurance mileage, especially in 2018, which is more detailed regarding the specific implementation span, namely, the starting and ending time, which the government defined as February 12 to June 11, 2018, for the new energy vehicle subsidy transition period. Accordingly, this study collects and sorts the subsidy standard (Table 1).
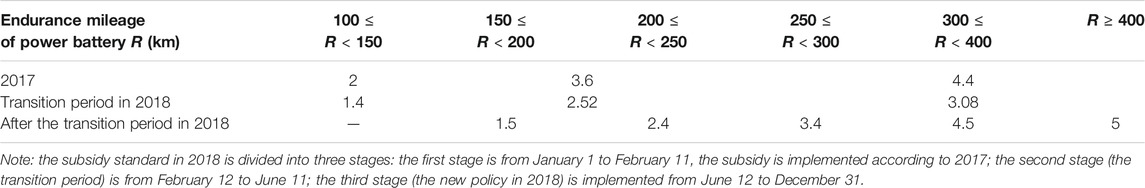
TABLE 1. Detailed list of national subsidy policies for EVs in China (10,000 Yuan).
In this paper, 3,114 observations are collected, and each includes the monthly data of a vehicle model, including the sales volume, price, subsidies, battery, firm, series, class, and type of EVs. The descriptive statistics of each main variable are presented in Table 2.
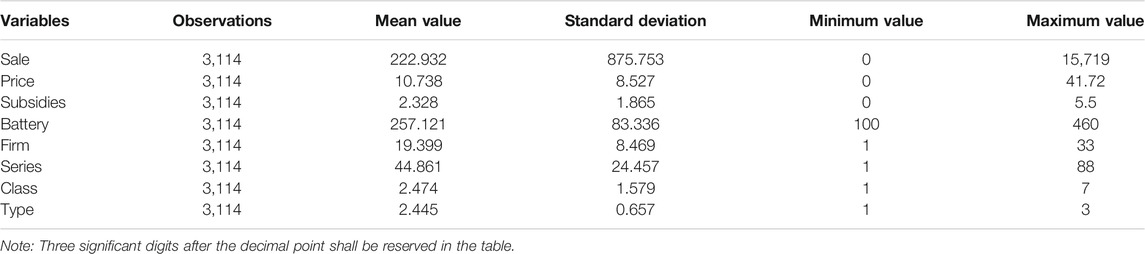
TABLE 2. Descriptive statistics of related variables.
Empirical Analysis and Discussion
This study focuses on the impact of subsidy policies on the demand for Chinese EVs. Therefore, the empirical process of this paper is mainly divided into the following four parts: First, this paper structures the national subsidy policy for EVs by partitioning the endurance mileage of the battery (km) into four intervals—[0.100], (100,150], (150,250], (250,460]—by referring to “The Requirements of The Notice on Adjusting and Improving The Financial Subsidy Policy for The Promotion and Application of New Energy Vehicles” (CJ [2018] No. 18). Second, according to the estimation strategy of the GPS, we test whether the GPS statistics fulfill the requirements of data balance and the normal distribution hypothesis and then obtain the corresponding GPS values if the results satisfy the condition. Third, the PROBIT model is used to measure the relative purchase ratio of the control group (imported pure EVs) and Chinese pure EVs. The results of the dose-response function and treatment effect show that different levels of subsidies affect consumers’ willingness to buy imported pure EVs, and this is used to determine the relative willingness of subsidy policies to purchase Chinese pure EVs. Finally, we adjust and determine the optimal subsidy interval.
Normal Distribution of the Treatment Variable Distribution Test
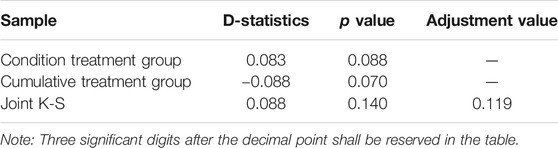
TABLE 3. K-S normal distribution test.
The results in Table 3 show that the distribution of the treatment effect variables adopted in this paper obeys the normal distribution. Specifically, the p values of the conditional treatment group and the cumulative treatment group in Table 3 are 0.088 and 0.070, respectively, and the p value of the corresponding joint K-S is 0.140. Even for the modified joint K-S, the p value is still 0.119. Therefore, the results show that it is difficult to reject the corresponding principle hypothesis. In other words, the conditional expectation distribution of treatment effect variables is consistent with that of the classical normal distribution.
Balancing Test for the Treatment Interval
Through the calculation of the corresponding GPS values of each interval, the corresponding results presented in Table 4 are captured. Notably, this paper sets four intervals according to the national subsidy policy division standard, but the number of samples where there is endurance mileage in the [0,100] is rare. Thus, we merge [0,100] and (100,150] in the statistical process, and there are three effect intervals (Table 4).
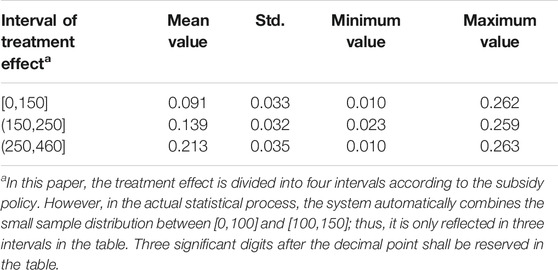
TABLE 4. GPS value of the intervals of the treatment effect.
However, only satisfying the aforementioned normal distribution characteristics is insufficient to provide a sufficient condition for further research and statistics; thus, we must test the overall stability property of the treatment interval. After the corresponding GPS values are estimated, the double-tailed t test of trend matching is conducted to determine whether all the data satisfy the significant balance characteristics of trend matching. The results are presented in Table 5, which reflects the mean value difference of the corresponding control variables and corresponding t statistics. Stata 14.0 assesses that the data characteristics fulfill the corresponding data balance test at the 99% confidence level according to the standard double-tailed t test. At this point, we obtain the corresponding GPS values that fulfill the requirements.
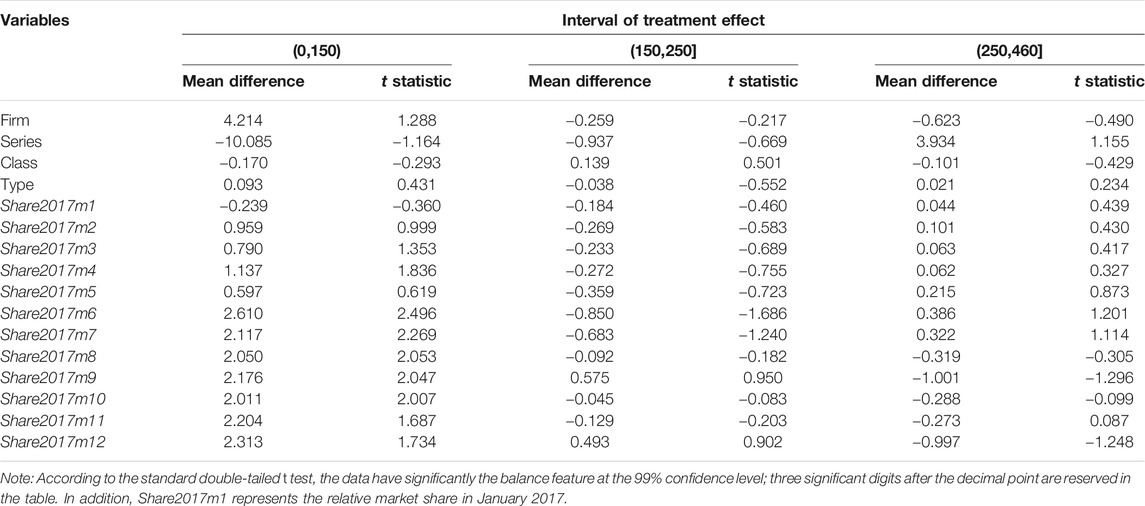
TABLE 5. Balancing test of three treatment intervals.
Dose-Response Function
In this subsection, the parameters of the dose-response function are estimated according to Eq. 12 in the measurement strategy. Specifically, the corresponding coefficient estimated in Table 6 is used into Eq. 12 to obtain Eq. 15:
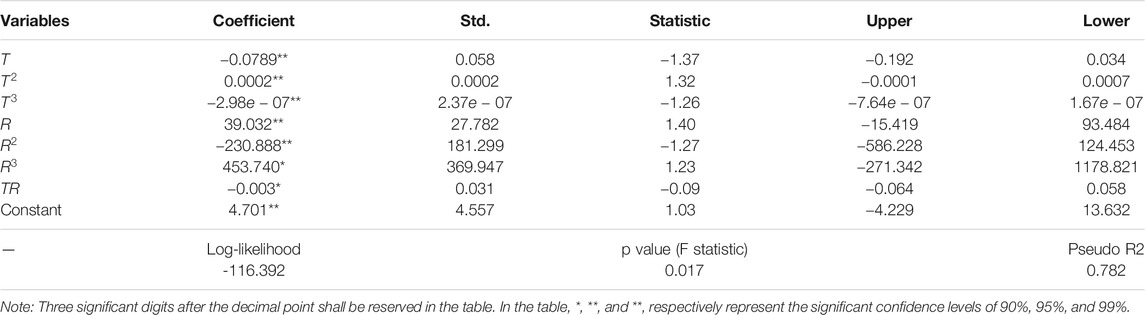
TABLE 6. Estimation of the dose-response model.
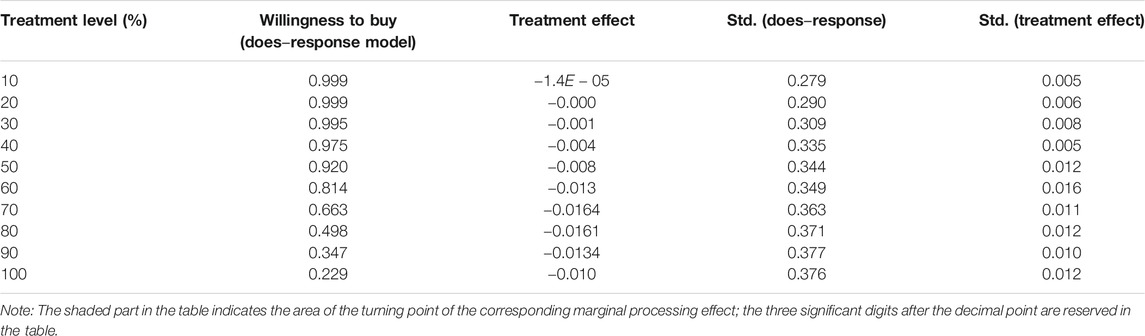
TABLE 7. Consumer’s willingness to buy Chinese EVs and prediction of the turning point.
Accordingly, the F statistic of the dose-response function is 0.017, which is significant at the 95% confidence level, and its relative R-square value is as high as 78.2%. This result shows that the model has a strong, steady interpretation ability. In a later chapter, we conduct a robustness test to prevent false regression and other problems.
Treatment Effect and Discussion
On the basis of the aforementioned premise hypothesis and model test, this paper calculates the expected probability of consumers purchasing EVs at different processing levels and then draws the corresponding does-response curve (see the left side of Figures 2). The right side of Figures 2 shows the marginal treatment effect at different treatment levels. According to the curve change in Figures 2, China’s new energy subsidy policy has three arrangements for the consumption demand of Chinese EVs.
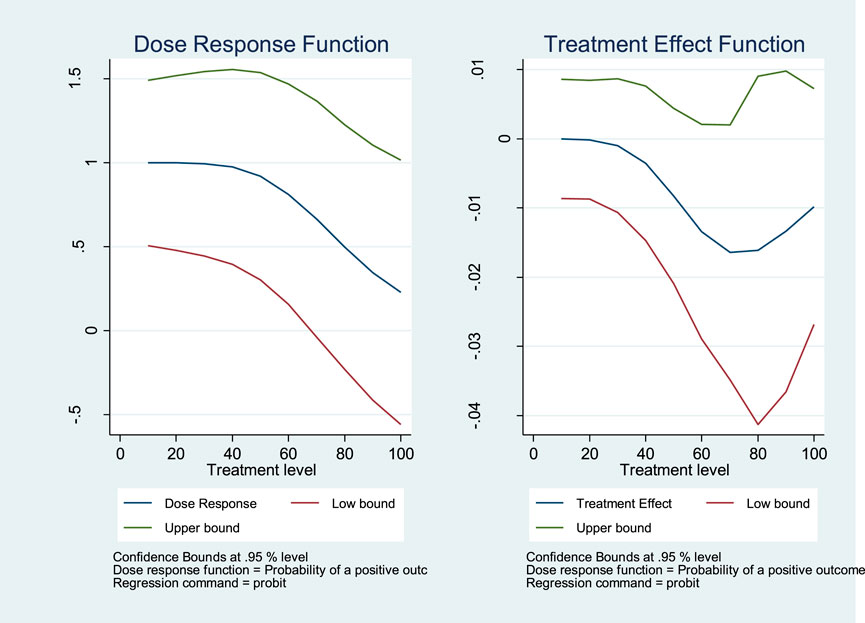
FIGURE 2. Does-response and treatment effect of EV purchase probability.
In the first arrangement, in which the range is mainly concentrated in the range of 0%–40% of the treatment level, the corresponding battery endurance mileage is approximately 0–179 km. From the perspective of the actual subsidy process, the amount of subsidy in this arrangement does not affect the decision-making of consumers very well. We can say that with the interval of a subsidy, it is difficult to achieve the role of stimulating consumption and supporting Chinese automobile brands. Therefore, the subsidy effect in this level is relatively low and only plays a basic role in the subsidy threshold.
In the second arrangement, the range is mainly 40%–70% of the treatment level, and the corresponding battery endurance mileage is approximately 179–334 km. This arrangement is the area with the fastest decline rate of the reagent reaction curve.
Combined with Table 3, we observe that although the willingness to buy imported pure EVs continues to decline under the impact of subsidy policies, when the treatment level is 70%, there is a significant turning point in the treatment effect. In the third column of Table 3, when the treatment level is 70%, the corresponding treatment is only -0.0164, reaching the bottom of the treatment effect curve. According to the actual situation and data, this interval is the best level for the effect of subsidy policy because the core of the subsidy policy is shifted backward; thus, the consumers have more price preference, and the consumers’ preference for the subsidized Chinese EVs is significantly affected. By contrast, the battery technology level is relatively mature in this level, EVs categories are relatively rich; thus, consumers have sufficient choice space. This paper also estimates that the contribution of this level to consumer impact accounts for approximately 66%.
In the third arrangement the range shows that after 70% of the treatment level, the corresponding endurance mileage is more than 334 km. According to the information in Figures 3 and Table 8, the pharmaceutical reaction in the third interval continues its downward trend, which shows that the impact of the subsidy policy continues to promote the consumption demand of Chinese EVs, but the acceleration of effect has declined. According to the curve of the treatment effect, after the turning point, the effect of the subsidy policy in this interval is obviously reduced, and the main reasons for this phenomenon are as follows: first, because of the rapid increase in the cost of high-performance vehicles with endurance of more than 334 km, the corresponding high subsidy amount has declined in the attraction of this part of consumers. Second, consumers of higher performance pure EVs are not so sensitive to the product price, and this part of consumption focuses more on the corresponding services, concepts, and supporting aspects. Therefore, when subsidies act on this level, the consumers at the top of the pyramid weaken the effect of the subsidy policy.
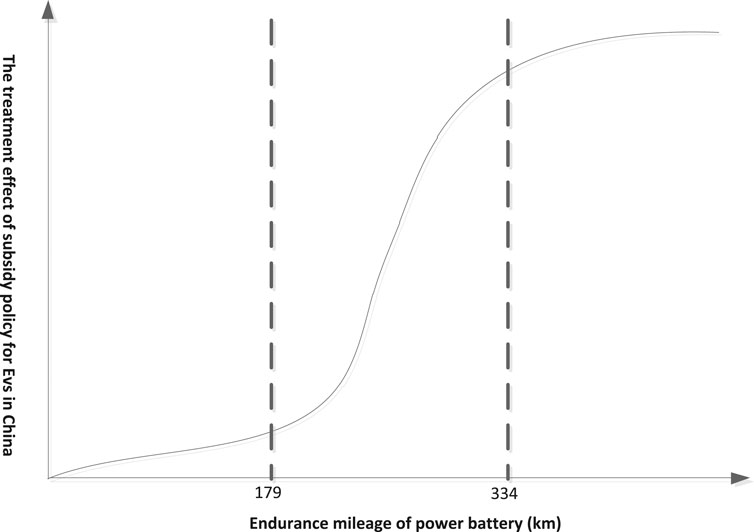
FIGURE 3. Effect of EVs subsidy policies on consumers’ willingness.
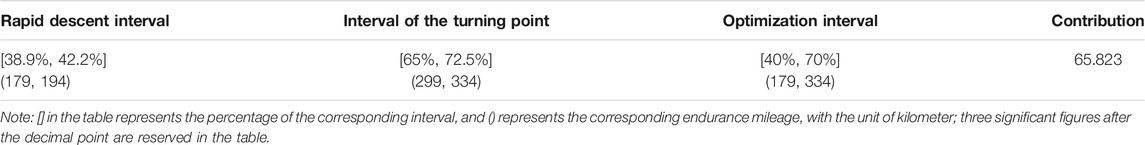
TABLE 8. Optimal contribution range and contribution value of subsidy policy for EVs.
Based on these three arrangements, this paper considers that the effect of the subsidy policy in promoting the development of Chinese EVs and the distribution of consumer preferences form an “s”-type feature (Figures 4).
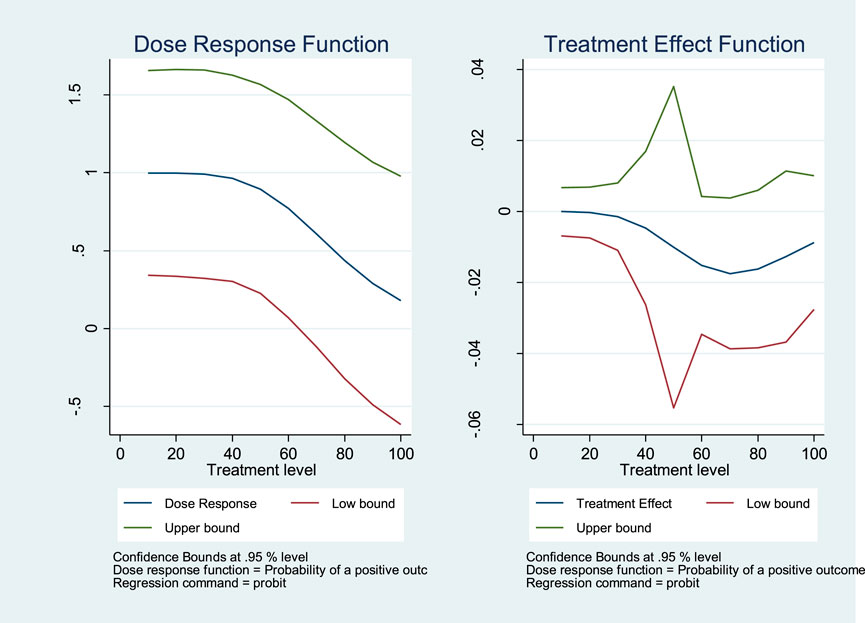
FIGURE 4. Does-response and treatment effect of EV purchase probability without type.
Sensitivity Test
In this section, we conduct a sensitivity test to prevent the phenomenon of pseudo regression and ensure that the model is steady. This study mainly tests the stability of the model by eliminating the different control variables.
The results show that regardless of which control variable is eliminated, the overarching indicators do not change which they are the interval where the inflection point of the treatment effect appears, the rapid descent interval, the optimal interval of the subsidy effect, and the relative contribution. Specifically, the inflection point of the treatment effect of the subsidy policy is basically between 66% and 72% of the treatment level, approximately 70% of the horizontal position; the rapid settlement area reflected by medicament is basically between 38% and 43%; the optimal contribution range of the subsidy effect can be determined between 40% and 70%; finally, the optimal contribution range can increase to approximately 66%. The information in Table 9 show that the overall robustness of the model is not significantly affected by the change in the corresponding control variables. To more intuitively express this conclusion, this paper draws the drug response curve and treatment effect curve after the two relaxation condition assumptions (Figures 5).
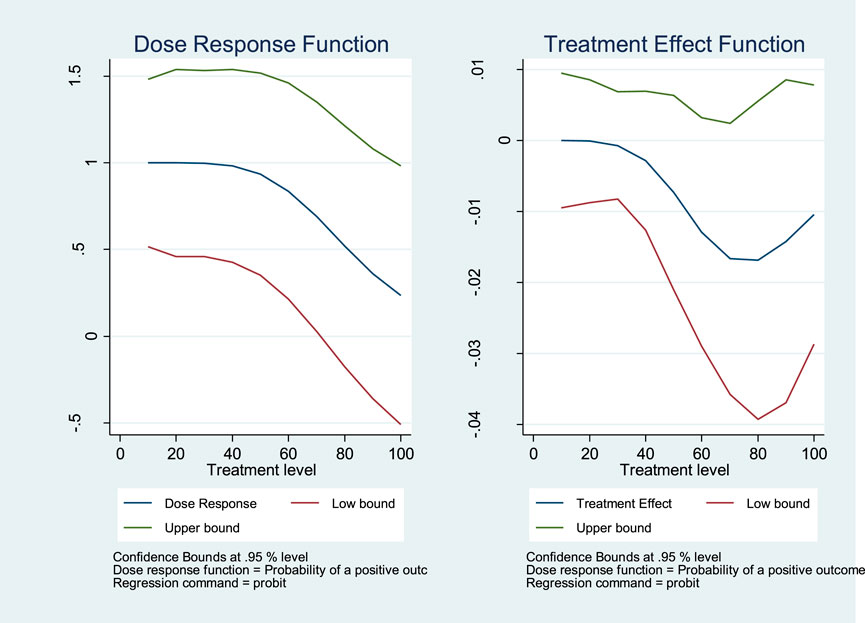
FIGURE 5. Does-response and treatment effect of EV purchase probability without class.
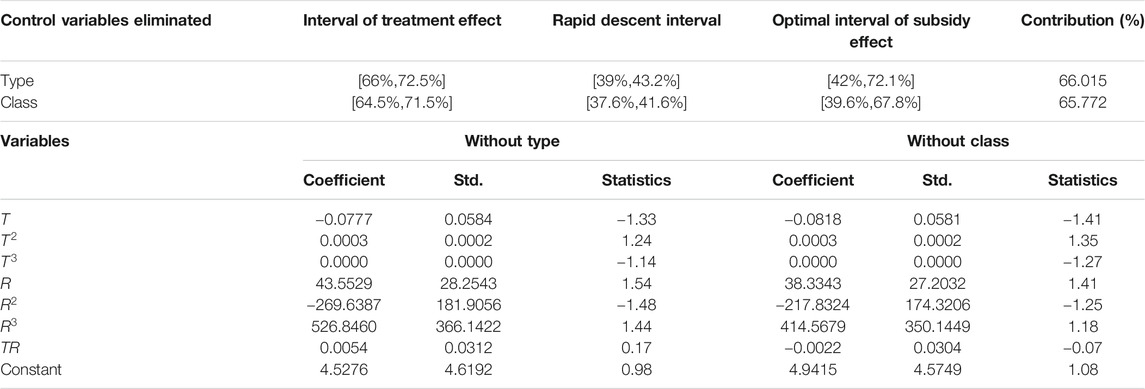
TABLE 9. Sensitivity test of the model estimated.
Conclusion and Regulatory Policy
As an important starting point for the government to support the rapid development of China’s EVs industry, the subsidy policy has attracted extensive attention from academic and practical circles. During the ten years of the implementation of the subsidy policy, the policy has been continuously adjusted and has thus evolved; there have been two stages: adjustment of the total amount of the subsidy policy, and adjustment of the “” subsidy policy. Notably, the literature has not emphasized the adjustment of the policy; thus, how to optimize the policy was unknown. This study is based on the aforementioned problems and analyzes the impact of consumer demand of domestic pure electric enterprises in China by using the GPS method, obtains the corresponding subsidy policy agent response and treatment effect, and proposes corresponding policy optimization countermeasures and suggestions.
The corresponding research conclusions are as follows: the current new energy subsidy policy has three levels of effects, the first level focuses on the range of 179 km, which is the worst, and is mainly reflected in the threshold effect; the second level focuses on the range of 179 km–334 km, which is the most likely to cause consumer demand, and its main contribution value is more than 65%, which should be regarded as the key area of optimization and inclination; the final level mainly focuses on more than 334 km, the policy effect of this level is affected by factors such as price and consumer group characteristics, and its contribution degree is approximately 30%.
According to these research conclusions, we propose the following two suggestions:
First, the government must understand the adjustment of subsidy policy, optimize and establish the structure of subsidy policy, and use the role of subsidy policy on the demand side. First, we propose that based on the annual decline of China's new energy subsidy policy, it should be adjusted and reshaped, and the understanding of the total decline mechanism should be abandoned. Whether it is China’s new energy subsidy policy or its decline mechanism, if the difference and structure are not measured and evaluated, equalization will be misunderstood. Second, on the basis of reshaping the understanding of subsidy policy, this paper considers that an accurate measurement of the effect level of different interval subsidy policies is the key factor. Timely optimization and adjustment are formed for the different effect intervals, especially in the demand effect stimulation at the demand end, which is the most important premise when forming the pattern of “market leading and policy effective support.”
Second, the government should formulate supporting regulatory policies and design a signal mechanism to ameliorate the cheating behavior through which firms mislead consumers by overstating endurance mileage to eliminate consumers’ concerns about purchasing Chinese pure EVs, and promote the technological progress and sound development of the industry. In the development of the Chinese EV industry, consumers are most concerned about the durability of the power battery and the authenticity of the endurance mileage. In the analysis, we also found that the marginal treatment effect of Chinese EVs appears to be an obvious turning point in the higher mileage range. This conclusion suggests that the increasing cost of index weakens the subsidy effect. By contrast, what is more important is to show that consumers’ concern about the higher mileage parameters also affects the effect of the subsidy policy. Therefore, the government should strengthen the supervision of the endurance mileage of EVs, use the national supervision and management platform of China's new EVs to regularly publish the product verification to the public, and increase the symmetry and transparency of market information. On the one hand, the supporting regulatory policy would eliminate the purchase concerns of consumers and potential customers; on the other hand, it would effectively stimulate EV manufacturers and battery suppliers to improve management and industry technology and promote the sound development of the industry.
Third, using big data technology to regulate subsidies, the government should design a real-time reporting mechanism and a punishment mechanism for subsidy misuse. With the traditional government regulation, it is difficult to track the usage of the subsidy effectively because of technical limitations; thus, the subsidy policy can only be modified and adjusted after the occurrence of fraud and cannot be optimized and prevented in advance. However, big data technology can be supported by a lot of data to analyze the changes of corporate behavior and performance in real time after the grant of subsidies, to form anticipation and inference in advance, accurately identify the possible fraud and compensation behavior, and design a real-time feedback mechanism. Additionally, the government should also use mechanism design theory to design the punishment mechanism for subsidy misuse, which increases the cost of a firm’s breach of contract and cheating, to make the enterprise lack the probability of deception because of the incentive’s compatibility. In addition, the government should design a regulatory mechanism for regulatory agencies, to improve the efficiency of supervision and implementation by influencing the interests of regulators. In summary, by adopting big data technology and mechanism design theory, the government could form a supervision system and tracking mechanism to prevent problems, improve regulatory efficiency in the middle of the event and afterward, and ensure the effective implementation of subsidy policy.
Data Availability Statement
The raw data supporting the conclusions of this article will be made available by the authors, without undue reservation.
Author Contributions
X-fL supplies the data and methods for the research. LW supplies the idea for researching the relation between the subsidies policy and regulation policy. All authors contributed to the article and approved the submitted version.
Funding
The author is thankful for the financial support from the Natural Science Foundation projects of China “Evaluation of China’s new energy subsidy policy, precise subsidy mechanism and incentive regulation” (Grant No. 72003168) , the support from Project of the National Social Science Foundation of China “Research on Quantitative Screening, Formation Mechanism and Regulatory Control of ‘Pseudo PPP’ in Public Utilities” (Grant No. 71773106) and the support from the Zhejiang Natural Science Foundation projects “Recognition of effectiveness of subsidies in hybrid power and policy research on government regulation” (Grant No. LY19G030016) and projects “Study on the Impact of the ‘Fang-guan-fu’ Reform on the Investment and Regulatory Optimization in Power Generation Industry” (Grant No. LY20G030012). The author is also thankful for the financial support from the Youth Fund for Humanities and Social Sciences Research of the Ministry of Education of the People's Republic of China “Research on the dynamic mechanism of subsidy entry and exit in China's new energy industry: from the perspective of incentive regulation” (Grant No.18YJC790105), and the Youth Fund for the National Social Science Foundation of China “Research on Strategic Behavior of Pipeline Companies and Access Regulation Based on Network Bottleneck”(Grant No.71903180).
Conflict of Interest
The authors declare that the research was conducted in the absence of any commercial or financial relationships that could be construed as a potential conflict of interest.
Footnotes
1Although traditional propensity score matching (PSM) can well solve the endogenous problem, its assumption must be set up as a binary variable of 0–1, which is difficult to deal with continuous variables.
2The appellation of this discriminant function is mainly from the appellation of Michela BIA and other scholars in the official journal of Stata supporting by Bia and Mattei (2008), and then the scholars retain this appellation.
References
Beresteanu, A., and Li, S. (2011). Gasoline prices, government support, and the demand for hybrid vehicles in the United States. Int. Econ. Rev. 52 (1), 161–182. doi:10.1111/j.1468-2354.2010.00623.x
Berry, S. T. (1994). Estimating discrete-choice models of product differentiation. Rand J. Econ. 25 (2), 242–262. doi:10.2307/2555829
Bia, M., and Mattei, A. (2008). A stata package for the estimation of the dose-response function through adjustment for the generalized propensity score. Stata J. 8 (3), 354–373. doi:10.1177/1536867x0800800303
Cardell, N. S. (1997). Variance components structures for the extreme-value and logistic distributions with application to models of heterogeneity. Econom. Theory 13 (2), 185–213. doi:10.2307/3532724
Dai, M., and Yuan, Y. (2013)). Product differentiation and efficiencies in the retail banking industry. J. Bank. Financ. 37 (12), 4907–4919. doi:10.1016/j.jbankfin.2013.09.005
Deng, H., and Ma, A. C. (2010). Market structure and pricing strategy of China’s automobile industry. J. Ind. Econ. 58 (4), 818–845. doi:10.1111/j.1467-6451.2010.00434.x
Harvey, L. D. D. (2020). Rethinking electric vehicle subsidies, rediscovering energy efficiency. Energy policy, 146–112. doi:10.1016/j.enpol.2020.111760
Helveston, J. P., Liu, Y., Fiet, E. M., Fuchs, E., Klampfl, E., Michalek, J. J., et al. (2015). Will subsidies drive electric vehicle adoption? Measuring consumer preferences in the US and China. Transportation research, part A. policy and practice 73, 96–112. doi:10.1016/j.tra.2015.01.002
Hirano, K., and Imbens, G. W. (2004). The propensity score with continuous treatments. in Applied Bayesian Modeling and Causal Inference from Incomplete-Data Perspectives. Hoboken, NJ: Wiley, 181. doi:10.1002/0470090456.ch7
Li, W., Long, R., Chen, H., Chen, F., Zheng, X., and Yang, M. (2019). Effect of policy incentives on the uptake of electric vehicles in China. Sustainability 11, 3323. doi:10.3390/su11123323
Li, W., Long, R., and Chen, H. (2016). Consumers’ evaluation of national new energy vehicle policy in China: an analysis based on a four paradigm model. Energy Policy 99, 33–41. doi:10.1016/j.enpol.2016.09.050
Ouyang, D., Zhou, S., and Ou, X. (2020). The total cost of electric vehicle ownership: a consumer-oriented study of China's post-subsidy era. Energy Policy 149, 112023. doi:10.1016/j.enpol.2020.112023
Sheldon, T. L., and Dua, R. (2019a). Assessing the effectiveness of California’s ‟replace your ride”. Energy Policy 132, 318–323. doi:10.1016/j.enpol.2019.05.023
Sheldon, T. L., and Dua, R. (2020). Effectiveness of China’s plug-in electric vehicle subsidy. Energ. Econ. 88, 104773. doi:10.1016/j.eneco.2020.104773
Sheldon, T. L., and Dua, R. (2019b). Measuring the cost-effectiveness of electric vehicle subsidies. Energ. Econ. 84, 104545. doi:10.1016/j.eneco.2019.104545
Xiao, X., Chen, Z., Wang, C., and Nie, P. U. (2020b). Effect of an electric vehicle promotion policy on China’s Islands: a case study of Hainan Island. Front. Energ. Res. 8, 132. doi:10.3389/fenrg.2020.00132
Xiao, X., Chen, Z.-R., and Nie, P.-Y. (2020a). Analysis of two subsidies for EVs: based on an expanded theoretical discrete-choice model. Energy 208, 118375. doi:10.1016/j.energy.2020.118375
Yang, D.-X., Qiu, L.-S., Yan, J.-J., Chen, Z.-Y., and Jiang, M. (2019). The government regulation and market behavior of the new energy automotive industry. J. Clean. Prod. 210, 1281–1288. doi:10.1016/j.jclepro.2018.11.124
Keywords: structural effect of subsidy policy, Chinese electric vehicles, generalized propensity score matching, regulatory polices, micro data of chinese mobile manufacturers
Citation: Liu X-F and Wang L (2021) The Effects of Subsidy Policy on Electric Vehicles and the Supporting Regulatory Policies: Evidence From Micro Data of Chinese Mobile Manufacturers. Front. Energy Res. 9:642467. doi: 10.3389/fenrg.2021.642467
Received: 16 December 2020; Accepted: 02 February 2021;
Published: 18 March 2021.
Edited by:
Hong-zhou Li, Dongbei University of Finance and Economics, ChinaReviewed by:
Xiaojun Cheng, Zhejiang Normal University, ChinaPu-yan Nie, Guangdong University of Finance and Economics, China
Copyright © 2021 Liu and Wang. This is an open-access article distributed under the terms of the Creative Commons Attribution License (CC BY). The use, distribution or reproduction in other forums is permitted, provided the original author(s) and the copyright owner(s) are credited and that the original publication in this journal is cited, in accordance with accepted academic practice. No use, distribution or reproduction is permitted which does not comply with these terms.
*Correspondence: Ling Wang, d2FuZ2xpbmc1MUAxNjMuY29t