 Hongzhong Li1
 Yao Wang
- 1School of Electrical Engineering, Shanghai University of Electric Power, Shanghai, China
- 2East China Electric Power Design Institute Co., Ltd., China Power Engineering Consulting Corporation, Shanghai, China
An analysis model of wind power consumption capacity is established with the multi-fractal theory. Firstly, the fluctuation characteristics of wind power are described through multi-fractal parameters, and the correlation between wind power fluctuation characteristics and consumption capacity are analyzed. Afterwards, the swinging door algorithm (SDA) is applied to divide the wind power curve in the evaluation period, and the fluctuation process with similar characteristics is clustered. Further, a functional analysis model to evaluate wind power consumption capacity is mentioned based on the fluctuation clustering results. Finally, the effectiveness of the method is verified by an example of a regional power grid in China, and the influence of adjustable parameters in the model on the consumption capacity is quantitatively analyzed.
Introduction
With the increase of power demands, the proportion of renewable energy in power grid is increasing, especially the wind power (Qazi et al., 2019). The installed capacity of wind power has reached 210 GW, accounting for 10.4% of the total in China by the end of 2019. The installed capacity is expected to reach 250 GW by the end of 2020, and the proportion of wind power in the energy supply system will increase year by year (Global Energy Interconnection Development and Cooperation Organization, 2020). However, the volatility and randomness of wind power bring severe challenges to the dispatching and operation of power system.
In recent years, the problem of “wind power curtailment” is becoming more and more serious, which has caused a waste of power generation resources and brought some economic losses. To ensure the safety and economy of power system, the reasonable wind power uncertainty model and unit commitment optimization method are established (Chen et al., 2019; Zhang et al., 2019a; Zhang et al., 2019b; Chen et al., 2020). In (Zhang et al., 2019a), the optimal unit commitment decision was obtained by considering the temporal and spatial correlation of wind load uncertainty prediction error. In (Zhang et al., 2019b), the time autocorrelation of wind power/load forecasting error and outage probability are considered in the unit commitment optimization method. These models not only reduce the operation cost of the optimization results, but also ensure the safe operation of the power system.
On the other hand, aiming at the problem of wind power curtailment, some literature focuses on how to improve the consumption capacity of wind power. In (Meena et al., 2017), a new bi-level optimization framework is proposed aim at the optimal configuration and operation management of wind power generation. To enhance the adaptability and load acceptance of wind power, Wu et al. (Wu and Jiang., 2019) considered the joint planning, which includes installed capacity and location of wind power, expansion of transmission network, and location and scale of energy storage system. With the increase of coupling among multi-energy systems, some scholars also try to increase the wind power consumption capacity from the perspective of integrated energy (Wang and Li., 2017; Mu et al., 2019; Ma et al., 2020). There are different methods to improve the consumption capacity. However, how to evaluate the wind power quickly and accurately is the precondition for achieving reasonable dispatching decision and planning. Only on the basis of accurate assessment of the consumption capacity, can those methods be more meaningful.
So far, most of the studies use mathematical optimization models to evaluate the wind power consumption capacity (Chen et al., 2017; Koutroumpezis and Safigianni., 2010; Xie, et al., 2016; Wang, et al., 2018; Wang et al., 2020). Usually, many kinds of security operation constraints (Abad et al., 2018; Fu et al., 2018; Torquato et al., 2018; Zhan and Liu., 2019) are considered and different optimization algorithms are used to obtain the optimal solution of the objective function. In (Nguyen and Mitra, 2016), the influence of wind power generation on frequency regulation ability under different penetration levels is explored. In (Sun et al., 2018), a multi-objective optimization method for power system coordination is established, which can be applied to evaluate the wind power consumption capacity. In (Xie et al., 2016), a wind power consumption optimization model with security constraints and flexible demand response is established. Xu et al. (Xu et al., 2016) calculated the wind power consumption capacity based on the multi-scenario method in which a variety of constraints were considered. In (Fu et al., 2018), the system peak shaving capacity constraints were considered, and the optimization model is established based on the statistical characteristics of wind power output. The mathematical optimization method is complex in modeling, with a large amount of calculation and limited application. In addition, most of the evaluation models in the above studies are for a certain moment, only considering the power grid’s consumption capacity at the extreme moment, but the wind power output also has strong volatility in other times. Therefore, the fluctuation characteristics of wind power in the whole period should be considered in the evaluation model.
On the basis of these studies, it is necessary to analyze the fluctuation characteristics of wind power from a long time scale, so as to improve the accuracy and adaptability of the assessment. Yang et al. (Yang et al., 2017) proposed an analysis method to divide and express the fluctuation process of wind power, but did not carry out quantitative analysis on the volatility of wind power. For the study of volatility, in (Shi et al., 2018), the fluctuation of wind power output data are analyzed by the probability density function (PDF) and discrete Fourier transform (DFT) in time and frequency domain. In (Zhang et al., 2017), fluctuating characters of the wind power are assumed to obey the versatile distribution. In (Lamsal et al., 2019; Li et al., 2019), the variation of the difference between the maximum and minimum power values within a certain time interval is used to describe the volatility of wind power.
Since the fluctuation of wind power varies with time, the fluctuation characteristics of wind power at different levels should be described by appropriate parameters. Multi-fractal theory (Harte and David, 2001) is an effective tool for studying the fluctuation characteristics of stochastic time series, and has been applied in many fields of power system. In (Teng et al., 2019), a multi-fractal spectrum is adopted to investigate wind speed characterizations. Liu et al. (Liu et al., 2014) examined the feasibility of applying the multi-fractal theory to analyse the electricity price fluctuation.
Thus, an evaluation method of wind power consumption capacity based on fluctuation characteristics analysis is carried out. Firstly, the singularity index of multi-fractal theory is adopted to describe the fluctuation characteristics of wind power. The matching degree between wind power and load curve is represented by the average Euclidean distance. The correlation between fluctuation parameters, average Euclidean distance and wind power consumption is verified based on historical data. On this basis, the fluctuation process is divided and clustered by the swinging door algorithm (SDA) and clustering algorithm, respectively. Finally, an evaluation model is established based on the fluctuation parameters. The method combines the fluctuation processes with the same fluctuation characteristics, greatly simplifies the calculation process. The consumption capacity of the power grid to a given wind power curve is analyzed, which is helpful for dispatchers to make reasonable decisions.
Key Influencing Factors
Fluctuation Degree of Wind Power Output
Multi-Fractal Theory
Multi-fractal is a kind of complex fractal structure which divides the non-uniform distribution area into multiple regions. It is composed of multiple non-uniform distribution sets with different singular indexes. The local characteristics of a system with complex fractals under different scales were described. Each scale can be represented by different parameters or dimensions. This series of parameters form a set, so that all different sets have different scales and fractal dimensions. Generally, the problems with fractal characteristics are described qualitatively and quantitatively by multi-fractal spectrum. The numerical value of each local detail and the probability distribution in the process of local detail change are calculated by Legendre transform.
The multi-fractal object is divided into
When
where
Fluctuation Degree
Based on multi-fractal theory, the local regularity of wind power output curve on different time scales is described by the singularity index. Wind power series
Here,
The singularity of wind power fluctuation in the
Since
Matching Degree of Wind Power Output and Load Demand
The consumption capacity is closely related to the fluctuation of the wind power curve if the unit parameters have been determined. Wind power will be curtailed if the fluctuation range of wind power exceeds the regulation capacity of the unit. However, wind power may fluctuate greatly at both high and low output, a single fluctuation parameter can not accurately reflect the wind power consumption capacity. The matching degree of wind power output and load demand is also a key factor, which is measured by the similarity between load and wind power curve. The higher the similarity, the greater the wind power consumption. To compare the wave processes of different time scales, the average value of Euclidean distance of all data points is reflected to the matching degree. The calculation formula is as follows:
Here,
Analysis on Fluctuation Characteristics of Wind Power Consumption
Correlation Analysis
Taking the data of a district in China in August 2019 as an example, the correlation between wind power consumption capacity and fluctuation characteristics is qualitatively analyzed by Pearson correlation coefficient (PCC). PCC is the most commonly used method to measure the correlation of series, and has many application examples in wind power output prediction (Vallée et al., 2011; Zhou et al., 2019; Wang and Zou, 2020). The correlation between any two variable sequences x and y can be calculated by Eq. 7.
where
Figure 1 shows the calculation results of correlation analysis. With correlation coefficient
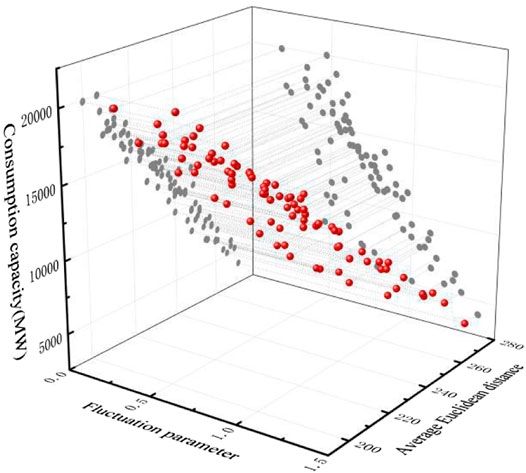
FIGURE 1. Correlation between volatility parameters, average Euclidean distance and wind power consumption.
Division of Fluctuation Process
The division of fluctuation process is the basis of studying the fluctuation characteristics of wind power output. The swinging door algorithm (SDA) proposed in (Florita et al., 2013) is applied to divide the fluctuation process. The principle is as follows:
Here,
According to the principle of swinging door algorithm, the next fluctuation process starts from
The fluctuation trend before and after the termination point should be judged in the iterative process. That is, when each iteration process of fluctuation division is completed, it is necessary to judge the relationship between the change trend of the two fluctuation processes connected with the termination point. The termination condition of iteration division is changed from Eqs. 9, 10:
where
In Eq. 8, the window width
Clustering of Fluctuation Processes
The consumption capacity is significantly associated with volatility parameters and average Euclidean distance. The fluctuation process of wind power is clustered based on
A clustering algorithm with breadth first search neighbors (BF-SN) (Xue et al., 2015) is applied to cluster the fluctuation process. It is not needed to determine the number of clusters in advance in the algorithm, and the optimal parameters are easy to set. The steps are as follows:
(1) Input fluctuation process set, and
(2) Input the clustering parameters
(3) Solve the similarity matrix. The similarity degree matrix is a quantitative representation of the similarity of any two fluctuation processes. Its diagonal elements are 1, and the non diagonal elements
(4) Search clustering. A new empty class is created and classified into this class from any fluctuation process
(5) Repeat step 4)to complete the clustering of all fluctuation processes.
Evalution Model
Wind Power Output Model
According to Eqs. 3, 4, there is a one-to-one correspondence between wind power output
The functional relationship reflects the irregularity and distribution characteristics of wind power in the process of fluctuation.
Functional Analysis Model
State Space
The state of the system is judged according to the basic properties of the
where
The constraints are considered in the state space as follows:
Power Balance Constraints
Power Output Constraints
Power Ramp Constraints
Tie Line Power Constraints
where
The proposed evaluation method is mainly used to calculate the wind power that the system can consume. If the system does not meet the power balance constraints, there may be two situations: excess power and power shortage. The former will lead to wind power being abandoned, and in the latter case, the system can consume all the wind power. However, the system will load shedding when the load demand can not be met. If the system satisfies the power balance constraints, y1 will be 0; if the power is excessive, y1 is one; if the power is insufficient, y1 is –1.
Evaluation Model
For each kind of fluctuation process, a functional analysis model of consumption capacity evaluation is established according to the state set.
Here,
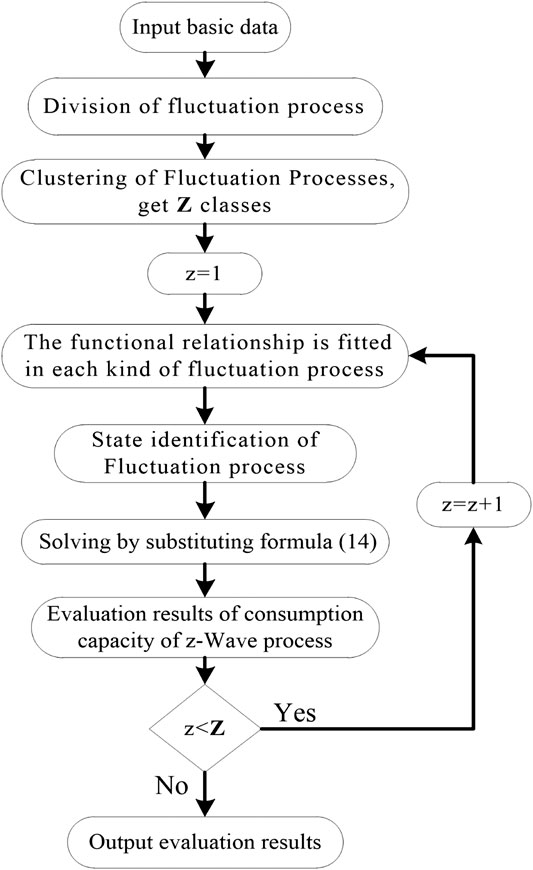
FIGURE 2. Flow chart of wind power consumption capacity assessment.
Case Study
The effectiveness of the proposed method is verified by the actual power grid data. The grid structure is shown in Figure 3. There are three wind farms in the system with a total installed capacity of 350 MW, five thermal power units and the total installed capacity is 786 MW. The parameters of each generator set are shown in Table 1. Assuming that all units are in the starting state, the upper limit of tie line power is 50 MW. Load and wind power output curve are shown in Figure 4.
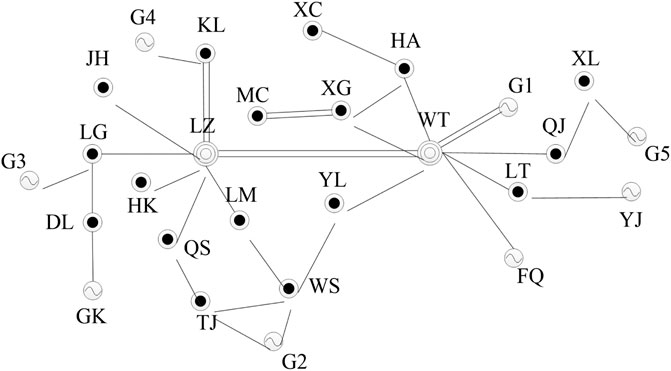
FIGURE 3. Grid structure diagram.
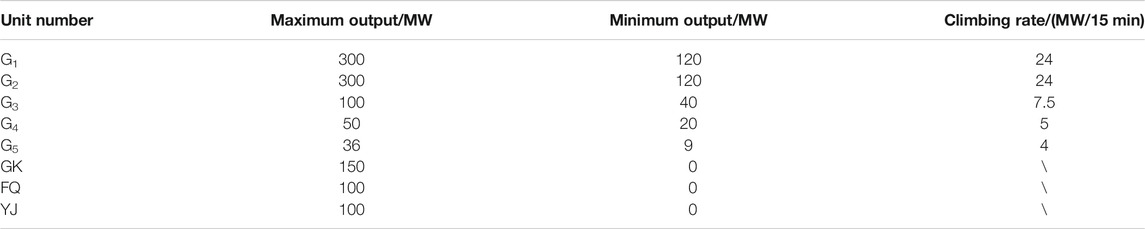
TABLE 1. General parameters of generator set.
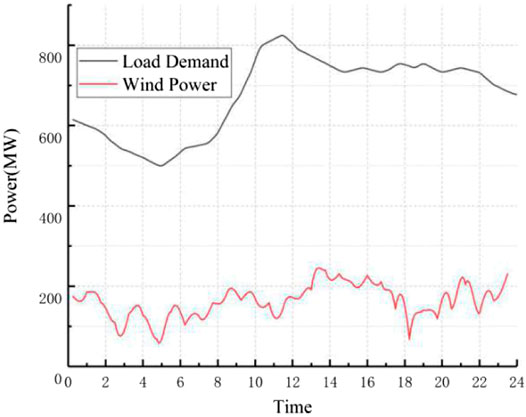
FIGURE 4. Load curve and wind power output curve.
Division and Clustering of Fluctuation Processes
The fluctuation process of wind power is divided by SDA. Window width ε is taken as 5% of the installed capacity of wind power. A total of 41 fluctuation processes are obtained and numbered from left to right. The results of division are shown in Figure 5.
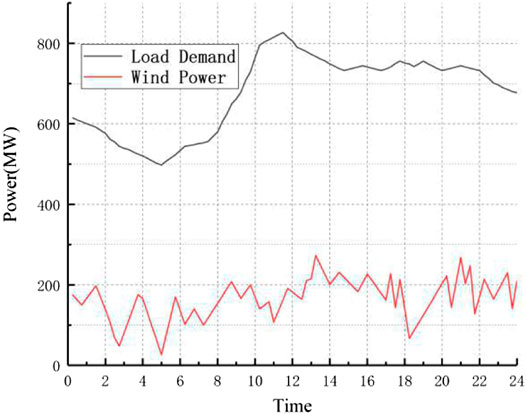
FIGURE 5. Division results of fluctuation process.
The volatility parameter
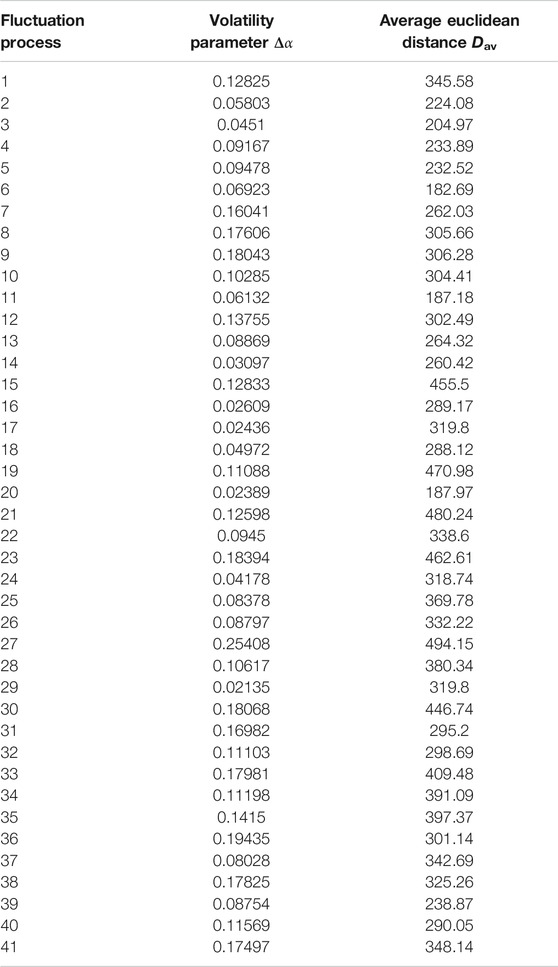
TABLE 2. Clustering parameters.
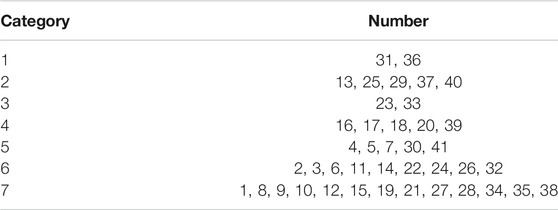
TABLE 3. Clustering results of fluctuation process.
Calculation of Consumption Capacity
Function relationship between the wind power and singularity index in various wave stages is fitted. The wind power fitting function of 7 categories is replaced into the evaluation model, and the consumption capacity in the evaluation period is obtained. Take category 5 as an example to illustrate the calculation process. The results are shown in Figure 6.
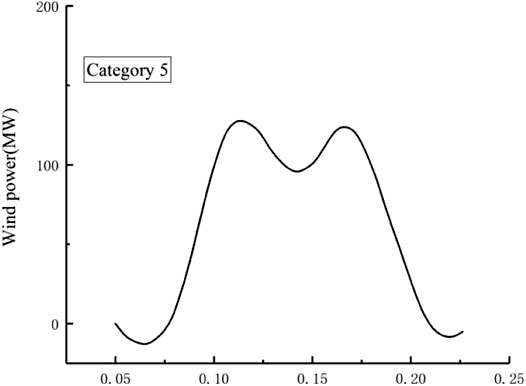
FIGURE 6. Fitting results of wind power and singularity parameter.
The state of this kind of fluctuation is Y5 = {1, 0, 1, 0} according to the basic data of each fluctuation process in Category 5. The power consumption is 253 MW·h, and the abandoned wind power is 64 MW·h. Similarly, the wind power consumption capacity of the whole grid is calculated.
To show the effectiveness of multi-fractal theory in describing the fluctuation degree of wind power, as a comparison, the volatility proposed in (Li et al., 2019) is used to describe the fluctuation degree. The method is recorded as Method 1, and the calculation formula is as follows:
where
The consumption capacity of Method 1 is evaluated by using the same evaluation procedure proposed in this paper.
In addition, the evaluation method used in (Sun et al., 2018) is recorded as Method 2. Without considering the load regulation characteristics in different time scales, the wind power consumption was evaluated with the maximum consumption capacity as the optimization objective. The results are shown in Table 4.
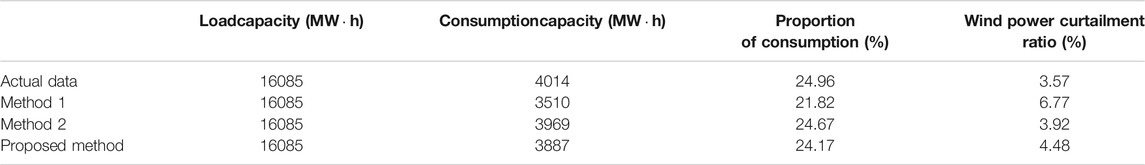
TABLE 4. Calculation results of consumption capacity.
The fluctuation degree of wind power in Method 1 is expressed by the change degree of a certain period of time, which depends on the size of the time interval used. This may lead to the irregularity of wind power fluctuations that can not be well described. By comparing Method 1 with the method proposed, the relative deviations between the results and the actual data are 12.54% and 3.16% respectively. The results show that the multi-fractal theory can reflect the fluctuation process better and make the evaluation results closer to the actual data.
The wind power consumption is calculated by the optimization problem in Method 2, the result is closest to the actual data, and the relative deviation is 1.12%. Compared with the optimization problem of long time scale, although there are errors between the proposed method and Method 2, the deviation between them is within the acceptable range of engineering application. The evaluation method proposed takes the fluctuation process as the unit for evaluation. Once the type of fluctuation process is determined, the current consumption can be evaluated according to the proposed functional model and the state space. It simplifies the calculation process of wind power energy consumption evaluation and reduces the amount of calculation, and has a wider applicability.
Analysis of Sensitive Factors of Consumption Capacity
Transmission Power Limit of Tie-Line
The results of wind power curtailment ratio of regional power grid are illustrated in Figure 7 when the output power of tie line is (0, 200) MW. If the limit of transmission power is less than 100 MW, the wind power curtailment ratio is negatively correlated with
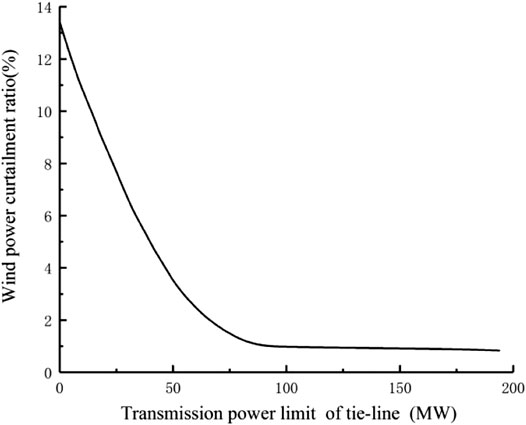
FIGURE 7. Wind power curtailment ratio with different transmission power limit of tie-line.
Peak Regulation Depth of Unit
The calculation results of wind power curtailment ratio are shown in Figure 8 when the unit peak load regulation depth is (30, 50%). The curtailment ratio is positively correlated with the peak shaving depth. If the peak shaving depth is less than 35%, the curtailment ratio does not change, the wind power transmission is blocked due to the transmission power of tie line reaching the upper limit. The influence principle of unit peak regulation depth on the consumption capacity is the same as that of tie line power upper limit, both of which can improve the maximum consumption space of wind power.
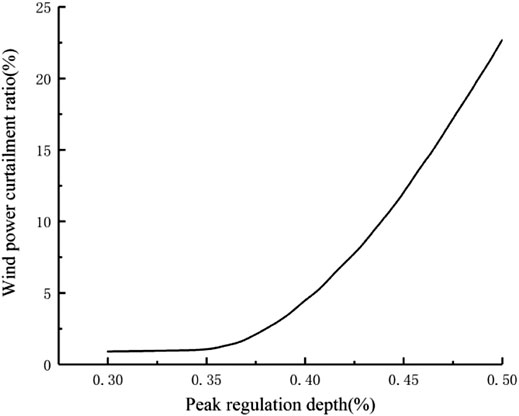
FIGURE 8. Wind power curtailment ratio with different peak regulation depth.
Conclusion
To guide the development of new energy such as wind and reduce the abandonment risk of wind, a functional analysis model of wind power consumption capacity assessment is established, which takes the singularity parameters of wind power as independent variables, and simplifies the calculation process of wind power consumption assessment. Through the analysis of an example, the correctness and effectiveness of the refined consumption model proposed are proved. Moreover, the influence of the transmission power limit of tie-line and peak regulation depth of unit on wind power consumption capacity is analyzed quantitatively. The results show that the wind curtailment rate can be reduced to a certain extent by changing these two variables. Relevant research results can provide guidance for new energy development planning and construction.
Data Availability Statement
The raw data supporting the conclusions of this article will be made available by the authors, without undue reservation.
Author Contributions
The manuscript was written through the contributions of all authors. All authors have approved the final version of the manuscript.
Conflict of Interest:
XZ was employed by the East China Electric Power Design Institute Co., Ltd, China Power Engineering Consulting Corporation.
The remaining authors declare that the research was conducted in the absence of any commercial or financial relationships that could be construed as a potential conflict of interest.
References
Abad, M. S. S., Ma, J., Zhang, D., Ahmadyar, A. S., and Marzooghi, H. (2018). Probabilistic assessment of hosting capacity in radial distribution systems. IEEE Trans. Sust. Energ. 9 (4), 1935–1947. doi:10.1109/TSTE.2018.2819201
Chen, X., Wu, W. C., Zhang, B. M., and Lin, C. H. (2107). Data-driven DG capacity assessment method for active distribution networks. IEEE Trans. Power Syst. 32 (5), 3946–3957. doi:10.1109/TPWRS.2016.2633299
Chen, Y. B., Zhang, Z., Chen, H., and Zheng, H. P. (2020). Robust UC model based on multi-band uncertainty set considering the temporal correlation of wind/load prediction errors. IET Gener, Transm. Dis. 14 (2), 180–190. doi:10.1049/iet-gtd.2019.1439
Chen, Y. B., Zhang, Z., Liu, Z. Y., Zhang, P., Ding, Q., Liu, X. Y., et al. (2019). Robust N-k CCUC model considering the fault outage probability of units and transmission lines. IET Gener, Transm. Dis. 13 (17), 3782–3791. doi:10.1049/iet-gtd.2019.0780
Florita, A., Hodge, B., and Orwig, K. (2013). “Identifying wind, solar ramping events,” in 2013 IEEE green technologies conference. Denver, CO, April 4–5, 2013 (Piscataway, NJ: IEEE), 147–152. doi:10.1109/GreenTech.2013.30
Fu, K., Jia, Y., Han, X., Xiang, Y., and Wang, P. (2018). “Study on wind power consumption capacity of power grid considering risk and unit commitment,” in IEEE Power & Energy Society General Meeting (PESGM). Portland, OR, August 5–10, 2018 (Piscataway, NJ: IEEE), 1–5. doi:10.1109/PESGM.2018.8586402
Global Energy Interconnection Development and Cooperation Organization (2020). Research on China’s ‘14th five year plan’ electric power development plan, Available at https://www.geidco.org/research/strategic/2020/2553.shtml (Accessed July 15, 2020).
Harte, , and David, (2001). Multifractals: theory and applications. Boca Raton, FL: Chapman & Hall/CRC Imprint.
Koutroumpezis, G. N., and Safigianni, A. S. (2010). Optimum allocation of the maximum possible distributed generation penetration in a distribution network. Electric Power Syst. Res. 80 (12), 1421–1427. doi:10.1016/j.epsr.2010.06.005
Lamsal, D., Sreeram, V., Mishra, Y., and Kumar, D. (2019). Smoothing control strategy of wind and photovoltaic output power fluctuation by considering the state of health of battery energy storage system. IET Renew. Power Genera. 13 (4), 578–586. doi:10.1049/iet-rpg.2018.5111
Li, L., Wang, X., Zhang, L. N., Lei, X. H., Han, S., Liu, Y. Q., et al. (2019). Quantitative evaluation method for the complementarity of wind–solar–hydro power and optimization of wind-solar ratio. Appl. Energ. 189, 2019973–2019984. doi:10.1016/j.apenergy.2018.12.059
Liu, W. J., Chung, C. Y., and Wen, F. S. (2014). Multifractal based return interval approach for short-term electricity price volatility risk estimation. Generation. Transm. Distribution, IET. 8 (9), 1550–1560. doi:10.1049/iet-gtd.2013.0680
Ma, H., Xu, F., Chen, Q., Hu, K., Chen, L., Dai, Y. H., et al. (2020). Dispatch framework of power system with heat storage facilities in combined heat and power plants for wind power accommodation. IET Renew. Power Genera. 14 (3), 335–343. doi:10.1049/iet-rpg.2019.0595
Meena, N. K., Swarnkar, A., Gupta, N., and Niazi, K. R. (2017). Optimal accommodation and management of high renewable penetration in distribution systems. J. Eng. 2017 (13), 1–7. doi:10.1049/joe.2017.0659
Mu, Y. Q., Wang, C. S., Kang, G. Y., Wang, Z., Jiang, T., Li, J. F., et al. (2019). Research on sensitivity analysis of wind power consumption capability of integrated energy system based on unified optimal power flow model. J. Eng. 2019 (12), 8471–8476. doi:10.1049/joe.2019.0772
Nguyen, N., and Mitra, J. (2016). An analysis of the effects and dependency of wind power penetration on system frequency regulation. IEEE Trans. Sust. Energ. 7 (1), 354–363. doi:10.1109/TSTE.2015.2496970
Qazi, A., Hussain, F., Rahim, N. A. B. D., Hardaker, G., Alghazzawi, D., Shaban, K., et al. (2019). Towards sustainable energy: a systematic review of renewable energy sources, technologies, and public opinions. IEEE Access 9, 63837–63851. doi:10.1109/ACCESS.2019.2906402
Shi, J., Lee, W. J., and Liu, X. F. (2018). Generation scheduling optimization of wind-energy storage system based on wind power output fluctuation features. IEEE Trans. Industry Appl. 54 (1), 10–17. doi:10.1109/TIA.2017.2754978
Sun, F., Li, S. H., Ge, Y. Y., Fu, Y., Xie, C. J., Zhao, Q. S., et al. (2018). “Multi-objective optimization method for source-source coordination of power system considering wind power consumption” in 3rd international conference on smart city and systems engineering, Xiamen, China, December 29–30, 2018 (Piscataway, NJ: IEEE). doi:10.1109/ICSCSE.2018.00097
Teng, J., Zhao, X., Qian, M., Men, Y., Yu, Z., and Hou, Y. (2019). “Short-term wind power forecasting based on variable time window and feature extraction” in IEEE Sustainable Power and Energy Conference, Beijing, China, November 21–23, 2019. doi:10.1109/iSPEC48194.2019.8974948
Torquato, R., Salles, D., Oriente Pereira, C., Magalhaes Meira, P. C., and Freitas, W. (2018). A comprehensive assessment of PV hosting capacity on low-voltage distribution systems. IEEE Trans. Power Deliv. 33 (2), 1002–1012. doi:10.1109/TPWRD.2018.2798707
Vallée, F., Brunieau, G., Pirlot, M., Deblecker, O., and Lobry, J. (2011). Optimal wind clustering methodology for adequacy evaluation in system generation studies using nonsequential Monte Carlo simulation. IEEE Trans. Power Syst. 26 (4), 2173–2184. doi:10.1109/TPWRS.2011.2138726
Wang, C., Gong, Z., Liang, Y., Wei, W., and Bi, T. (2020). Data-driven wind generation admissibility assessment of integrated electric-heat systems: a dynamic convex hull-based approach. IEEE Trans. Smart Grid 11 (5), 4531–4543. doi:10.1109/TSG.2020.2993023
Wang, G., Liu, Y., Chen, D., Yang, Z., Geng, H., Li, H., et al. (2018). “Basics non-time series production scale semantic wind power consumption evaluation method,” in 3rd international conference on Smart city and systems engineering. Xiamen, China, 6 May, 2019. doi:10.1109/ICSCSE.2018.00090
Wang, H. T., and Zou, B. (2020). Probabilistic computational model for correlated wind speed, solar irradiation, and load using bayesian network. IEEE Access 8, 51653–51663. doi:10.1109/ACCESS.2020.2977727
Wang, X. D., and Li, H. (2017). Multi-objectives combined electric heating dispatch model of wind power accommodation with heat storage device. J. Eng. 2017 (13), 1539–1545. doi:10.1049/joe.2017.0589
Wu, X. S., and Jiang, Y. W. (2019). Source-network-storage joint planning considering energy storage systems and wind power integration. IEEE Access 7, 137330–137343. doi:10.1109/ACCESS.2019.2942134
Xie, J., Wang, K., Feng, D. H., Zeng, D., Li, Y. P., and Yue, D. (2016). A security-constrained flexible demand scheduling strategy for wind power accommodation. Int. Trans. Electr. Energ. Syst. 26 (6), 1171–1183. doi:10.1002/etep.2123
Xu, Q. Y., Kang, C. Q., Zhang, N., Ding, Y., Xia, Q., Sun, R. F., et al. (2016). A probabilistic method for determining grid-accommodable wind power capacity based on multiscenario system operation simulation. IEEE Trans. Smart Grid 7 (1), 400–409. doi:10.1109/TSG.2014.2381271
Xue, Y., Sun, X. D., and Zhang, S. (2015). Modulation classification of communication signals based on broad first search neighbors clustering. Telecommunication Eng. 55 (1), 13–16. doi:10.3969/j.issn.1001-893x.2015.01.003
Yang, S., Li, C., Li, X. F., Huang, Y. H., Liu, C., and Wang, W. S. (2017). Wind power fluctuation characteristics of Three North regions based on clustering algorithm. J. Eng. 2017 (13), 2266–2270. doi:10.1049/joe.2017.0734
Zhan, X. Y., and Liu, C. (2019). Accommodation capability assessment of high-voltage direct current with a large-scale wind power integration system based on risk constraints of sub-synchronous oscillation. J. Eng. 2019 (16), 2131–2136. doi:10.1049/joe.2018.8710
Zhang, X. S., Yuan, Y., Hua, L., Cao, Y., and Qian, K. J. (2017). On generation schedule tracking of wind farms with battery energy storage systems. IEEE Trans. Sust. Energ. 8 (1), 341–353. doi:10.1109/TSTE.2016.2598823
Zhang, Z., Chen, Y. B., Liu, X. Y., and Wang, W. R. (2019a). Two-stage robust security-constrained unit commitment model considering time autocorrelation of wind/load prediction error and outage contingency probability of units. IEEE Access 7, 25398–25408. doi:10.1109/ACCESS.2019.2900254
Zhang, Z., Chen, Y. B., Ma, J., Liu, X. Y., and Wang, W. R. (2019b). Two-stage robust security constrained unit commitment considering the spatiotemporal correlation of uncertainty prediction error. IEEE Access 7, 22891–22901. doi:10.1109/ACCESS.2019.2895625
Keywords: multi-fractal theory, division of fluctuation process, fluctuation clustering, functional analysis model, wind power consumption
Citation: Li H, Wang Y, Zhang X and Fu G (2021) Evaluation Method of Wind Power Consumption Capacity Based on Multi-Fractal Theory. Front. Energy Res. 9:634551. doi: 10.3389/fenrg.2021.634551
Received: 28 November 2020; Accepted: 01 February 2021;
Published: 23 March 2021.
Edited by:
Peng Li, Tianjin University, ChinaReviewed by:
Yue Zhou, Cardiff University, United KingdomYanbo Chen, North China Electric Power University, China
Copyright © 2021 Li, Wang, Zhang and Fu. This is an open-access article distributed under the terms of the Creative Commons Attribution License (CC BY). The use, distribution or reproduction in other forums is permitted, provided the original author(s) and the copyright owner(s) are credited and that the original publication in this journal is cited, in accordance with accepted academic practice. No use, distribution or reproduction is permitted which does not comply with these terms.
*Correspondence: Yao Wang, aHVzaG5vd3lAMTYzLmNvbQ==