 Meng Wang1†
 Lei Feng
 Jianing Chen
 Wendong Wei
95% of researchers rate our articles as excellent or good
Learn more about the work of our research integrity team to safeguard the quality of each article we publish.
Find out more
ORIGINAL RESEARCH article
Front. Energy Res. , 30 June 2021
Sec. Sustainable Energy Systems
Volume 9 - 2021 | https://doi.org/10.3389/fenrg.2021.627149
This article is part of the Research Topic Sustainable Energy Production and Consumption: System Accounting, Integrated Management, Policy Responses View all 10 articles
Xinjiang production and Construction Corps (XPCC) is an important provincial administration in China and vigorously promotes the construction of industrialization. However, there has been little research on its emissions. This study first established the 1998-2018 XPCC subsectoral carbon emission inventory based on the Intergovernmental Panel on Climate Change (IPCC) carbon emission inventory method and adopted the logarithmic mean Divisia indexmethod (LMDI) model to analyze the driving factors. The results revealed that from 1998 to 2018, the total carbon emissions in the XPCC increased from 6.11 Mt CO2 in 1998 to 115.71 Mt CO2 in 2018. For the energy structure, raw coal, coke and industrial processes were the main contributors to carbon emissions. For industrial structure, the main emission sectors were the production and supply of electric power, steam and hot water, petroleum processing and coking, raw chemical materials and chemical products, and smelting and pressing of nonferrous metals. In addition, the economic effect was the leading factor promoting the growth of the corps carbon emissions, followed by technical and population effects. The energy structure effect was the only factor yielding a low emission reduction degree. This research provides policy recommendations for the XPCC to formulate effective carbon emission reduction measures, which is conducive to the construction of a low-carbon society. Moreover, it is of guiding significance for the development of carbon emission reduction actions for the enterprises under the corps and provides a reference value for other provincial regions.
Carbon emissions are the most important factor causing climate change Liu et al. (2019), Wang et al. (2020), and the burning of fossil fuels and industrial processes are the main sources of global carbon emissions (Habert et al., 2020; Zhang et al., 2020; Wang et al., 2021). As the world’s largest carbon emitter Janssens-Maenhout et al. (2019), Yang et al. (2020), the Chinese government proposed its nationally determined contribution target in the Paris Agreement signed in 2016 Zhang (2017) and promised to reach peak carbon emissions by 2030, while the carbon emissions per unit of the gross domestic product (GDP) in 2030 would be reduced by 60–65% based on the rate in 2005. To achieve this goal, China has implemented many active countermeasures Shan et al. (2020), including starting the construction of a national carbon emission trading market in 2017 Weng and Xu (2018) and enshrining ecological civilization in the constitution in 2018, which provided an impetus and guarantee for ecological and environmental legal system construction in China (Li et al., 2019). Although China achieved the goal of reducing its carbon emission intensity by 40–45% in 2005 Liu et al. (2017), future emission reduction efforts still face many challenges (Luo et al., 2020; Wang et al., 2021).
Regional carbon emission accounting is the basis for the allocation of emission reduction responsibilities, definition of emission reduction targets, and measurement of emission reduction results (Franzen and Mader, 2018; Wei et al., 2020b). At present, many scholars have performed carbon emission accounting work at municipal Cai et al. (2019), provincial Liu et al. (2016) or national CO2 emission levels (Davis and Caldeira, 2010; Zhang et al., 2020; Wei et al., 2020c). Furthermore, the Tapio model Wang and Jiang (2019), Wang and Su (2019) and the two-layer logarithmic mean Divisia index (LMDI) Jiang et al. (2017), Gu et al. (2019), Wang et al. (2019) decomposition method have been applied to analyze the decoupling relationship Wei et al. (2020a) and influencing factors of energy consumption-related carbon emissions (Xie et al., 2019). However, as the regions of which are distributed in the administrative regions of Xinjiang are relatively scattered, the existing carbon emission accounting research has neglected a distinct administrative area called the Xinjiang Production and Construction Corps (XPCC) McMillen (1981), which has led to carbon emission accounting gaps regarding the XPCC.
The XPCC was established in 1954 and is an extremely unique provincial administration in China. The corps integrates agriculture, industry, transportation, construction, and commerce (Guo, 2015). It plays an important role in developing border affairs and maintaining unity, especially in regard to the economic aspect, and it has also made irreplaceable contributions to the development of China (McMillen, 1981). By 2018, the XPCC GDP reached RMB 25.15 million. The XPCC now contains a population of more than 3.1 million people, and it has an extensive area covering 70,600 square kilometers. In 2018, the carbon emissions in the XPCC amounted to 115 Mt, equivalent to that in Venezuela (123.7 Mt), which ranked 38th in the world in terms of carbon emissions. The carbon emissions per capita of the XPCC reached 37.3 t, which followed that of the United Arab Emirates (38.8 t) and exceeded that of Kuwait (35.0 t) (BP, 2019). Therefore, all the above evidence demonstrate that the carbon emissions in the XPCC administrative area have a nonnegligible contribution to the carbon emissions in China. Starting by processing agricultural and sideline products on the basis of developing agriculture, the Corps developed modern industry and gradually formed a multisector industrial system with light and textile industries as the main part and supplemented by iron and steel, coal, building materials, electricity, chemicals and machinery industries. Therefore (The State Council Information Office of the People’s Republic of China, 2014), it is of great research importance to establish a separate carbon emission inventory of the corps to calculate and analyze its carbon emissions, further analyze the carbon emission trend in the administrative area of the XPCC and examine the factors affecting its carbon emission changes for the corps to respond to the national call to achieve the set emission reduction targets as soon as possible.
This study bridges the gaps in carbon emission accounting in regard to the XPCC. First, we compile the 1998-2018 carbon emission inventory of the XPCC by applying the Intergovernmental Panel on Climate Change (IPCC) carbon emission inventory method and analyze the change trends of various carbon emission indicators in the XPCC, such as the total carbon emissions, per capita emissions, and carbon emission intensity. Then, we adopt the LMDI model to decompose the carbon emissions of energy consumption and examine the contribution of the influencing factors of carbon emissions. This study provides an important scientific basis for research on the green development of the regional economy and low-carbon energy development strategies and aims to provide directions and policy recommendations for the XPCC to establish effective carbon emission reduction policies and build a low-carbon society. It is of guiding importance for the development of carbon emission reduction measures for enterprises under the jurisdiction of the corps and provides a reference value for other provincial regions.
The calculation method of the carbon emission inventory in this study is based on the approach provided by the IPCC for the calculation of greenhouse gas emissions. Our carbon emission inventory is constructed in two parts: energy-related carbon emissions and industrial process-related carbon emissions.
Energy-related carbon emissions represent the carbon emitted during the burning of fossil fuels. We adopt a sectoral method to calculate the carbon emissions by determining the emissions in various sectors due to fossil fuel combustion (Shan et al., 2018). The type of fossil fuel is represented by i, and each department is represented by j. The carbon emission accounting Eq. 1 is expressed as follows:
where
The following assumptions are made in the calculations in this paper: 1) The total energy consumption is represented by the energy consumption of the industrial enterprises above a designated size. 2) The fuel and energy losses during transportation are negligible. 3) In the calculation, only the carbon emissions within the boundaries of the administrative region of the XPCC are considered, and the emissions caused by the consumption of imported electricity and heat energy from outside the boundaries are not included. 4) It is assumed that the emission factor of the same fuel remains constant under the different combustion conditions in the various sectors.
Due to the lack of XPCC energy consumption data for farming, forestry, animal husbandry and fishery, construction, and wholesale, retail trade and catering services, we apply the method of multiplying the industrial output value by the carbon emission factor of the industry to calculate its emissions (the calculation method is expressed in Eq. 2, and the following assumptions are made for the calculation of the carbon emission factors of the above three industries: 1) The output value of the three industries of agriculture, forestry, animal husbandry & fishery; construction; and wholesale, retail trade & catering services in the XPCC is assumed. The carbon emission ratio of the industry, i.e., the carbon emission factor, is consistent with that of Xinjiang. 2) The energy consumption ratios of the three major industries of farming, forestry, animal husbandry & fishery; construction; and wholesale, retail trade & catering services are assumed to be consistent with those of Xinjiang. 3) The energy consumption ratios of the three major industries in Xinjiang of farming, forestry, animal husbandry and fishery, construction, and wholesale, retail trade and catering services are assumed to remain basically unchanged from 1998 to 2018.
The calculation methods for the carbon emissions of farming, forestry, animal husbandry and fishery, construction, and wholesale, retail trade and catering services are as follows:
where
Process-related carbon emissions refer to the carbon produced by physical and chemical reactions during the production process. Since the carbon emissions generated during cement production in China account for approximately 75% of the total industrial process-related carbon emissions, we assume that the ratio of the carbon emissions from the industrial processes related to cement production to the total industrial carbon emissions in the XPCC is consistent with that in China. Therefore, we only need to calculate the carbon emissions from the cement production process and multiply it with a proportional coefficient to obtain the industrial process-related carbon emissions in the XPCC. The calculation Eq. 3 is as follows:
where
A decomposition model is established to analyze the driving factors of the changes in the carbon emissions in the XPCC from 1998 to 2018 based on the LMDI approach (B.W. Ang, 2015), and the following decomposition model is established:
where CO2 is the carbon emissions, PE is the total energy consumption, GDP is the gross domestic product, and POP is the total population.
The carbon emission change decomposition in the XPCC over a year is given by:
where
According to the LMDI method, the general equation for the carbon emission changes in the XPCC is described by the additive decomposition method as:
where
where T and t are the previous and base years, respectively. Let
In this study, the subsectoral fossil fuel consumption and cement production of the XPCC, as well as the output values of farming, forestry, animal husbandry and fishery, construction, and wholesale, retail trade and catering services, are obtained from the 1998-2018 Statistical Yearbook of the Xinjiang Production and Construction Corps (Statistical Bureau of Xinjiang production and Construction Corps scoNBos, 1998-2018). The data on the net calorific value, oxidation efficiency and carbon content of the various fuels originate from the research of (Shan et al., 2018).
The administrative area of the XPCC is located in the Xinjiang Uyghur Autonomous Region, and the XPCC is under the dual jurisdiction of the Chinese Central Government and the Xinjiang Uyghur Autonomous Region Government. The corps and the autonomous region exhibit similar industrial structures and resource types. Therefore, this study analyzes the temporal evolution characteristics of crop carbon emissions by comparing them to those in the Xinjiang Uyghur Autonomous Region.
As shown in Figure 1A and Supplementary Table SA1, from 1998 to 2018, the total carbon emissions in the XPCC increased approximately 18 times (from 6.11 Mt CO2 in 1998 to 115.71 Mt CO2 in 2018). The total carbon emissions in the XPCC slowly increased from 1998 to 2008 (the average annual growth rate of the total carbon emissions from 1998 to 2008 was 11.77%) and even declined in 2001, decreasing to 5.48 Mt CO2, which was the lowest value in twenty years. Similar to the XPCC, the lowest value of the carbon emissions in Xinjiang during this period also occurred in 2001, at 53.50 Mt CO2 (Shan et al., 2018; Shan et al., 2020). During the period from 2008 to 2015, the XPCC total carbon emissions increased at a fast pace, and the average growth rate increased to 28.81%. The last period is from 2015 to 2018, and in contrast to the continued rapid growth of Xinjiang, the carbon emissions in the XPCC suddenly transitioned from rapid growth to slow growth after a turning point was reached in 2015, and the average annual growth rate of the corps carbon emissions also decreased from 28.81% to 1.89%.
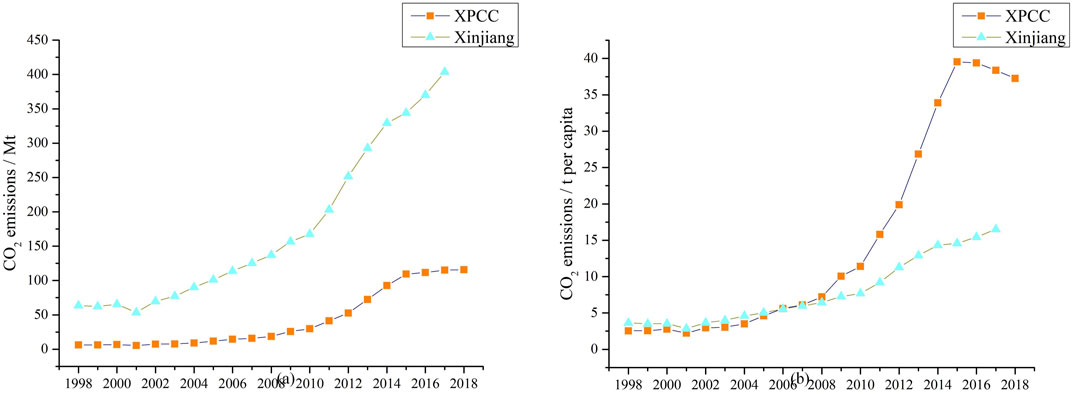
FIGURE 1. The carbon emissions in XPCC and Xinjiang from 1998 to 2018 (A) Change in trend of the total carbon emissions in XPCC and Xinjiang from 1998 to 2018, (B) change in trend of the carbon emissions per capita share of the XPCC and Xinjiang from 1998 to 2018.
Figure 1B and Supplementary Table SA2 shows the change in trend of the per capita carbon emissions in XPCC and Xinjiang from 1998 to 2018. Figure 1B reveals that from 1998 to 2008, the per capita carbon emissions and growth trend in the XPCC were basically consistent with those in the Xinjiang region (Shan et al., 2018). However, from 2008 to 2018, there was a substantial difference in the per capita share of the two regions. After 2008, the per capita share of the carbon emissions in Xinjiang was the same as that from 1998 to 2008, and it exhibited a gradual growth trend (Shan et al., 2020). The growth remained very stable without major fluctuations. However, the XPCC experienced two periods of change, namely, the rapid growth stage from 2008 to 2015 and the decline stage from 2015 to 2018, while the population of the corps maintained slow and balanced growth during the observation period from 1998 to 2018. Therefore, in the XPCC, the per capita share of the carbon emissions was basically consistent with the change in trend of the total carbon emissions, and the per capita share amplified the effect of the changes in the XPCC carbon emission trend.
In addition, we also analyze and compare the carbon emission intensity and trend in the XPCC and Xinjiang from 1998 to 2018 (as shown in Figure 2 and Supplementary Table SA3). The change in trend of the XPCC carbon emission intensity from 1998 to 2018 can also be divided into three stages, namely, 1998-2001 showed a downward trend, 2001-2015 exhibited an overall upward trend, and 2015-2018 revealed a downward trend, with normal fluctuations within a small range during this period.
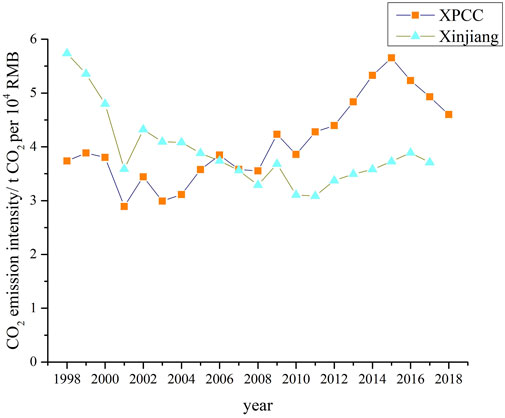
FIGURE 2. The change in the carbon emission intensity of XPCC and Xinjiang from 1998 to 2018.
The XPCC carbon emission inventory was constructed in two parts: energy- and process-related (cement) carbon emissions. When calculating the fossil energy-related carbon emissions in the XPCC, this paper applied a fossil fuel classification that was consistent with that of the China Emission Accounts and Datasets (CEADs) carbon emission inventory Shan et al. (2017), including raw coal, washed coal, other washed coal, briquettes, coke, coke oven gas, other gases, other coking products, crude oil, gasoline, diesel, kerosene, fuel oil, liquefied natural gas, refinery gas, other petroleum products, and natural gas, for a total of 17 kinds of fossil fuels. And the industrial process-related carbon emissions largely originated from the cement production process. We calculated the percentage of the total carbon emissions resulting from the consumption of the various energy sources (including the carbon emissions related to industrial processes) in the XPCC from 1998 to 2018 (Figure 3). The results reveal that raw coal (689.27 Mt CO2) is always the largest contributor to carbon emissions, accounting for the majority of the total carbon emissions at 78.68%, and the proportion of its energy emissions has steadily increased. However, the growth rate of its carbon emissions slightly decreased after 2015. Coke (55.54 Mt CO2) and washed coal (17.10 Mt CO2), accounting for the second and fifth highest emissions, respectively, reached their peak in 2015, changing from an increasing trend to a decreasing trend. The carbon emissions of petroleum and gasoline have gradually changed, and both have begun to exhibit a downward trend after 2016. The proportion of the carbon emissions related to industrial processes ranks third at 51.06 Mt CO2.
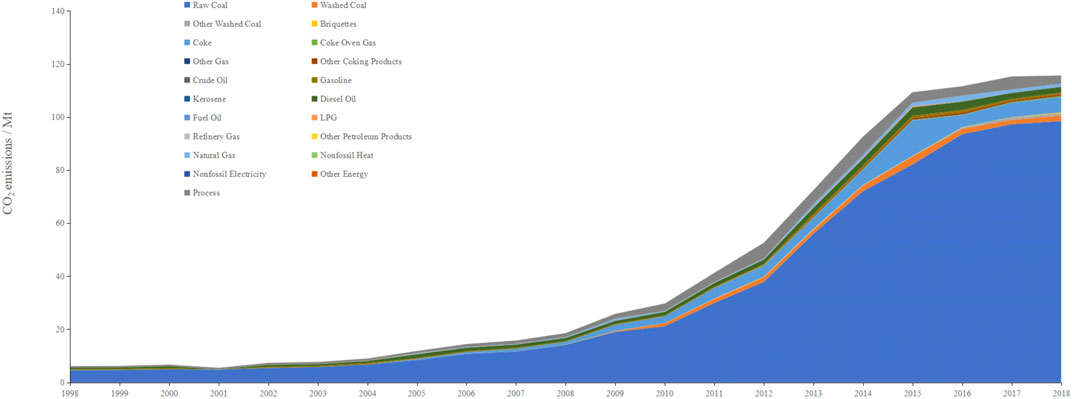
FIGURE 3. Carbon emission against energy structure in the XPCC from 1998 to 2018.
Figure 3 and Supplementary Table SA4 shows a chart of the carbon emission against energy structure in the XPCC from 1998 to 2018. We find that the change in trend of the carbon emissions from coal, accounting for the largest proportion of the total emissions, is basically consistent with the change in trend of the total carbon emissions. This indicates that the emissions produced by raw coal largely determine the change in trend of the total carbon emissions. Therefore, controlling the carbon emissions at the source should start with controlling the carbon emissions produced by raw coal.
Figure 4 and Supplementary Table SA5 shows the carbon emission against industrial structure in the XPCC from 1998 to 2018. From 1998 to 2018, the main emission sectors were the sectors of the production and supply of electric power, steam and hot water, petroleum processing and coking, raw chemical materials and chemical products, and smelting and pressing of nonferrous metals. Among these sectors, the production and supply of electric power, steam and hot water industry always contributed the most to the corps carbon emissions, and the carbon emissions generated by this industry increased year by year, reaching a maximum value in 2018 (46.81 Mt CO2). The petroleum processing and coking industry, the second largest contributor to carbon emissions, started later. It began to generate carbon emissions in 2004 and then rapidly grew, reaching a peak in 2016 (25.36 Mt CO2). The smelting and pressing of the nonferrous metals sector only started producing a notable emission effect in 2012 and then continuously exhibited a growth trend until 2018.
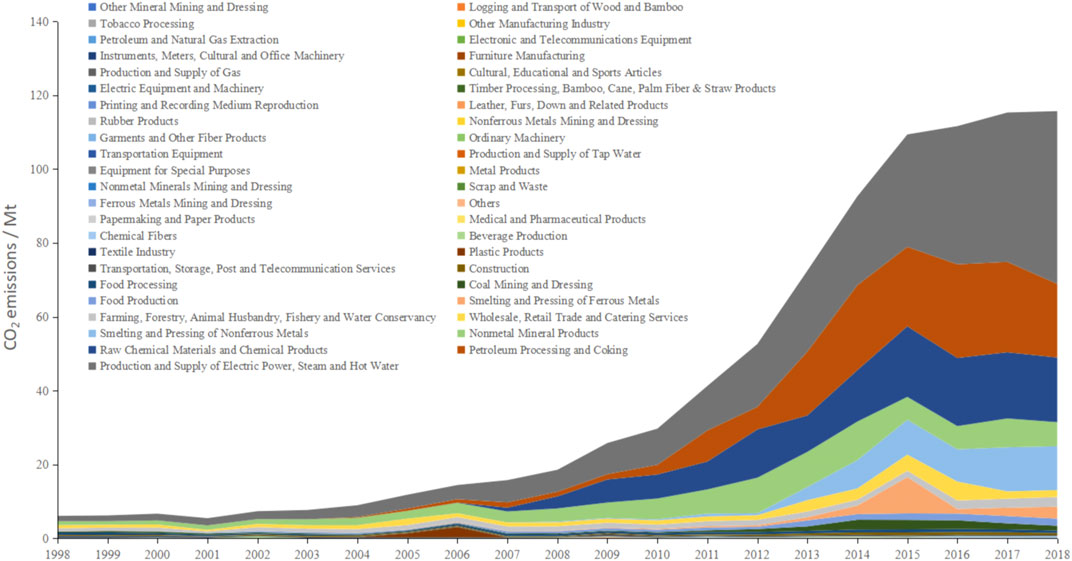
FIGURE 4. Carbon emission against industrial structure in the XPCC from 1998–2018. Driving factors of the changes in carbon emissions in the Xinjiang Production and Construction Corps.
We applied the LMDI method to calculate the individual effects of the various influencing factors of the carbon emissions in the XPCC from 1998 to 2018. The decomposition results are summarized in Figure 5 and Supplementary Table SA6. Supplementary Table SA6 indicates that the average annual growth of the total effect from 1998 to 2018 amounted to 5,479,900 tons. Moreover, the energy structure effect accounted for 159,800 tons of the emission reduction effects, which provided a contribution rate of -2.92% to the total effect. In terms of the technical effect, it yielded an increase of 1.5804 million tons, providing a 28.84% contribution rate. In terms of the economic effect, economic development produced a discharge increase effect of 3.1574 million tons, thereby yielding a contribution rate of 57.62%. In terms of the population effect, continuous population growth resulted in a total emission increase of 901,800 tons, providing a 16.46% contribution rate.
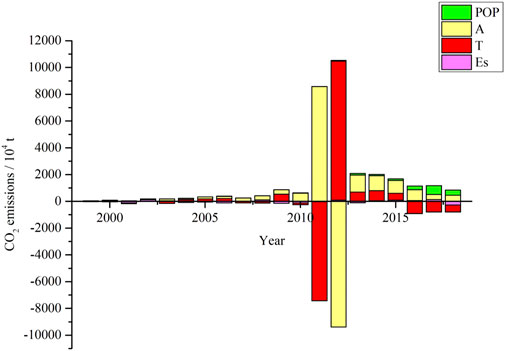
FIGURE 5. Decomposition results of the carbon emission driving factors in the XPCC. Note: POP represents the population effect, A represents the economic effect, T represents the technical effect, and ES represents the energy structure effect.
Since the central government resumed the formation of the corps at the end of 1981, the XPCC started a second venture, vigorously promoted urbanization, new-type industrialization and agricultural modernization, and continuously improved its economic development level. The total production value of the corps increased from 6.550 billion yuan in 1981 to 16.349 billion yuan in 1998 and reached 251.516 billion yuan in 2018 (Statistical Bureau of Xinjiang production and Construction Corps, 1998–2018). Economic development was accompanied by a surge in carbon emissions. Moreover, the change in trend of the total carbon emissions in the XPCC was similar to that in Xinjiang, both showing an upward trend. The average carbon emission growth rate in Xinjiang was slightly higher than the XPCC carbon emission growth rate, and the XPCC total carbon emission growth rate first increased and then decreased. In terms of the per capita carbon emissions, Xinjiang consistently showed an increasing trend, and the XPCC change trend first gradually increased, rapidly increased and then decreased. The time node of the XPCC separation time period is consistent with that of the total emissions, which intuitively reflects that the implemented environmental protection policy is of great importance to slowing down the growth of carbon emissions.
Therefore, according to the changes in the growth rate of the total carbon emissions and the growth rate of the per capita carbon emissions, we roughly divide the annual carbon emissions in the XPCC from 1998 to 2018 into the following three stages:
The first stage extended from 1998 to 2008, during which the corps total carbon emissions increased at a moderate rate of 11.77%. During this period, the carbon emission intensity in the XPCC constantly fluctuated, and 2001 was the turning point of the first stage. After 2001, with the development of thermal power, copper nickel ore, PVC and other industrial systems, the XPCC carbon emission-related fuel structure considerably shifted to a high-emission fuel-dependent fuel structure. For example, the growth rate of raw coal usage increased from −2.80% during the 2000–2001 period to 12.60% during the 2001–2002 period. Besides, the growth rate of diesel usage increased from −32.10% to 30.70% (Statistical Bureau of Xinjiang production and Construction Corps, 1998–2018). Coke generated almost no energy emissions before 2004, but its emissions gradually increased after 2004. The two major industries, namely, petroleum processing & coking industry and raw chemical materials & chemical products industry, produced the second and third highest total carbon emissions. Therefore, the reduction in the various types of high-emission sectors during this stage also led to low total emissions. According to the LMDI analysis results, during this period, only the energy structure effect yielded a reduction effect, contributing 7.78 Mt to the observed carbon reduction. The economic effect bore most of the increase in emissions, and its contribution to the total impact reached as high as 96%. From 2001 to 2005, China implemented the 10th Five-Year Plan. The Western Development Project was the strategic focus of the 10th Five-Year Plan (Yang et al., 2018). Its successful implementation greatly promoted the economic growth of the western region. This is also the main reason why the economic effect accounted for such a large proportion of the carbon emissions from 1998 to 2008 (Zhang et al., 2019). During the 10th Five-Year Plan period, the Party Central Committee proposed the strategy of establishing a scientific outlook on the development and construction of a harmonious society (Zhuo and Deng, 2020). Moreover, the 11th Five-Year Plan further strengthened environmental protection and vigorously encouraged the development of a circular economy, and it established an assessment system and an energy conservation, consumption reduction and pollution reduction system (Chen et al., 2021; Feng et al., 2021). The emission reduction effect in the XPCC during this period demonstrated the effectiveness of the above environmental protection policies. In addition, the fluctuating carbon emission intensity also revealed a balance between the effect of economic growth and the emission reduction effect of environmental protection policies (He et al., 2018).
The second stage was the period from 2008 to 2015, during which the carbon emissions exhibited a rapid growth trend, with an average annual growth rate of 28.81%. Since 2008, several major high-emission industrial sectors started showing obvious growth trends, and the types of energy generating high carbon emissions increased. Moreover, both the XPCC emission intensity and its GDP continuously increased. According to the LMDI decomposition analysis results, the XPCC energy structure effect during this period still generated emission reduction effects (21.32 Mt CO2), but the difference from the previous stage was that the technical effect during the second stage replaced the economic effect and became the main contributor promoting carbon emissions. The technical effect contributed 58.53% to the total effect, while the economic effect, as the second largest contributor, caused a 38.22% increase in emissions. This result demonstrates that the XPCC economic growth and technological backwardness between 2008 and 2015 were the main reasons for the rapid growth of its carbon emissions.
The third stage lasted from 2015 to 2018. The XPCC carbon emissions were still on the rise, but the growth rate had decreased to 1.89%. During this period, the XPCC carbon emission intensity changed in 2015, from an increasing trend to a decreasing trend. The high-emission energy and industry sectors peaked in 2015, such as coke and smelting and pressing ferrous metals. According to the LMDI analysis results, the technical effect was transformed into a reduction effect during the third stage, providing a large contribution of −354.88% to the total carbon reduction. This result was directly linked to the rapid development of science and technology during this stage, while 2015 represented the demarcation point between the latter two stages, and it was also a year when China strongly promoted environmental protection and emphasized ecological development (Fang et al., 2020). In the Paris Agreement signed in 2015, China solemnly pledged to strive to achieve the maximum total carbon emission goals by 2030 (Isabel Hilton, 2014). To achieve this emission reduction target, on January 1, 2015, a new environmental protection law, regarded as the most stringent in history, was formally implemented in China (Chang et al., 2020). In addition, the Central Committee of the Communist Party of China and the State Council issued the Overall Plan for Ecological Civilization System Reform. The first environmental protection reform involved the implementation of vertical management. XPCC also put forward specific implementation suggestions on strengthening the construction of ecological civilization, such as XPCC’s 13th Five-Year Plan for energy conservation and emission reduction. China has paid increasing attention to environmental protection and ecological development Andersson (2018), Gu et al. (2020), and governments at all levels across China have actively responded to the call. Among them, the output value growth rate of several high-emission departments of the XPCC also notably decreased. For example, the output value of the major emission sectors of smelting and pressing of ferrous metals, coal mining and dressing, smelting and pressing of nonferrous metals, raw chemical materials and chemical products, and food processing decreased 87.24%, 8.11%, 5.63%, 3.56%, and 3.02%, respectively, from 2015- 2016 (Statistical Bureau of Xinjiang production and Construction Corps, 1998–2018). The obvious decline in the growth rate of the output value of the above high-emission sectors directly indicated that the national environmental protection policy played a good role in reducing emissions in the administrative area of the XPCC. The above also demonstrates that environmental protection policies can achieve specified emission reduction targets by optimizing the energy industry structure and appropriately adjusting the development frequency of high-emission sectors.
After applying the LMDI method to decompose the influencing factors of the carbon emissions, we find that the impact of the energy structure effect of the XPCC on its carbon emissions fluctuated around zero from 1998 to 2018. The energy structure is determined by the region’s resource talent and proportion of clean energy. The coal resources in the administrative area of the XPCC are relatively abundant. However, the use of clean energy is low and not stable enough, and there is no complete utilization system, which leads to large fluctuations in the effect of the energy structure and uncertain results. Although the energy structure effect only contributes −2.92% to carbon emissions, accounting for a small share, it is feasible to realize emission reduction via energy structure improvement based on the observation and analysis results from 1998 to 2018. Much room remains for the development of the use of clean energy, which is also an important direction to optimize the energy structure in the future. The average performance of the technical effect is 1.5804 million tons, and the overall impact is an emission increase, with a large contribution to carbon emissions. This can be reduced by improving the energy use efficiency, which is an important reference factor for effective emission reduction (Wei et al., 2021). Technology is directly linked to the carbon emission intensity, which suppresses carbon emissions by improving the production capacity and equipment efficiency to achieve an effective use of energy (Chen et al., 2020). The contribution of the economic effect to emission reduction is as high as 57.62%, which is the main driving factor of the increase in carbon emissions (Dong et al., 2020). The development of a green economy makes it possible to achieve a balance between carbon emissions and economic growth, which could effectively guarantee continuous GDP growth and appropriately suppress the impact of the economic effect on carbon emissions (Qian et al., 2021). The population effect on the growth of carbon emissions remains relatively stable every year, and the contribution value is relatively low. The average value of the total effect in the carbon emission analysis over the past two decades is 5,479,900 tons, indicating that the overall effect of these four effects still promotes carbon emission growth. The main reason is that the economic effect has a large positive contribution. Therefore, future emission reduction measured in the XPCC could be implemented through the following two methods: one method is to reduce economic effect promotion, and emission reduction may be rationally planned through reducing the energy demand in economic production (Quan et al., 2020); the second approach is to increase the inhibitory effect of the energy structure, strengthen the construction of key energy-saving projects, and vigorously develop the circular economy and environmental protection industries, while much room remains for green economic development.
This study still has certain limitations. For example, although we conducted a detailed analysis of the corps carbon emissions from 1998 to 2018, the types of LMDI decomposition factors were relatively few and not sufficiently comprehensive. We did not consider the amount of carbon emissions transferred among the various XPCC industrial sectors or between the XPCC and other regions. Therefore, related follow-up research should focus on these points to further improve the accuracy and comprehensiveness.
As the only provincial administration in China under the dual leadership of the Central Government and the Xinjiang Uyghur Autonomous Region, the XPCC ran the first batch of industrial, traffic, construction and commercial enterprises in Xinjiang, laying the modern industrial foundation of Xinjiang. However, almost no previous research has focused on carbon emissions in the administrative area of the corps. Therefore, this article first compiled the carbon emission inventory of the XPCC from 1998 to 2018. The calculation method is consistent with that of the CEADs. The LMDI model is adopted to decompose the driving factors of carbon emissions in the corps. The following conclusions are drawn: From 1998 to 2018, the total carbon emissions in the XPCC exhibit an upward trend, and the growth rate of the total carbon emissions first increases and then decreases. We divide the carbon emission changes in the XPCC from 1998 to 2018 for analysis purposes: the first stage extends from 1998 to 2008, and only the energy structure effect yields a reduction effect, while the economic effect bears most of the increase in emissions. The carbon emission intensity constantly fluctuates during this stage, which reflects the mutual restriction between the economic effect of the economic growth caused by the Western Development Program on the carbon emissions and the emission reduction effects of the energy structure produced by the implemented environmental protection policies. The second stage lasts from 2008 to 2015. During this stage, the total carbon emissions rapidly increase. The technical and economic effects mainly contribute to carbon emission growth, indicating that XPCC economic growth and technological backwardness are the reasons for the rapid increase in carbon emissions. The third stage is the period from 2015 to 2018. The total carbon emissions of the corps gradually increase. The reason is that since 2015, China has increased its emission reduction efforts to development Strategy for Ecological Civilization as well as achieve the set Paris Agreement emission targets. Environmental protection policies could achieve the specified emission reduction targets by optimizing the energy industry structure and appropriately adjusting the development frequency of high-emission sectors.
The analysis in this paper clearly shows that every implementation of a national environmental protection policy imposes a major reduction effect on the carbon emissions in the XPCC. This indicates that the government departments of the XPCC demonstrate a strong ability to implement central commands. Therefore, in terms of environmental protection and emission reduction, the local government can appropriately formulate certain emission reduction policies based on local characteristics and design carbon emission reduction policies according to local conditions. Areas with power production and supply as the main sector should pay attention to the technology upgrading and emission transformation of the power sector. Areas with sector raw chemical materials and chemical products and sector lighting and pressing of nonferrous metals should pay more attention to the formulation of emission standards and pollution prevention and treatment within the sector to reduce carbon emissions from the source of emissions. It is necessary to consider the actual local basis and actual status of carbon emissions, as well as the XPCC local economic development focus. It is also vital to improve the execution capabilities of lower-level government departments in regard to the implementation of policies. The measures proposed above could effectively improve the efficiency of carbon emission reduction. Moreover, we find that in terms of the administrative region of the XPCC from 1998 to 2018, the technical effect results in the second largest increase in the total effect over the past 2 decades. This result shows that the XPCC extremely lacks carbon emission reduction technology, and it also implies that the corps has much room for technological development. In the XPCC, it is expected that the technical effect could be changed from the second largest emission increase factor to the leading emission reduction factor by achieving technological progress. The energy structure effect is the only factor achieving an emission reduction effect in the XPCC, but its emission reduction effect is insignificant. At present, the energy consumption of the corps mainly involves fossil energy based on coal. In fact, the energy structure should be appropriately optimized, such as the development of clean energy and the appropriate reduction in energy use with high carbon emission factors. We suggest that the corps shares the pressure of energy use with energy sources exhibiting a low carbon emission factor as much as possible without affecting economic development. The improvement of the energy structure is an important direction for future emission reduction. The economic effect is the leading factor of the increase in emissions. Carbon emissions are an inevitable price in the process of economic development. On the one hand, it is essential to maintain economic growth, and on the other hand, it is necessary to achieve the goal of reducing emissions. Emission reduction should not undermine economic growth. Therefore, to achieve an effective balance between economic growth and emission reduction policy implementation, the focus of economic development should be appropriately adjusted according to production and life needs to reduce carbon emissions, and emission reduction targets should be scientifically and rationally adjusted according to the actual local development conditions. In this way, the orderly advancement of emission reduction and sustained economic growth can be realized.
Publicly available datasets were analyzed in this study. This data can be found here: www.xjbt.gov.cnhttps://www.nature.com/articles/sdata2017201/.
MW: Software, Writing-Review and Editing. Methodology. Formal analysis, LF: Data curation, Writing-Original Draft, Writing-Review and Editing, Methodology, Software. PZ: Methodology, Writing-Review and Editing. GC: Writing-Review and Editing. HL: Writing-Review and Editing. JC: Methodology, Data curation. XL: Methodology, Data curation. WW: Writing-Review and Editing, Supervision, Funding acquisition.
The work was supported by the National Key R&D Program of China (2019YFC1908501), the National Natural Science Foundation of China (71904125 and 72088101), the National Natural Science Foundation of China (71803133), and the Shanghai Sailing Program (18YF1417500).
The authors declare that the research was conducted in the absence of any commercial or financial relationships that could be construed as a potential conflict of interest.
The Supplementary Material for this article can be found online at: https://www.frontiersin.org/articles/10.3389/fenrg.2021.627149/full#supplementary-material
Andersson, F. N. G. (2018). International Trade and Carbon Emissions: The Role of Chinese Institutional and Policy Reforms. J. Environ. Manage. 205, 29–39. doi:10.1016/j.jenvman.2017.09.052
B. W. Ang. (2015). LMDI Decomposition Approach: A Guide for Implementation. Energ. Pol. 86, 233–238.
Cai, B., Cui, C., Zhang, D., Cao, L., and Dai, C. (2019). China City-Level Greenhouse Gas Emissions Inventory in 2015 and Uncertainty Analysis. Appl. Energ. 253. doi:10.1016/j.apenergy.2019.113579
Chang, Y., Wang, C., Khan, M. I., and Wang, N. (2020). The Legal System for Environmental protection during Exploration and Exploitation of marine mineral Resources in China. Resour. Pol. 67. doi:10.1016/j.resourpol.2020.101670
Chen, H., Guo, W., Feng, X., Wei, W., Liu, H., Feng, Y., et al. (2021). The Impact of Low-Carbon City Pilot Policy on the Total Factor Productivity of Listed Enterprises in China. Resour. Conservation Recycling 169, 105457. doi:10.1016/j.resconrec.2021.105457
Chen, S., Shi, A., and Wang, X. (2020). Carbon Emission Curbing Effects and Influencing Mechanisms of China's Emission Trading Scheme: The Mediating Roles of Technique Effect, Composition Effect and Allocation Effect. J. Clean. Prod. 264. doi:10.1016/j.jclepro.2020.121700
Davis, S. J., and Caldeira, K. (2010). Consumption-based Accounting of CO2 Emissions. Proc. Natl. Acad. Sci. 107, 5687.
Dong, B., Ma, X., Zhang, Z., Zhang, H., Chen, R., Song, Y., et al. (2020). Carbon Emissions, the Industrial Structure and Economic Growth: Evidence from Heterogeneous Industries in China. Environ. Pollut. 262, 114322. doi:10.1016/j.envpol.2020.114322
Fang, G., Lu, L., Tian, L., He, Y., and Bai, Y. (2020). Can China Achieve the Energy-Saving and Emission Reducing Objectives during the “13th Five-Year-Plan”? -- A Systematic Evolutionary Analysis. J. Clean. Prod. 262, 121256. doi:10.1016/j.jclepro.2020.121256
Feng, Y., Chen, H., Chen, Z., Wang, Y., and Wei, W. (2021). Has Environmental Information Disclosure Eased the Economic Inhibition of Air Pollution? J. Clean. Prod. 284, 125412. doi:10.1016/j.jclepro.2020.125412
Franzen, A., and Mader, S. (2018). Consumption-based versus Production-Based Accounting of CO2 Emissions: Is There Evidence for Carbon Leakage? Environ. Sci. Pol. 84, 34–40. doi:10.1016/j.envsci.2018.02.009
Gu, S., Fu, B., Thriveni, T., Fujita, T., and Ahn, J. W. (2019). Coupled LMDI and System Dynamics Model for Estimating Urban CO2 Emission Mitigation Potential in Shanghai, China. J. Clean. Prod. 240, 118034. doi:10.1016/j.jclepro.2019.118034
Gu, Y., Wu, Y., Liu, J., Xu, M., and Zuo, T. (2020). Ecological Civilization and Government Administrative System Reform in China. Resour. Conservation Recycling 155, 104654. doi:10.1016/j.resconrec.2019.104654
Guo, R. (2015). “Chinese-style Development in Xinjiang,” in China's Spatial (Dis)integration. Editor R. Guo (United Kingdom, Chandos Publishing), 15–41. doi:10.1016/b978-0-08-100387-9.00002-6
Habert, G., Miller, S. A., John, V. M., Provis, J. L., Favier, A., Horvath, A., et al. (2020). Environmental Impacts and Decarbonization Strategies in the Cement and concrete Industries. Nature Reviews Earth & Environment.
He, L., Wu, M., Wang, D., and Zhong, Z. (2018). A Study of the Influence of Regional Environmental Expenditure on Air Quality in China: the Effectiveness of Environmental Policy. Environ. Sci. Pollut. Res. 25, 7454–7468. doi:10.1007/s11356-017-1033-8
Isabel Hilton, O. K. (2014). The Paris Agreement: China’s ‘New Normal’ Role in International Climate Negotiations. Clim. Pol. 17, 48–58.
Janssens-Maenhout, G., Crippa, M., Guizzardi, D., Muntean, M., Schaaf, E., Dentener, F., et al. (2019). EDGAR v4.3.2 Global Atlas of the Three Major Greenhouse Gas Emissions for the Period 1970-2012. Earth Syst. Sci. Data 11, 959–1002. doi:10.5194/essd-11-959-2019
Jiang, J., Ye, B., Xie, D., and Tang, J. (2017). Provincial-level Carbon Emission Drivers and Emission Reduction Strategies in China: Combining Multi-Layer LMDI Decomposition with Hierarchical Clustering. J. Clean. Prod. 169, 178–190. doi:10.1016/j.jclepro.2017.03.189
Li, X., Yang, X., Wei, Q., and Zhang, B. (2019). Authoritarian Environmentalism and Environmental Policy Implementation in China. Resour. Conservation Recycling 145, 86–93. doi:10.1016/j.resconrec.2019.02.011
Liu, B., Shi, J., Wang, H., Su, X., and Zhou, P. (2019). Driving Factors of Carbon Emissions in China: A Joint Decomposition Approach Based on Meta-Frontier. Appl. Energ. 256, 113986. doi:10.1016/j.apenergy.2019.113986
Liu, Q., Zhang, W., Yao, M., and Yuan, J. (2017). Carbon Emissions Performance Regulation for China's Top Generation Groups by 2020: Too Challenging to Realize?. Resour. Conservation Recycling 122, 326–334. doi:10.1016/j.resconrec.2017.03.008
Liu, Z., Davis, S. J., Feng, K., Hubacek, K., Liang, S., Anadon, L. D., et al. (2016). Targeted Opportunities to Address the Climate-Trade Dilemma in China. Nat. Clim Change 6, 201–206. doi:10.1038/nclimate2800
Luo, F., Guo, Y., Yao, M., Cai, W., Wang, M., and Wei, W. (2020). Carbon Emissions and Driving Forces of China's Power Sector: Input-Output Model Based on the Disaggregated Power Sector. J. Clean. Prod. 268, 121925. doi:10.1016/j.jclepro.2020.121925
McMillen, D. H. (1981). Xinjiang and the Production and Construction Corps: A Han Organisation in a Non-han Region. Aust. J. Chin. Aff. 6, 65–96. doi:10.2307/2159052
Qian, H., Xu, S., Cao, J., Ren, F., Wei, W., Meng, J., et al. (2021). Air Pollution Reduction and Climate Co-benefits in China's Industries. Nat. Sustain. 4, 417–425. doi:10.1038/s41893-020-00669-0
Quan, C., Cheng, X., Yu, S., and Ye, X. (2020). Analysis on the Influencing Factors of Carbon Emission in China's Logistics Industry Based on LMDI Method. Sci. Total Environ. 734. doi:10.1016/j.scitotenv.2020.138473
Shan, Y., Guan, D., Zheng, H., Ou, J., Li, Y., Meng, J., et al. (2018). China CO2 Emission Accounts 1997–2015. Scientific Data 5, 170201. doi:10.1038/sdata.2017.201
Shan, Y., Huang, Q., Guan, D., and Hubacek, K. (2020). China CO2 Emission Accounts 2016–2017. Scientific Data 7, 54. doi:10.1038/s41597-020-0393-y
Shan, Y., Guan, D., Liu, J., Mi, Z., Liu, Z., Liu, J., et al. (2017). Methodology and Applications of City Level CO 2 Emission Accounts in China. J. Clean. Prod. 161, 1215–1225. doi:10.1016/j.jclepro.2017.06.075
Shan, Y., Liu, J., Liu, Z., Xu, X., Shao, S., Wang, P., et al. (2016). New Provincial CO2 Emission Inventories in China Based on Apparent Energy Consumption Data and Updated Emission Factors. Appl. Energ. 184, 742–750. doi:10.1016/j.apenergy.2016.03.073
Shan, Y., Huang, Q., Guan, D., and Hubacek, K.(2020). China CO2 Emission Accounts 2016–2017. Scientific Data 7, 54.
Statistical Bureau of Xinjiang production and Construction Corps scoNBos (1998-2018). Statistical Yearbook of Xinjiang Production and Construction Corps. Beijing: China Statistics Press.
The State Council Information Office of the People’s Republic of China (2014). The History and development of Xinjiang production and Construction Corps. People’s daily. October 6,008.
Wang, M., Yao, M., Wang, S., Qian, H., Zhang, P., Wang, Y., et al. (2021). Study of the Emissions and Spatial Distributions of Various Power-Generation Technologies in China. J. Environ. Manage. 278, 111401. doi:10.1016/j.jenvman.2020.111401
Wang, Q., and Jiang, R. (2019). Is China's Economic Growth Decoupled from Carbon Emissions? J. Clean. Prod. 225, 1194–1208. doi:10.1016/j.jclepro.2019.03.301
Wang, Q., and Su, M. (2019). The Effects of Urbanization and Industrialization on Decoupling Economic Growth from Carbon Emission - A Case Study of China. Sust. Cities Soc. 51, 101758. doi:10.1016/j.scs.2019.101758
Wang, Y., Zhao, J., Li, Z., Liu, X., and Zhou, J. (2019). Study on Decoupling Effect and Driving Factors of Carbon Emission and Economic Growth in Northeast China. Environ. Sci. Tech. 42, 190–196.
Wang, Y., Yang, H., and Sun, R. (2020). Effectiveness of China's Provincial Industrial Carbon Emission Reduction and Optimization of Carbon Emission Reduction Paths in “lagging Regions”: Efficiency-Cost Analysis. J. Environ. Manage. 275, 111221. doi:10.1016/j.jenvman.2020.111221
Wang, Z., Zhao, N., Wei, W., and Zhang, Q. (2021a). A Differentiated Energy Kuznets Curve: Evidence from Mainland China. Energy 214, 118942. doi:10.1016/j.energy.2020.118942
Wei, W., Cai, W., Guo, Y., Bai, C., and Yang, L. (2020a). Decoupling Relationship between Energy Consumption and Economic Growth in China's Provinces from the Perspective of Resource Security. Resour. Pol. 68, 101693. doi:10.1016/j.resourpol.2020.101693
Wei, W., Hao, S., Yao, M., Chen, W., Wang, S., Wang, Z., et al. (2020b). Unbalanced Economic Benefits and the Electricity-Related Carbon Emissions Embodied in China's Interprovincial Trade. J. Environ. Manage. 263, 110390. doi:10.1016/j.jenvman.2020.110390
Wei, W., Li, J., Chen, B., Wang, M., Zhang, P., Guan, D., et al. (2021). Embodied Greenhouse Gas Emissions from Building China's Large-Scale Power Transmission Infrastructure. Nat. Sustain. doi:10.1038/s41893-021-00704-8
Wei, W., Zhang, P., Yao, M., Xue, M., Miao, J., Liu, B., et al. (2020c). Multi-scope Electricity-Related Carbon Emissions Accounting: a Case Study of Shanghai. J. Clean. Prod. 252, 119789. doi:10.1016/j.jclepro.2019.119789
Weng, Q., and Xu, H. (2018). A Review of China's Carbon Trading Market. Renew. Sust. Energ. Rev. 91, 613–619. doi:10.1016/j.rser.2018.04.026
Xie, P., Gao, S., and Sun, F. (2019). An Analysis of the Decoupling Relationship between CO2 Emission in Power Industry and GDP in China Based on LMDI Method. J. Clean. Prod. 211, 598–606. doi:10.1016/j.jclepro.2018.11.212
Yang, F., Yang, M., Xue, B., and Luo, Q. (2018). The Effects of China's Western Development Strategy Implementation on Local Ecological Economic Performance. J. Clean. Prod. 202, 925–933. doi:10.1016/j.jclepro.2018.08.203
Yang, Y., Qu, S., Cai, B., Liang, S., Wang, Z., Wang, J., et al. (2020). Mapping Global Carbon Footprint in China. Nat. Commun. 11, 2237. doi:10.1038/s41467-020-15883-9
Zhang, C., Zhou, B., and Wang, Q. (2019). Effect of China's Western Development Strategy on Carbon Intensity. J. Clean. Prod. 215, 1170–1179. doi:10.1016/j.jclepro.2019.01.136
Zhang, P., Cai, W., Yao, M., Wang, Z., Yang, L., and Wei, W. (2020a). Urban Carbon Emissions Associated with Electricity Consumption in Beijing and the Driving Factors. Appl. Energ. 275, 115425. doi:10.1016/j.apenergy.2020.115425
Zhang, Y., Wang, W., Liang, L., Wang, D., Cui, X., and Wei, W. (2020b). Spatial-temporal Pattern Evolution and Driving Factors of China's Energy Efficiency under Low-Carbon Economy. Sci. Total Environ. 739, 140197. doi:10.1016/j.scitotenv.2020.140197
Zhang, Z. (2017). Are China's Climate Commitments in a post‐Paris Agreement Sufficiently Ambitious? Wires Clim. Change 8, e443. doi:10.1002/wcc.443
Zhu, L., Dabo, G., Wei, W, Steven, J. D, Philippe, C., Jin, B., et al. (2015). Reduced Carbon Emission Estimates from Fossil Fuel Combustion and Cement Production in China. Nature 524, 335–338.
Keywords: XPCC, carbon emissions, economic effect, technical effect, population effect, energy structure effect
Citation: Wang M, Feng L, Zhang P, Cao G, Liu H, Chen J, Li X and Wei W (2021) Carbon Emissions in the Xinjiang Production and Construction Corps and Driving Factors. Front. Energy Res. 9:627149. doi: 10.3389/fenrg.2021.627149
Received: 08 November 2020; Accepted: 11 June 2021;
Published: 30 June 2021.
Edited by:
Benjamin Craig McLellan, Kyoto University, JapanReviewed by:
Godwin Norense Osarumwense Asemota, University of Rwanda, RwandaCopyright © 2021 Wang, Feng, Zhang, Cao, Liu, Chen, Li and Wei. This is an open-access article distributed under the terms of the Creative Commons Attribution License (CC BY). The use, distribution or reproduction in other forums is permitted, provided the original author(s) and the copyright owner(s) are credited and that the original publication in this journal is cited, in accordance with accepted academic practice. No use, distribution or reproduction is permitted which does not comply with these terms.
*Correspondence: Wendong Wei, d2VuZG9uZ3dlaUBzanR1LmVkdS5jbg==
†These authors have contributed equally to this work
Disclaimer: All claims expressed in this article are solely those of the authors and do not necessarily represent those of their affiliated organizations, or those of the publisher, the editors and the reviewers. Any product that may be evaluated in this article or claim that may be made by its manufacturer is not guaranteed or endorsed by the publisher.
Research integrity at Frontiers
Learn more about the work of our research integrity team to safeguard the quality of each article we publish.