 Shuaihu Li1,2*
 Jie Hou
- 1School of Automation and Electronic Information, Xiangtan University, Xiangtan, China
- 2School of Electrical and Information Engineering, Changsha University of Science and Technology, Changsha, China
- 3State Grid Hunan Electric Power Co. Ltd., Changsha, China
With the increase of power load demand and the complexity of power grid structure, the problem of voltage stability is becoming more serious, and it is urgent to study the countermeasures. In this paper, a DNN-based distributed voltage stability online monitoring method for large-scale power grids is proposed. Unlike the traditional load margin methods, the proposed method uses a local index load impedance modulus margin (LIMM) index to determine the optimal installation locations of PMUs, which is more efficiently. Moreover, the DNN is applied to learn the nonlinear relationship between the power system operation state and its corresponding LIMM. By this way, the corresponding LIMM value can be predicted through the state variables of nodes from the installed PMUs. This method can greatly improve the calculation speed of LIMM and assess the system voltage stability level in real-time, which help the system operator to judge the operating state and take measures in time. Finally, the proposed method is tested on the 14-bus system and then on the 118-bus system respectively, and the simulation results verify the effectiveness and correctness of the proposed method.
Introduction
With the improvement of intelligent level of the electrical power system and the access of various distributed generation, the voltage stability problem of power system becomes more serious. This problem is mainly caused by the inability of transmitting reactive power in a wide range of the large-scale power grid (Liu et al., 2012; Li et al., 2018). Therefore, an efficient and accurate on-line voltage stability assessment system (VSA) is particularly important to prevent large-scale blackouts. And one of the key solutions is to propose a fast, accurate and adaptive voltage stability online monitoring method. At present, the load margin index evaluation system based on continuous power flow (CPF) is widely used in VSA. But the calculation of CPF is so complex that cannot meet the requirements of online application. Moreover, the load margin index is a type of the global index, which cannot give the weak bus information (Wang et al., 2016; Malbasa et al., 2017). To address this problem, an artificial neural network (ANN) method is proposed to quickly estimate the load margin of power system in (Zhou et al., 2010). However, the ANN-based method also requires a large number of CPF calculations in different cases to form the training sample set, which leads to the low efficiency of the whole scheme. Therefore, some scholars presented the voltage stability monitoring methods based on PMU real-time data (Dahal et al., 2014; Jiang et al., 2014; Xie et al., 2014; Cai et al., 2017; Wu and Xie, 2017; Mahapatra et al., 2018). In (Sunitha et al., 2013), the PMU data and the deep neural networks (DNN) are utilized for online static security assessments. DNNs are demonstrated to have the real-time computational speed and strong generalization capability in security assessment of power systems (Wu et al., 2021). However, this method still cannot give the weak link information to give valuable guidance for the preventive control of voltage stability.
Considering above problems, several local voltage stability indexes were proposed to realize online voltage stability monitoring, such as line voltage stability index (LVIS), impedance stability index (ISI) and external voltage stability index (EVSI) (Hong et al., 1997; Vu et al., 1997; Haque, 2003; Milosevic and Begovic, 2003; Arya et al., 2008; Althowibi and Mustafa, 2010). Those local indexes can be calculated in the Stability monitoring and reference tuning device (SMARTDevice) by using local information to track the distance from the current state to voltage instability limit point. Then, SMARTDevice send the calculation results of local index to the control center for a global control decision. Moreover, it can use the index information of nodes to distinguish the weak areas and key nodes. However, the local indexes also have their limitations. For example, when the relative load margin index (RLMI) is close to the limit state of the system, the nonlinearity of the index is strong. This easily leads to the parameter drift. Moreover, the delay and noise of the collected information will seriously affect the accuracy of the evaluation. So Kalman filter (Li et al., 2019) and other methods have been used to solve the above problems, but the Kalman filter increase the analysis time and it is easy to cause information distortion.
In this paper, the load impedance modulus margin (LIMM) index proposed in (Liu et al., 2013) is selected as the VSM index for online monitoring. This index can reflect the weak link information of the system, which can be used to determine the installation location of PMU. Moreover, LIMM can evaluate the voltage stability accurately and quickly based on the local information measured by PMU. In order to make LIMM more suitable for on-line voltage stability monitoring, this paper applied DNN to predict LIMM. This method can not only find the optimal installation location of PMU, but also improve the calculation speed and accuracy of LIMM. Therefore, it is suitable for online voltage stability monitoring.
The main contributions of this paper are summarized as follows:
(1) The LIMM based on-line voltage stability monitoring method proposed in this paper can identify weak area and weak buses in power system. According this feature, the optimal installation locations of PMUs is determined.
(2) DNN-based method can predict LIMM in a short time, and it solves the parameter drift problem while LIMM calculated by the traditional numerical calculation method.
The rest of this paper is organized as follows. Load Impedance Modulus Margin gives a short introduction on LIMM. DNN-based distributed voltage stability online monitoring method presents DNN-based distributed voltage stability online monitoring method. This method is tested on the IEEE 14-Bus system and IEEE 118-bus system in Case study. Conclusions summaries the main conclusions of the proposed DNN-based method.
Load Impedance Modulus Margin
The power system is actually a complex nonlinear system. In (Devijver and Kitler, 1982), LIMM is a local index for assessing voltage stability margin, which was derived from Thevenin equivalent method. When the condition of the power systems is reaching maximum transmission power, the load equivalent impedance and the system equivalent impedance has relationship as follows:
where
where
Then, the LIMM (
According to the simple equations of Eqs 2,3, LIMM can be obtained directly with known nodal voltage and current parameters collected from PMU. The value of the LIMM ranges from 0 to 1, and ηi = 0 represents the critical point where Thevenin impedance is equal to load impedance. For practical application, the LIMM of the pilot node owing the minimum value of
Although the value of LIMM is easy to get by using the real-time collected node information, and the analysis speed meets the online requirements, the practical application of this technology is limited. As shown in Eqs 3,4, when the system state has no change or little change, the parameter
DNN-Based Distributed Voltage Stability Online Monitoring Method
Structure of DNN
Among many artificial neural networks (ANN), the most widely used is the multilayer perceptron (MLP) network, also known as DNN (Devijver and Kitler, 1982). The structure of the neural network is shown in Figure 1.
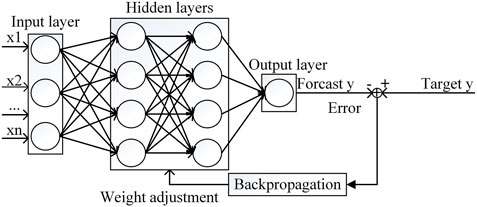
FIGURE 1. structure of DNN.
As shown in Figure 1, DNN consists of input layer, hidden layer and output layer. The circles in the layers represent neurons. The line between the two neurons represents the weight relationship. We need to determine the number of neurons according to the actual input and output features, but the number of input layer and output layer of DNN is always fixed as one. Moreover, the number of hidden layers is not fixed. It should be determined according to the requirements of practical application and the experiments. Generally, the more hidden layers, the stronger the nonlinear fitting ability of DNN, but the increase of hidden layers will also cause the over fitting problem of DNN. So it is important to choose a suitable number of hidden layers. Meanwhile, except for the input layer, the inputs of neurons in each layer are the output of each neuron in the upper layer. Therefore, in addition to the neurons in the input layer, each neuron in DNN represents a mathematical relationship, named forward propagation algorithm. And the DNN is mainly composed of forward propagation algorithm and back propagation algorithm (Michael, 2015). By using the forward propagation algorithm, the output of neural network can be obtained. And through the back-propagation algorithm, the output error of DNN can be fed back to the network structure, and then the network parameters can be optimized to obtain more accurate prediction results.
Based on the DNN principle mentioned above, this paper proposes an on-line voltage stability monitoring method for large-scale power grid. This method obtains power grid data through PMU in the power grid, and then calculates the LIMM. Finally, DNN is trained by using the power grid data and the calculated LIMM values. The trained DNN can estimate the voltage stability in real-time. Through this DNN model, power grid staff can get the current voltage stability of power grid online to prevent voltage instability or collapse. In order to realize the online monitoring method, it is necessary to choose the optimal location of PMUs and construct a DNN strategy framework.
Optimal Location of PMUs for Voltage Stability Monitoring
In the proposed method, the input features of DNN are obtained by the sample sets of the active and reactive power injections, nodal voltage and voltage phase angle. Real-time measurement system requires PMUs and telecommunication infrastructure to support these data collection. However, installation of PMUs at all nodes in a power system is not economically in practical. Therefore, it should find the optimal installation locations of PMUs. The reference (Sunitha et al., 2013) presented a PMU location optimal algorithm based on ANN and sequential forward selection (SFS) algorithm (Devijver and Kitler, 1982; Piramuthu, 2016). In this method, load margin has been used to evaluate voltage stability. And an input feature from a pool of candidate features is selected and the trained ANN is evaluated using a quality criterion function. The feature that gives the best value for the quality criterion function is retained for the next round of selection where the combinations of two input features are tried, and so on. The SFS algorithm obtains a chain of nested subsets of features by adding the locally best feature in the set. According to this method in (Sunitha et al., 2013), if the required number of features
This paper presents a new method to get the optimal location of PMUs based on LIMM. LIMM is more useful than load margin for the optimal installation locations of PMUs. LIMM can directly find the weaker nodes of voltage stability, these weaker nodes are suitable for installing PMUs since the nodes with smaller LIMM values will be easier to voltage collapse. According to the proposed method, also take the IEEE 39-bus system as an example, it needs to select five PMUs locations. We only need to calculate the LIMM values of all nodes in IEEE 39-bus system one time, and then sort the size to find the five nodes with the smaller LIMM values which are the optimal locations for installing the PMUs. Compared with the traditional method, the proposed method in this paper is more simple, direct and efficient. The process comparison of the two PMU location algorithms is shown in Figure 2.
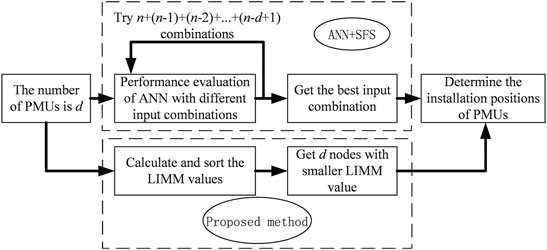
FIGURE 2. Comparison of PMU location algorithms.
Framework of DNN Strategy
Design of DNN
For the proposed method, it is necessary to establish a DNN model which the input features are power grid nodal data and the output feature is LIMM value. According to the 3.1 in this paper. The number of neurons in the input layer is the same as the number of input features, and the number of neurons in the output layer is the same as the number of output features. So the number of neurons in the output layer is fixed to one, and the number of neurons in the input layer must be determined by the following experiments. On the other hand, the number of hidden layers and the number of neurons in that layer were determined experimentally to be two hidden layers with twenty neurons. The activation function applied in this paper is Relu function. The research reported in this paper used Python neural network tools. The network was trained for a maximum of 150 epochs. The verification split ratio is 0.01. The batch size for one training is 50. The detailed process is shown in Case study below.
DNN Training Scheme
Figure 3 illustrates the complete process of designing the DNN based voltage stability margin estimator. The three main steps of training the DNN are as follows.
(1) A large number of cases with different load levels are randomly created, the random cases are gathered through a conventional power flow program to ensure that only the acceptable cases pass into the next step. This paper uses 1,000 cases which are randomly generated to generate sufficient training patterns for DNN training algorithm.
(2) LIMM algorithm is used to calculate the LIMM values of weak nodes as the voltage stability index. This is the target output of DNN to be trained.
(3) The input features and output index are fed into the DNN training algorithm.

FIGURE 3. DNN training process flow chart.
During the testing process, the trained DNN can be used to predict the voltage stability index for cases unseen by the DNN.
Preparation of Training Data
In order to obtain enough training data for sample sets, a large number of power flow cases with different load levels need to be generated randomly. Then the nodal operating parameters are collected as the data. the nodal voltage and current parameters are put into Eqs 2 to calculate the LIMM values. And these nodal data and LIMM values are used to be the input and output features of DNN. In order to ensure that all cases have power flow solution, it is necessary to use continuous power flow program to estimate the ultimate load level of the power grid, and make sure that the load levels in all cases are under the ultimate load level.
In this paper, the load proportion coefficient k is used to control the load level of power grid. The value of k is limited in 0 to kmax (kmax means the ultimate load level). Therefore, the process of training data preparation is as follows. First a thousand k values are selected randomly to obtain 1,000 load flow cases with different load levels, and these k values are uniformly distributed. Then the data of a thousand random cases are fed into LIMM algorithm to get 1,000 sets of training data. Finally, the active power, reactive power, voltage and phase angle of each node are taken as the input features of DNN, and the corresponding calculated LIMM value is taken as the output feature of DNN.
DNN Performance Measures
In this paper, two performance measures are used to evaluate the performance of the testing data, Root Mean Square Error (RMSE) in Eq. 5 and Maximum Error in Eq. 6:
where
Case Study
To evaluate the effectiveness of the proposed method for monitoring the voltage stability level online, simulations are conducted on the IEEE 14-bus system and IEEE 118-bus system.
Case1: IEEE 14-Bus System
Firstly, the proposed method is tested on the IEEE 14-bus system to verify its correctness. The structure of the power grid is shown in Figure 4. The system consists of 11 load nodes, 2 generator nodes and 20 transmission lines. After the test, the method will be put into a larger power grid to prove its practicability in both large and small power grids.
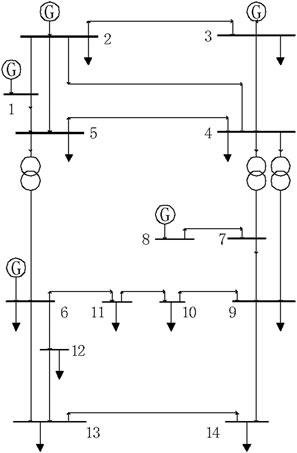
FIGURE 4. IEEE 14-bus system wiring diagram.
Optimal Installation Position for PMU
With the local index LIMM, we can judge the stability level of the whole power grid by the local data information.
Based on Load Impedance Modulus Margin of this paper, we generate LIMM algorithm in Matlab environment, and calculate LIMM values of all PQ nodes in IEEE 14-bus grid at the same load level (k = 1). Then the LIMM values of PQ nodes are show in Table 1.
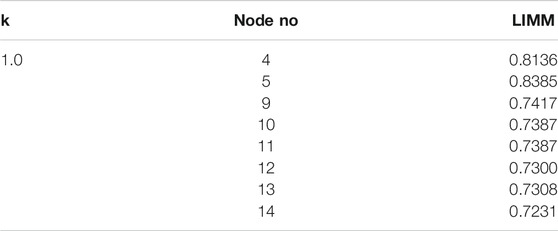
TABLE 1. LIMM values of IEEE 14-bus system.
In Table 1, k is the load proportion coefficient representing the current system load level. When the value of k increased, the power system will be closer to the voltage collapse. LIMM is the voltage stability index. A smaller LIMM value means that the node is weaker. Through the comparison of LIMM values under the same load level, we can find that the node with the minimum LIMM value is the 14th node. Because IEEE 14-bus system is a small power grid, we can focus on monitoring 14th node. Therefore, the PMU should be installed at the 14th node.
Selection of Input Features
There are many different combinations of neural network input features. In order to determine the best input feature combination of neural network, this paper tried four different input feature combinations which are related to LIMM. These include.
(1) net active and reactive power injections;
(2) voltage magnitudes and reactive power;
(3) voltage magnitudes and phase angles;
(4) voltage magnitudes, voltage phase angles and net active and reactive power injections.
In order to find out which combination of input feature is better, this paper generates 1,000 random cases through the data preparation method shown in 3.23. Among them, 900 cases are divided into training sets and the remaining 100 cases are test sets. Comparing the performance differences between different input feature combinations, the better combination will be found out.
Figure 5 compares the accuracy of the estimated LIMM by the DNNs trained with different input feature combinations. The graphs plot the “Target LIMM” against the “Forecasted LIMM” by the DNN, for the 100 unseen test cases. If the target LIMM completely matches with the forecasted LIMM, all points should lie on the diagonal line. Table 2 lists the Root Mean Square Error and Maximum Error for the 100 unseen test cases.
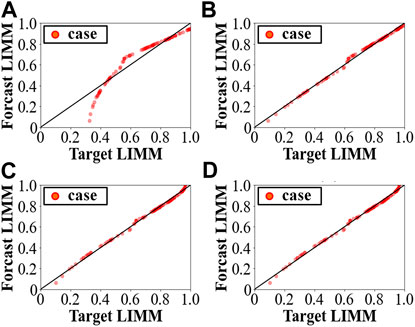
FIGURE 5. Predictive performances of LIMM values for different input feature sets. (A) Feature set 1: net active and reactive power injections (B) feature set 2: voltage magnitudes and reactive power (C) Feature set 3: voltage magnitudes and phase angles (D) Feature set 4: voltage magnitudes and phase angles and net active and reactive power injections.
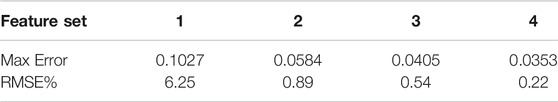
TABLE 2. DNN performance with different input feature sets.
Figure 5 and Table 2 show that the DNN with feature set 4 (voltage magnitudes, voltage phase angles and net active and reactive power injections) has better performance. The LIMM is closely related to these four features.
Case 2: IEEE 118-Bus System
The method proposed in this paper mainly solves the problem of on-line voltage stability assessment for large-scale power grid. Therefore, in order to show that the proposed method also has good performance in large-scale power grid, we test the method on IEEE 118-bus system. The IEEE 118-bus system is a large power grid, and the power system with large scale and complex structure usually adopts partition method to analyze. Generally, voltage stability problems start from local areas and gradually extend to other regions, so it is important to determine the weak areas of power system. In this paper, the IEEE 118-bus system is partitioned according to the principle of partition in (Ma, 2014), where each partition represents a regional power grid. The power grid wiring diagram is shown in Figure 6, where the black dotted lines are selected as tie lines and the bold red dotted lines are power grid partition lines. After disconnecting the tie lines, the system is divided into three regional power grids. The regional power grid 1 has a total of 35 nodes and 57 lines with a total load of about 1547 MW; The regional power grid 2 has a total of 48 nodes and 74 lines with a total load of about 1879 MW; The regional power grid 3 has a total of 35 nodes and 48 lines with a total load of about 1076 MW.
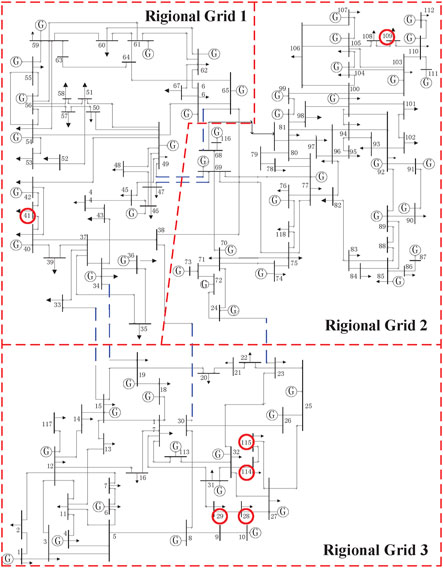
FIGURE 6. IEEE 118-bus system partition diagram.
Based on the Optimal PMU location algorithm in 4.1.1, the five weaker nodes in IEEE 118-bus system have been found out to be 29th node, 41st node, 28th node, 115th node and 114th node. According to Figure 6, these nodes are distributed in regional grid 1 and regional grid 3. In order to realize the whole area monitoring of power grid, it is also necessary to monitor 109th node which is relatively weak in regional grid 2. Therefore, in the IEEE 118-bus system, six PMUs are installed at these nodes mentioned above for voltage stability monitoring, as shown in the red circle position in Figure 6.
Numerical Results
Based on the data preparation method of Preparation of training data, each node has prepared 1,000 random cases for DNN model training. Among them, 900 cases are training sets and the remaining 100 cases are test sets. According to 4.2, the input features of DNN are the voltage magnitudes and phase angles and net active and reactive power injections of each node. The simulation results of each node are shown in Figure 7 and Table 3.
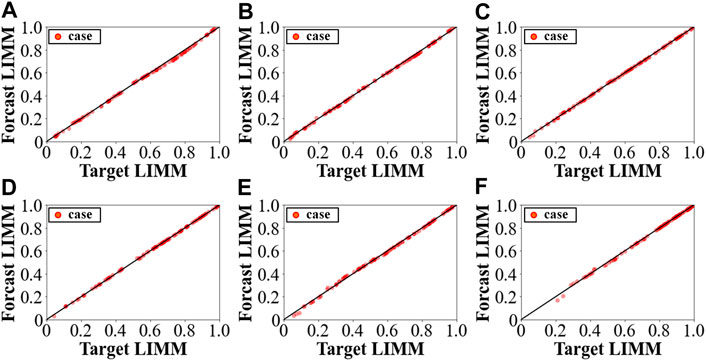
FIGURE 7. LIMM value prediction performances of different buses of IEEE 118-bus system. (A) Node 29 (B) Node 41 (C)Node 28 (D) Node 115 (E) Node 114 (F) Node 109.

TABLE 3. DNN performance with different buses.
Computation Time
Besides the accuracy, the computational performance is another advantage of this proposed method, which would be more obvious in the large-scale power system. We compared the CPU time of our method with the CPU time of traditional CPF method for both IEEE 14-bus system and IEEE 118-bus system. The simulations were run on a PC with an Intel Core i5-9500, 3.00 GHz processor and 16 GB of RAM. The simulation platforms are Matlab and python. The experiments were conducted on the same PC. Our method used a sample set of 900 training cases and 100 unseen test cases. And we also used CPF to calculate 100 cases in the two systems. The calculation time is accounted, and the results are listed in Table 4.
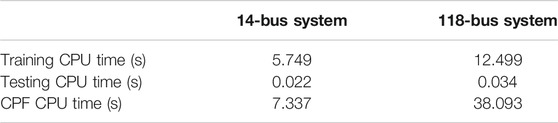
TABLE 4. Algorithms comparison in two systems.
As shown in Table 4, the training time of our method for IEEE 14-bus system is 5.749 s. And for IEEE 118-bus system, it takes 12.499 s to train six DNN models for six nodes at the same time. Moreover, once the DNN training is completed, the margin estimation of new cases is almost instantaneous. For IEEE 14-bus system, the calculation time of LIMM value estimation for 100 test cases by trained DNN is less than 0.03 s. For IEEE 118-bus system, the calculation time of LIMM value estimation for 100 test cases by trained DNN is less than 0.04 s. However, for IEEE 14-bus system, CPF needs 7.337 s to complete the margin estimation of 100 test cases. And for IEEE 118-bus system, CPF needs 38.093 s to complete the margin estimation of 100 test cases. As mentioned above, compared with CPF method, the proposed method has a certain improvement in computation speed.
Conclusion
This paper proposes a DNN based distributed voltage stability online monitoring method for large scale power grid. In this method, DNN is used as machine learning technology to realize on-line monitoring for voltage stability. And the nonlinear relationship between power system operation state and corresponding LIMM is learning by use of a large number of historical data. The historical data includes the active power, reactive power, voltage magnitudes and phase angles obtained by PMUs. In practice, the number of PMUs is limited. So an optimal location method based on LIMM for install PMU is proposed in this paper. From the simulation results in IEEE 14-bus system and IEEE 118-bus system, the effectiveness of DNN in voltage stability assessment is verified. Compared with the CPF method, the proposed method is faster than CPF method and has the function of indicating weak link information, which is significant to help the system operator to judge the operating state and take measures in time.
Data Availability Statement
The original contributions presented in the study are included in the article/Supplementary Material, further inquiries can be directed to the corresponding author.
Author Contributions
LS is responsible for the design and thinking of the project, HJ is responsible for the experimental design and paper writing, YA is responsible for providing part of the data, and LJ is responsible for the collation and collection of the data.
Funding
The work is supported by the National Natural Science Foundation of China (No.51777179). Project Name: Study of Multiple Power Conversion Device Connection on Voltage Stability and Its Preventive Control Method.
Conflict of Interest
AY was employed by State Grid Hunan Electric Power Co. Ltd.
The remaining authors declare that the research was conducted in the absence of any commercial or financial relationships that could be construed as a potential conflict of interest.
References
Althowibi, F. A., and Mustafa, M. W. (2010). “Voltage stability calculations in power transmission lines: indications and allocations,” in IEEE International Conference on Power and Energy. Kuala Lumpur, Malaysia, November, 2010, 390–395. doi:10.1109/PECON.2010.5697615
Arya, L. D., Choube, S. C., and Shrivastava, M. (2008). Technique for voltage stability assessment using newly developed line voltage stability index. Energ. Convers. Manage. 49, 267–275. doi:10.1016/j.enconman.2007.06.018
Cai, L., Thornhill, N. F., and Pal, B. C. (2017). Multivariate detection of power system disturbances based on fourth order moment and singular value decomposition. IEEE Trans. Power Syst. 32 (6), 4289–4297. doi:10.1109/TPWRS.2016.2633321
Dahal, O. P., Brahma, S. M., and Cao, H. (2014). Comprehensive clustering of disturbance events recorded by phasor measurement units. IEEE Trans. Power Deliv. 29 (3), 1390–1397. doi:10.1109/TPWRD.2013.2285097
Devijver, P., and Kitler, J. (1982). Pattern recognition: a statistical approach. Englewood Cliffs, NJ: Prentice-Hall.
Haque, M. H. (2003). On-line monitoring of maximum permissible loading of a power system within voltage stability limits. IEE Proc. Gener. Transm. Distrib. 150 (1), 107–112. doi:10.1049/ip-gtd:20020682
Hong, Y.-H., Pan, C.-T., and Lin, W.-W. (1997). Fast calculation of a voltage stability index of power systems. IEEE Trans. Power Syst. 12 (4), 1555–1560. doi:10.1109/59.627858
Jiang, H., Zhang, J. J., Gao, W., and Wu, Z. (2014). Fault detection, identification, and location in smart grid based on data-driven computational methods. IEEE Trans. Smart Grid 5 (6), 2947–2956. doi:10.1109/TSG.2014.2330624
Li, C., Wang, X., Zhang, P., Zhu, X., Li, D., and Chen, T. (2019). Online voltage stability monitoring method for multi-boundary weak area. J. Power Syst. automation Chin. 31 (2), 19–25. doi:10.3969/j.issn.1003-8930.2019.02.004
Li, S., Tan, Y., Li, C., Cao, Y., and Jiang, L. (2018). A fast sensitivity-based preventive control selection method for online voltage stability assessment. IEEE Trans. Power Syst. 33 (4), 4189–4196. doi:10.1109/TPWRS.2017.2776968
Liu, G., Shi, H., and Yang, Y. (2013). Comprehensive dynamic analysis method for power system static voltage stability. Proc. CSEE 33 (10), 50–56.
Liu, H., Chen, X., Yu, K., and Hou, Y. (2012). The control and analysis of self-healing urban power grid. IEEE Trans. Smart Grid 3 (3), 1119–1129. doi:10.1109/TSG.2011.2167525
Ma, H. (2014). Research on method of limiting short-circuit currents and partition principle for UHV interconnected power system. Beijing, China: North China Electric Power University.
Mahapatra, K., Chaudhuri, N. R., Kavasseri, R. G., and Brahma, S. M. (2018). Online analytical characterization of outliers in synchrophasor measurements: a singular value perturbation viewpoint. IEEE Trans. Power Syst. 33 (4), 3863–3874. doi:10.1109/TPWRS.2017.2771782
Malbasa, V., Zheng, C., Chen, P.-C., Popovic, T., and Kezunovic, M. (2017)). Voltage stability prediction using active machine learning. IEEE Trans. Smart Grid 8 (6), 3117–3124. doi:10.1109/TSG.2017.2693394
Milosevic, B., and Begovic, M. (2003). Voltage-stability protection and control using a wide-area network of phasor measurements. IEEE Trans. Power Syst. 18 (1), 121–127. doi:10.1109/TPWRS.2002.805018
Piramuthu, S. (2004). Evaluating feature selection methods for learning in data mining applications. Comput. Artif. Intelligence Inf. Technol. 156, 483–494.
Sunitha, R., Kumar, R. S., and Mathew, A. T. (2013). Online static security assessment module using artificial neural networks. IEEE Trans. Power Syst. 28 (4), 4328–4335. doi:10.1109/TPWRS.2013.2267557
Vu, K., Begovic, M. M., Novosel, D., and Saha, M. M. (1997). “Use of local measurements to estimate voltage-stability margin,” in Proceedings of the 20th International Conference on Power Industry Computer Applications. Columbus, OH, May, 1997, 318–323. doi:10.1109/PICA.1997.599420
Wang, B., Fang, B., Wang, Y., Liu, H., and Liu, Y. (2016). Power system transient stability assessment based on big data and the Core vector machine. IEEE Trans. Smart Grid 7 (5), 2561–2570. doi:10.1109/TSG.2016.2549063
Wu, M., and Xie, L. (2017). Online detection of low-quality synchrophasor measurements: a data-driven approach. IEEE Trans. Power Syst. 32 (4), 2817–2827. doi:10.1109/TPWRS.2016.2633462
Wu, T., Zhang, Y. J. A., and Wen, H. (2021). Voltage stability monitoring based on disagreement-based deep learning in a time-varying environment. IEEE Trans. Power Syst. 36 (1), 28–38. doi:10.1109/TPWRS.2020.3008498
Xie, L., Chen, Y., and Kumar, P. R. (2014). Dimensionality reduction of synchrophasor data for early event detection: linearized analysis. IEEE Trans. Power Syst. 29 (6), 2784–2794. doi:10.1109/TPWRS.2014.2316476
Keywords: load impedance modulus, wide area measurement system, PMU position, voltage stability, deep neural network
Citation: Li S, Hou J, Yang A and Li J (2021) DNN-Based Distributed Voltage Stability Online Monitoring Method for Large-Scale Power Grids. Front. Energy Res. 9:625914. doi: 10.3389/fenrg.2021.625914
Received: 04 November 2020; Accepted: 18 February 2021;
Published: 26 March 2021.
Edited by:
Lin Jiang, University of Liverpool, United KingdomCopyright © 2021 Li, Hou, Yang and Li. This is an open-access article distributed under the terms of the Creative Commons Attribution License (CC BY). The use, distribution or reproduction in other forums is permitted, provided the original author(s) and the copyright owner(s) are credited and that the original publication in this journal is cited, in accordance with accepted academic practice. No use, distribution or reproduction is permitted which does not comply with these terms.
*Correspondence: Shuaihu Li, bGlzaHVhaWh1MjAxMEAxMjYuY29t