
94% of researchers rate our articles as excellent or good
Learn more about the work of our research integrity team to safeguard the quality of each article we publish.
Find out more
ORIGINAL RESEARCH article
Front. Energy Res., 24 June 2021
Sec. Process and Energy Systems Engineering
Volume 9 - 2021 | https://doi.org/10.3389/fenrg.2021.565761
This article is part of the Research TopicTechnological and Fundamental Advances in Production, Storage and Utilization of Solar FuelsView all 9 articles
We propose a novel solar thermochemical receiver–reactor array concept for hydrogen production via ceria redox cycling. The receiver–reactor array can improve the solar-to-fuel efficiency by realizing the heat recuperation, reduction, and oxidation processes synchronously. A linear matrix model and a lumped parameter model are developed to predict thermal performance of the new solar thermochemical system. The system thermal performance is characterized by heat recovery effectiveness of solid-phase and solar-to-fuel efficiency. Investigated parameters include reduction temperature, oxygen partial pressure, number of receiver–reactors, concentration ratio, and gas-phase heat recovery effectiveness. For baseline conditions, the solid-phase heat recovery effectiveness and the solar-to-fuel efficiency are found to be 81% and 27%, respectively. For perfect gas-phase heat recovery and a solar concentration ratio of 5,000, the solar-to-fuel efficiency exceeds 40%.
Solar fuels offer great promise to a sustainable future and can be produced via several pathways such as photo-, electro-, and thermochemical processes, as well as their various combinations (Steinfeld, 2005). Compared to the other processes, the solar thermochemical approach utilizes the entire solar spectrum, allowing for higher theoretical solar-to-fuel efficiency (Steinfeld, 2005; Siegel et al., 2013; Muhich et al., 2016; Bader and Lipiński, 2017). In particular, the two-step non-stoichiometric based redox cycles have been an attractive research area over the past decade (Chueh and Haile, 2010; Furler et al., 2012a; Marxer et al., 2017; Steinfeld, 2019; Qian et al., 2021). Synthesis gas (syngas, a mixture of H2 and CO) can be produced in two steps. In the first, endothermic step, a metal oxide is non-stoichiometrically reduced, driven by concentrated solar irradiation. In the second, exothermic step, the reduced metal oxide is oxidized with the H2O and/or CO2 and H2 and/or CO are produced, respectively.
A key figure of merit to assess the commercial viability of the solar thermochemical pathway for fuel production is the solar-to-fuel efficiency (defined in Eq. 26). A threshold efficiency value of 20% has been suggested to compete with low-risk approaches such as electrolysis (Siegel et al., 2013). Although solar thermochemical water splitting has a high theoretical solar-to-fuel conversion efficiency of 75% (Steinfeld, 2005), to date the experimental record of this technology is only 5.25% for splitting of CO2 into CO and O2 (Marxer et al., 2017).1 Improvement of the solar-to-fuel efficiency critically relies on the development of both superior redox materials and novel reactor designs (Lapp et al., 2012; Miller et al., 2014; Hathaway et al., 2016; Muhich et al., 2018; Li et al., 2021). A wide variety of non-stoichiometric redox materials have been investigated, including pure and doped ceria, as well as perovskites (Chueh et al., 2010; Hao et al., 2014; Qian et al., 2021). Among these candidates, undoped ceria offers a great promise for efficient fuel production due to its fast kinetics, robust cyclability, and high selectivity, and is thus selected as the model material in this study (Abanades et al., 2010; Chueh et al., 2010; Furler et al., 2012b; Marxer et al., 2017).
Many reactor designs were proposed and tested with the ultimate goal of improving the solar-to-fuel efficiency (Chueh et al., 2010; Diver et al., 2010; Lapp et al., 2013; Dähler et al., 2018; Wang et al., 2020; Wang et al., 2021). They can be categorized into designs with solid and/or gas heat recuperation (Ermanoski et al., 2013; Lapp and Lipiński, 2014; Hathaway et al., 2016) and designs without heat recuperation (Welte et al., 2016; Marxer et al., 2017). The majority of the reactor systems demonstrated so far are based on the fixed-bed type due to the design simplicity and convenient operation (Chueh et al., 2010; Furler et al., 2012b; Hathaway et al., 2016; Marxer et al., 2017; Haeussler et al., 2020; Sun-to-liquid, 2020). However, a key challenge associated with designing an efficient fixed-bed reactor system is to recover the solid sensible heat under temperature-swing cycling due to the immobility of the redox material. This is particularly relevant when using undoped ceria because its efficiency is critically limited by the energy penalty to heat the solid phase (Hathaway et al., 2016; Muhich et al., 2018; Li et al., 2021). A multi-chamber fixed-bed reactor concept was developed by Yuan et al. that allows for solid heat recuperation by using liquid metal as the heat transfer fluid. This concept promises a thermal-to-chemical efficiency of 20% and a heat recovery effectiveness of 80%, but at the expense of complicated design and operation (Yuan et al., 2015). A more generic design concept incorporating counterflow solid heat exchange was proposed by Falter et al., though the design poses technical challenges to practical operation of moving the high-temperature redox materials (Falter et al., 2015). Besides, a new receiver–reactor system with integrated thermocline heat recovery was proposed but lacks theoretical or experimental investigations (Steinfeld et al., 2019). To our best knowledge, realizing efficient solid-phase heat recovery in the fixed-bed reactor system with a simple design and operating strategy is absent in the literature.
In our previous work, we proposed a modified solar beam-down system for realizing solid-phase heat recovery for the fixed-bed reactor configuration, where the analysis of the optical system was presented in detail (Li et al., 2020b). In the present work, we introduce the design of the array of receiver–reactors, coupled to the beam-down system, together with the operating strategy for realizing solid-phase heat recovery. The main merits of this work are: (i) the heat recovery is realized without the need of moving redox materials; (ii) the heat of the solid phase is recovered by the direct gas–solid heat exchange in series; and (iii) hydrogen is produced continuously. The model receiver–reactor system comprising recuperation, reduction, and oxidation zones is introduced in “Problem Statement” section. Model assumptions, as well as mathematical models, are described in sections “Methodology and Assumptions” and “Mathematical Model”. Section “Results and Discussion” presents the assessment of the heat recovery effectiveness from the solid phase and the sensitivity analysis of the total solar-to-fuel efficiency depending on key parameters, including reduction temperature, relative oxygen partial pressure, receiver–reactor numbers, concentration ratio, and gas-phase heat recovery effectiveness.
Thermochemical water splitting (WS) process based on two-step ceria redox cycles is considered in this study:
where
Figure 1 depicts the schematic of the proposed beam-down thermochemical system featuring a heliostat field, a tower, a rotating hyperboloidal tower reflector (TR), and a stationary cavity receiver–reactor (CRR) array coupled with compound parabolic concentrators (CPCs) (Li et al., 2020b). The rotating TR directs the concentrated solar irradiation alternately to each CRR through the aperture of the CPCs. Since the focus of this paper is on the reactor system, the radiative input from the optical system is modeled here in a simplified manner assuming step-wise irradiation.
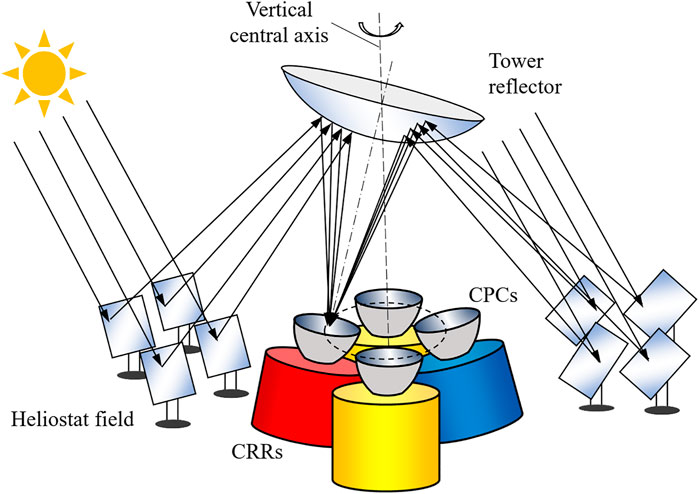
FIGURE 1. Schematic of the proposed solar thermochemical system consisting of a heliostat field, a beam-down reflector, and a cavity receiver–reactor array. This figure is adapted from (Li et al., 2020b).
Figure 2 shows an example of an 8-CRR array that is arranged in a circular layout and fixed on a pedestal (not shown). The system is divided into three zones: reduction (red), oxidation (blue), recuperation (including pre-heating and pre-cooling subzones, yellow) zones. The same amount of the monolithic reticulated porous ceria (RPC) is contained in each CRR.2 The reduction reaction is realized in the CRR irradiated by the concentrated sunlight (red). The oxidation reaction is realized in the CRR on the opposite side (blue). All other CRRs (yellow) are separated by the central axis into two groups, and heat is exchanged between the two groups. To reduce the emission loss, the aperture of the receiver–reactor is opened only when being irradiated by the concentrated sunlight, and is kept closed otherwise. The CRRs are connected to the neighboring ones and to the gas-phase heat exchangers via pipes. Therefore, the inert gas and water flow through each receiver–reactor to sweep the RPC alternately.
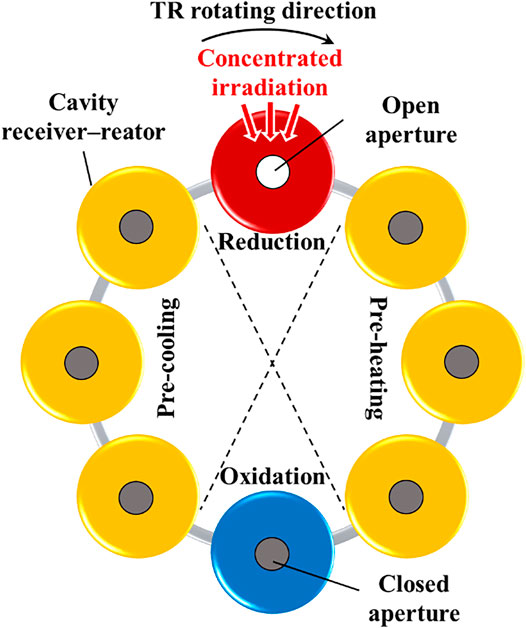
FIGURE 2. Schematic of an example array of 8 receiver–reactors. The gas-phase heat exchangers and the related connecting devices are not shown in the figure. This figure is adapted from (Li et al., 2020b).
As the rotating TR directs the concentrated sunlight to the stationary CRR array in a clockwise manner, the CRR array can be viewed as “rotating” counter-clockwise relative to the position of concentrated solar irradiation. The operating procedure for one cycle duration τ is shown in Figure 3. States 1 and 2 represent the beginning of the nth cycle, and the time instant after “rotating” the CRR array counter-clockwise in one phase, respectively. The transition from State 1 to 2 is assumed instantaneous and thus both states are treated to occur at the same time instant (n−1)τ. States 3 and 4 represent the initial and final states of the thermochemical process of the nth cycle, respectively. For ensuring the synchronization of reduction, oxidation, and recuperation processes, the duration of States 3 and 4, τ, is determined by the duration of the reduction step, and the other two processes are proceeding simultaneously for the same duration τ by adjusting the flow rates of water and sweep gas. After a complete cycle, the system returns to State 1.
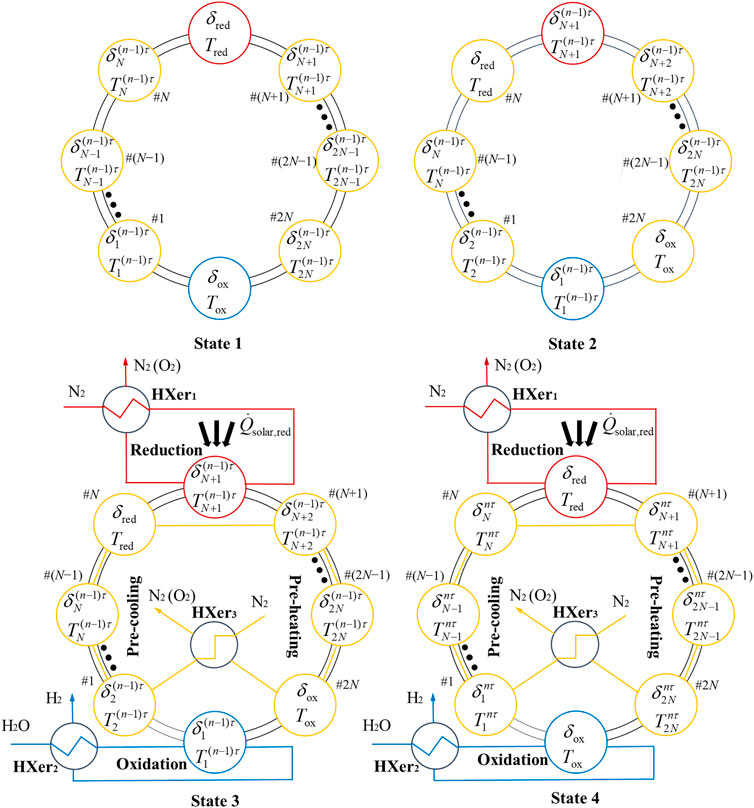
FIGURE 3. Operating procedure (4 states) for the nth redox cycle. N2 (O2) represents N2 mixed with O2. State 1: initial state of the nth cycle; State 2: “rotated” counter-clockwise in one phase; State 3: begin of reaction or the (n−1)τ time instant; State 4: final state of the nth cycle or the nτ time instant. The red, blue, and yellow arrows indicate mass flows in reduction, oxidation, and recuperation zones, respectively. The black thick arrows indicate the flow of energy. The CRRs and the HXer3 are connected in series by pipes, which are not shown in this figure.
As shown in Figure 3, we assume that the CRR array rotates counter-clockwise by one phase during a change from State 1 to State 2.3 Therefore, the CRR in #(N+1) position of the recuperation zone moves into the reduction zone, where it will be irradiated by concentrated solar irradiation. Then, pure N2 is used to sweep RPC of the CRR in the reduction zone and to keep rejecting released O2 from porous media surfaces during the change from State 3 to State 4. The thermal energy of the product gas, the mixture of N2 and O2, is recovered to heat the inlet flow of N2 by using an indirect gas-phase heat exchanger (HXer1). A reduction period finishes when the thermodynamic state
The recuperation zone is composed of one gas-phase heat exchanger (HXer3) and 2N CRRs (yellow) with one half undergoing pre-cooling (from #1 to #N) and another half undergoing pre-heating (from #(N+1) to #2N) as labeled in Figure 3.
N2 is used as the sweep gas for oxygen scavenger and heat transfer fluid (HTF). A pure cold N2 flow first goes into an indirect gas-phase heat exchanger (HXer3) where it is heated by the heat of product gases, namely, a mixture of N2 and O2. The mixture gas then flows continuously through the pre-cooling part from #1 to #N to cool the RPC material in each CRR. The sweep gas reaches the peak temperature when leaving #N, and then goes through the pre-heating part from #(N+1) to #2N to heat the RPC material. The state of ceria in each CRR is updated from
According to Figure 3, the CRR in #1 position of the recuperation zone containing the reduced ceria
The methodology of modeling transient radiative fixed-bed reduction and cavity cascade heat recuperation is presented next. A lumped parameter model (LPM) and a linear matrix model (LMM) are, respectively, presented to describe the reducing and recuperating processes of the novel receiver–reactor redox system. For the LPM, the reduction is treated as a transient process and the numerical method is applied to solve the non-linear governing equation. For the LMM, mass and heat transfer between recuperation CRRs are expressed by a set of linear equations which is solved by matrix iteration. The main assumptions and settings are as follows:
(1) Thermodynamic quasi-equilibrium is assumed for ceria reduction and oxidation.
(2) Temperature difference between the RPC and sweep gases is neglected.
(3) Lumped parameters of the RPC and gases, including temperature, relative oxygen partial pressure, non-stoichiometry, N2 flow rate, are concluded for each CRR.
(4) The relative oxygen partial pressure
(5) The effectiveness of gas-phase heat exchanger is set to 95% according to the literature (Blank and Wu, 1994; El-Ehwany et al., 2010).
(6) The maximum operating temperature is set to 2,000 K, as ceria will undergo a phase change at temperatures
(7) The oxidation reaction is undergone constantly at 1,000 K.
(8) For the LMM, the temperature of RPC (or sweep gases) in the recuperation zone varies linearly over time, namely,
Figure 4 shows the schematic of the system model for the reaction process in the nth cycle from the (n−1)τ to nτ time instant. It corresponds to the process from State 3 to 4 in Figure 3. The red and blue blocks represent CRRs in the reduction and oxidation zones. In the recuperation zone, the CRRs are represented in a row of yellow rectangular boxes separated into the pre-cooling and pre-heating parts. All CRRs are enclosed by a frame in the solid line as the reactor boundary. For each CRR, the initial and final thermodynamic states of ceria in the nth cycle are given correspondingly. Thick solid arrows are used to show the direction of reactions. The flows of mass and energy are represented by thin solid arrows and thick hollowed arrows, respectively. The outermost dash frame denotes the boundary of the whole system. A steady thermodynamic state of temperature, T0 = 298 K and gauge pressure, p0 = 1.013 × 10⁵ Pa is assumed for the surroundings.
Energy conservation of the system undergoing one cycle (shown in Figure 4) is:
where Qsolar represents the total solar energy input during one cycle, including energy consumed by the reduction reaction Qsolar,red, and energy for the recovery of heat losses Qsolar, recovery. They can be expressed as:
where
where Qgas is the gas-phase heat recovery loss equal to the sum of the heat losses during heat exchanging, reducing, and oxidizing processes, Qgas,HX, Qgas,red, and Qgas,ox, respectively, which are calculated using Eqs. 10–12. Qquench in Eq. 6 is the quenching heat loss for rapidly cooling ceria from
The governing equations of the LPM for simulating the non-linear solar reduction process are:
The implicit Euler time integration scheme is applied. Thus,
δ at the end of each time step is obtained by solving Eq. 15 using experimental data of non-stoichiometric cerium dioxide at thermodynamic equilibrium (Panlener et al., 1975).
For modeling the recuperating process, the LMM is established. The energy-balance equation for CRRs in the recuperation zone from State 3 to State 4 in a redox cycle is as follows:
where the subscript i represents the CRR position of the recuperation zone and the superscript n represents the nth redox cycle. As shown in Figure 3,
The LHS of Eq. 17 represents the change in internal energy of RPC material corresponding to #i position, and the RHS is the net amount of thermal energy input (or output) by N2 from State 3 to State 4. For #1 position of the recuperation zone, the heat loss of gas-phase heat recovery should be considered, and the modified equation is:
where ε is gas-phase heat recovery effectiveness,
where
A non-dimensional parameter β, defined as the ratio of the speed of thermal front,
Figure 6 shows the steady-state temperature distributions of the CRR array, containing a reduction CRR, an oxidation CRR, and six recuperation CRRs, at the end of a cycle when reaching a steady running condition. For 0 < β < 1, the solid-phase heat recovery in the recuperation zone is insufficient, and the heat recovery efficiency can be improved by increasing β. The highest heat recovery efficiency, ηrecovery = (T4 − Tox)/(Tred − Tox), is found at β = 1, where the final temperature distributions of the pre-heating and pre-cooling CRRs are identical (Figure 6B). Further increase of β leads to a detrimental effect on solid-phase heat recovery. Because the temperature of CRR in #3 drops below 1675 K when β > 1, the CRR in #4 will be cooled. Finally, the temperatures of all CRRs in the recuperation zone approach the same value of 1450 K when β = ∞. In this study, β is set to 1.

FIGURE 6. Steady-state temperature distributions in the CRR array at the end of a cycle for (A)β = 0, (B)β = 1, and (C)β = ∞.
Besides, as given in Eq. 21, δ in each recuperation CRR is determined by
Equations 13 and 14 can be written in a matrix form as:
where
,
Vectors
The process of oxidation involves two synchronous reactions: ceria re-oxidation and water splitting (WS). Similar to the reduction modeling, the lumped transient method is applied with the assumption of quasi thermodynamical equilibrium for each time step, namely ΔGox = 0. The expression is given by :
where
In the present work, we propose an effective recuperation system to enhance the solid-phase heat exchange. System performance is characterized by the heat recovery effectiveness εsolid defined as the ratio of the recovered thermal energy Qrec,solid to the thermal enthalpy change of RPC during the redox cycle, and solar-to-fuel efficiency of the overall system defined as the total amount of thermal energy output of hydrogen divided by the concentrated solar energy input:
In this section, we first present the verification of the described mathematical model and its assumptions. Then, we present the performance of the proposed receiver–reactor array. Finally, we show the results of a sensitivity study of the thermal-to-chemical efficiency as functions of the concentration ratio C, the number of CRRs in the pre-cooling or pre-heating part, N, the gas-phase heat recovery effectiveness ε, the reduction temperature, Tred, and the relative oxygen partial pressure,
The present model is verified by comparing its selected predictions with the numerical and experimental results obtained by Venstrom et al. (2015) for the reduction reaction of a fixed-bed of ceria. Firstly, we compare the O2 production rate,
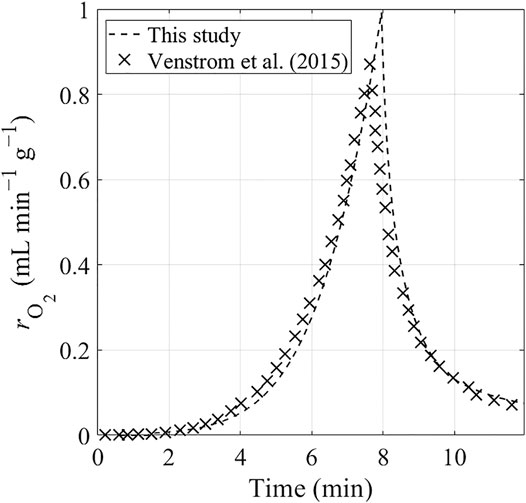
FIGURE 7. Transient O2 production rate from reduction reaction of fixed-bed ceria predicted by two numerical models: the model developed by Venstrom et al. (2015) (represented by the crosses) and the present model (represented by the dashed curves). The reduction reaction is operated under an increasing temperature and a constant N2 flow.
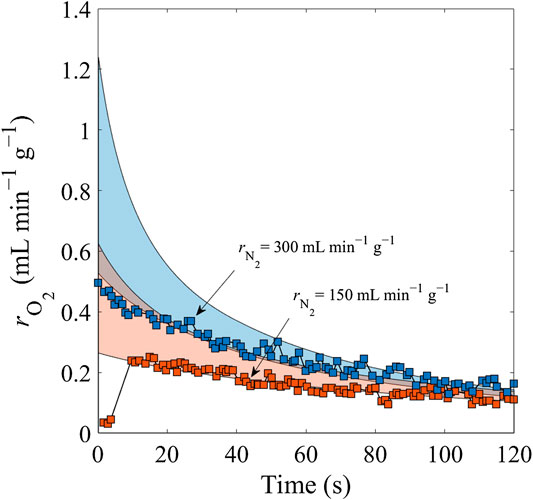
FIGURE 8. Comparison of predicted (color areas) and measured (squares) data for N2 sweep gas flows of 150 mL min−1 g−1 (orange) and 300 mL min−1 g−1 (blue) at a constant reduction temperature Tred = 1,773 K.
In addition, according to the second law of thermodynamics, Gibbs’s criterion should be followed at any time for chemical processes to spontaneously take place at specified thermodynamical conditions (Li et al., 2018a; Li et al., 2018b). In this study, we made an important assumption that for the recuperation step, the transient change of δ for each pre-heating cavity is linear during a cycle. Chemical reactions are assumed at equilibrium states at the beginning and the end of each cycle, namely ΔG = 0. As shown in the inset of Figure 9A, it takes N cycles to complete the pre-heating process for the cavity to move from #2N to #(N+1) position. The maximum δ at each temperature to reach thermodynamic equilibrium, δeq, is calculated and plotted in Figure 9 (the dashed curve in the inserted figure). The curve of δeq separates the full area into two regions: the gray region, ΔG < 0, and the white region, ΔG > 0. To meet the Gibbs’ criterion, δ should always be below δeq, namely in the gray region. Figure 9A shows that the values of δ under the assumption of linear change of δ in the recuperation process, δpresent, exceed the values of δ under the equilibrium condition, δeq, except for the initial and final states of cycles.
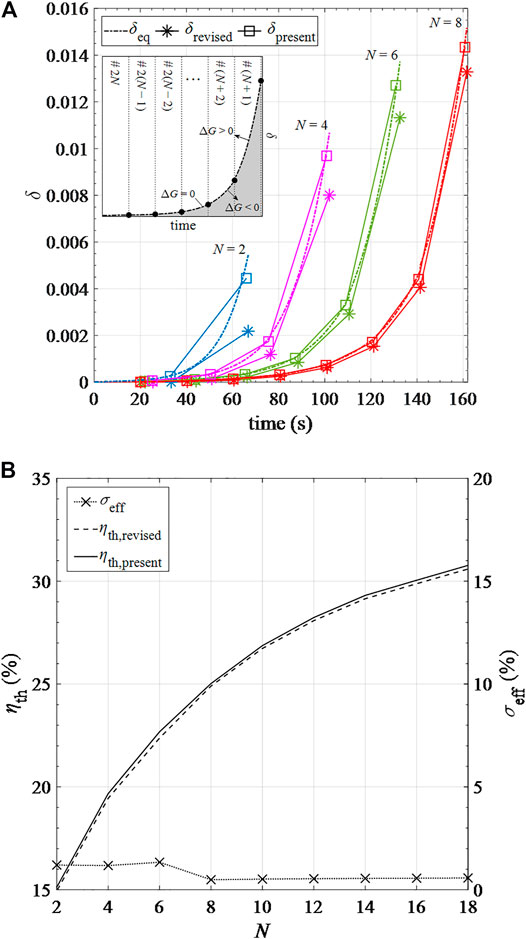
FIGURE 9. Results of (A)δ over time based on the present model (δpresent), the revised model (δrevised) and the equilibrium assumption (δeq) in different pre-heating cavity numbers; (B) solar-to-fuel efficiencies based on the present (ηpresent) and revised (ηrevised) models and their relative errors σeff in different pre-heating cavity numbers.
To examine the effect of the assumption of linear change of δ in the recuperation process, we introduce a correction factor α varying from 0 to 1. Instead of setting δ to δeq for the initial and final points of each cycle (marked with squares), δ is reduced to δrevised = αδeq (marked with asterisks). α is adjusted by the trial-and-error method for different cavity positions to ensure δrevised is always below δeq, namely
We first present the results of thermodynamic parameters, including temperature, relative oxygen partial pressure, and the non-stoichiometric number of ceria in CRRs in the recuperation unit when a steady state is reached.
The temperature distribution of CRRs in the recuperation unit is depicted in Figure 10. The recuperation unit consists of a cascade of 20 CRR positions, and the indexing numbers i of the CRRs in the pre-cooling and pre-heating parts correspond to #1–10 and #11–20, respectively. For 1 ≤ i ≤ 10, the temperature of the CRR in #i position drops from
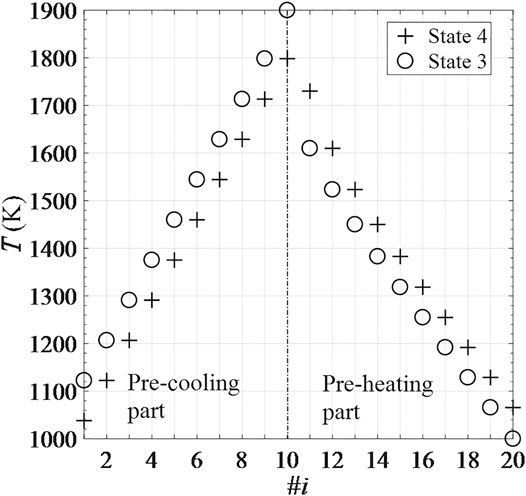
FIGURE 10. Temperature distribution of 20 recuperation CRRs corresponding to State 3 and State 4 of one cycle under steady conditions.
Figure 11 shows the thermodynamic parameters δ and
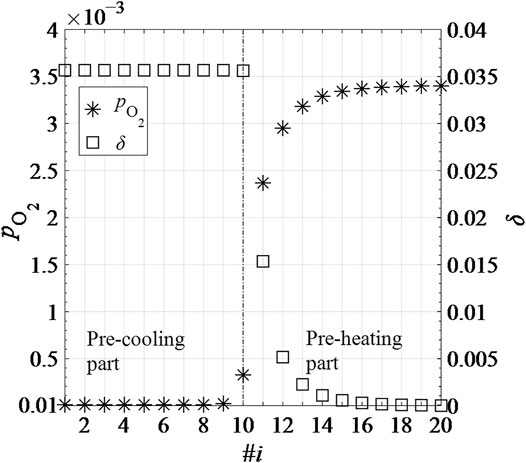
FIGURE 11. Thermodynamic parameters δ and
Here we present the results of sensitivity study relative to change of a single key parameter, including number of CRRs in the pre-cooling or pre-heating part, N, reduction temperature Tred, relative oxygen partial pressure at the end of reduction
According to Figure 12, εsolid and
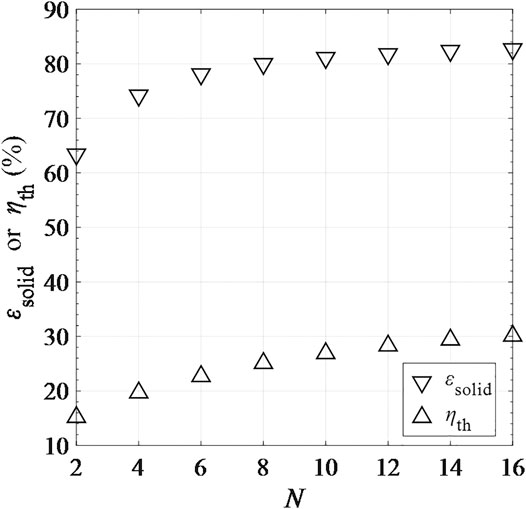
FIGURE 12. Solid-phase heat recovery effectiveness εsolid and total solar-to-fuel efficiency ηth as functions of number of CRRs in one side of the recuperation zone (the pre-cooling or pre-heating part), N.
Figure 13 shows the increase of hydrogen production rate per kilogram of ceria,
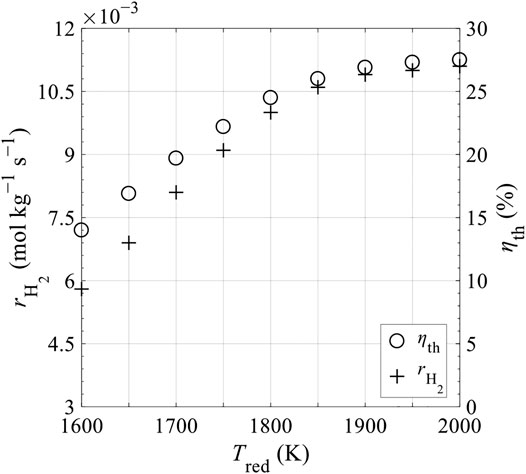
FIGURE 13. Hydrogen production rate per kilogram of ceria,
The relative oxygen partial pressure,
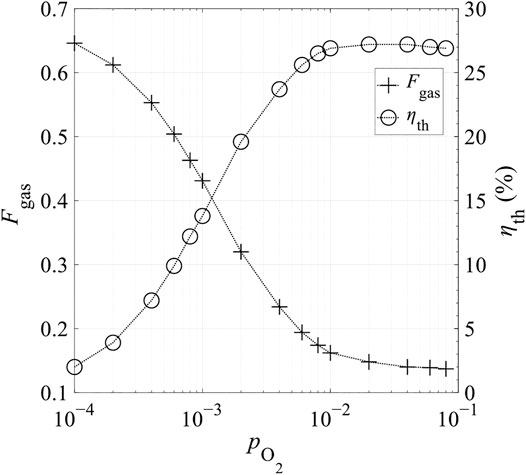
FIGURE 14. Heat loss fraction corresponding to gas-phase heat recovery, Fgas, and total thermal efficiency ηth as a function of relative oxygen partial pressure at the end of reduction,
Figure 15 shows the effects of the mass of RPC, mRPC, on reaction duration per cycle, τ, shifting frequency of reactor disk f = 1/τ, and thermal efficiency ηth. τ is proportional to mRPC, indicating that for higher mRPC, longer time is needed to finalize the reaction, and the required f is lower. Based on Figure 15, mRPC has little impact on ηth. Figures 16, 17 show the effects of C and N on ηth for selected values of Tred and assuming ε = 1. ηth is calculated based on selected Tred varying from 1600 to 2000 K in 50 K increments for a fixed
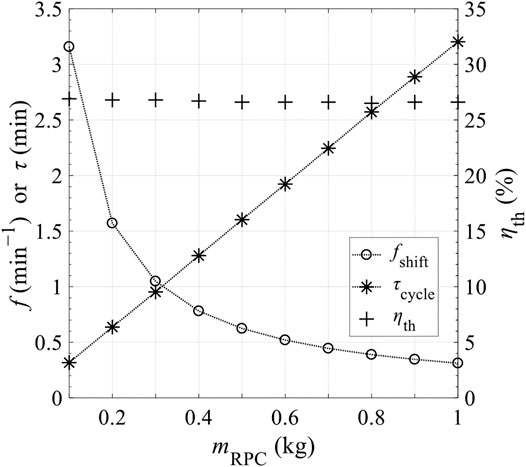
FIGURE 15. Shifting frequency of secondary mirror, f, or reaction duration, τ, and total solar-to-fuel efficiency, ηth, as a function of mass of ceria in CRR, mRPC.
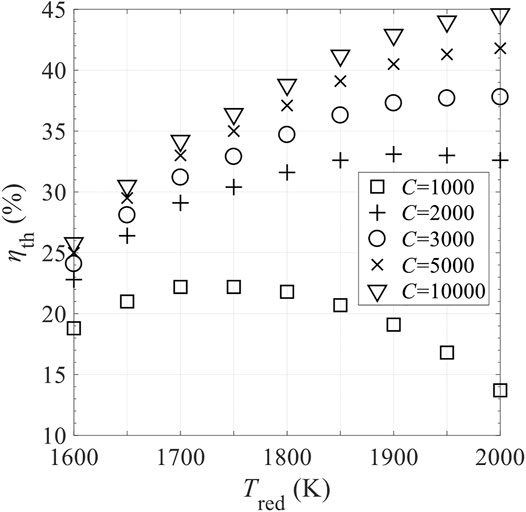
FIGURE 16. Effect of concentration ratio C on total solar-to-fuel efficiency ηth in different levels of reduction temperature, Tred, with perfect gas-phase heat recovery and relative oxygen partial pressure
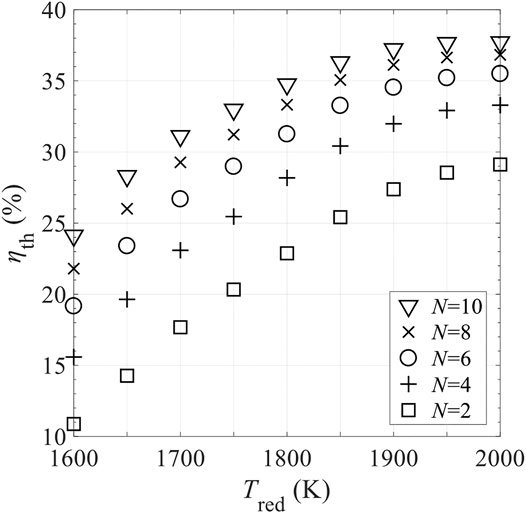
FIGURE 17. Effect of number of CRRs in the pre-cooling and pre-heating zones, N, on total solar-to-fuel efficiency ηth in different levels of reduction temperature, Tred, with perfect gas-phase heat recovery and relative oxygen partial pressure
Figure 18 shows the effects of ε on total solar-to-fuel efficiency, ηth, for selected
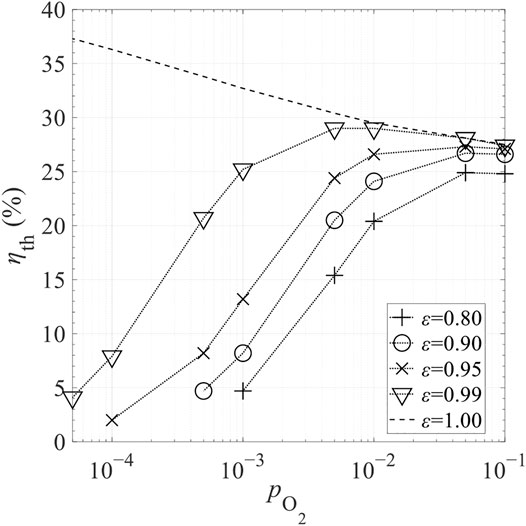
FIGURE 18. Effect of gas-phase heat transfer effectiveness, ε, on total solar-to-fuel efficiency ηth in different levels of relative oxygen partial pressure,
Figure 19 shows the contour map of ηth for selected ε varying from 0.81 to 0.99 and C from 1,000 to 4,000 at Tred = 1900 K and
where εmin, εmax and Cmin, Cmax are set to 0.8, 1 and 1,000, 4,000, respectively. The colored contour lines present the different levels of ηth. The gradient of ηth is given by
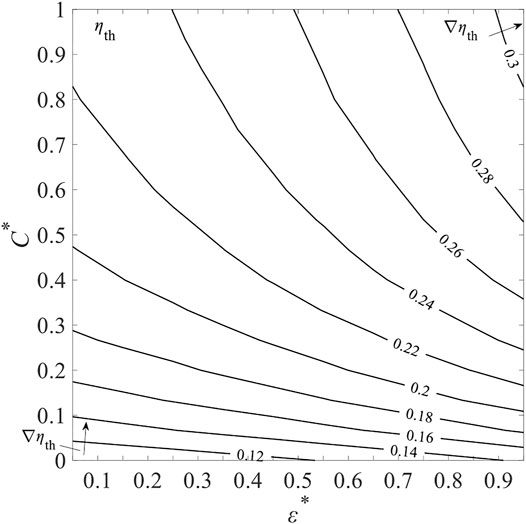
FIGURE 19. Total solar-to-fuel efficiency, ηth, as a function of non-dimensional gas-phase heat transfer effectiveness, ε*, and concentration ratio C* at fixed Tred = 1900 K and
As C∗ increases,
Figure 20 shows the contour map of ηth for selected Tred varying from 1,600 to 2,000 K and
where
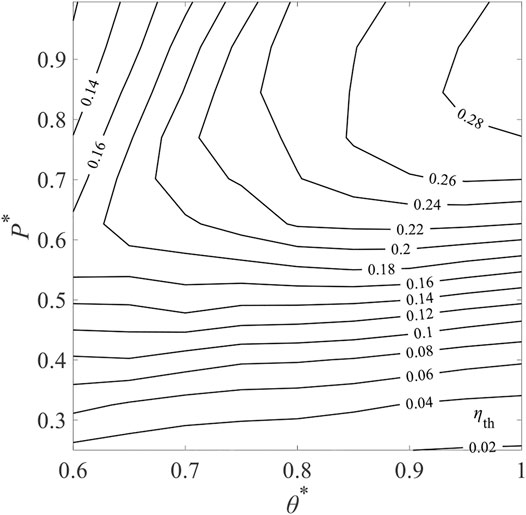
FIGURE 20. Contours of total solar-to-fuel efficiency, ηth in different levels of non-dimensional reduction temperature, θ∗, and relative oxygen partial pressure P∗ for ε = 0.95 and C = 3,000.
In this study, a conceptual fixed-bed solar thermochemical cavity receiver–reactor array has been proposed and numerically studied for water-splitting via ceria-based redox cycling. Heat recuperation was modeled by a linear matrix model while reduction and oxidation were modeled by a lumped parameter model. Thermal performance characterized by solid-phase heat recovery effectiveness and total solar-to-fuel efficiency was studied for selected parameters of the proposed system such as the reduction temperature, relative oxygen partial pressure, number of receiver–reactor, concentration ratio, and gas-phase heat recovery effectiveness.
Under the assumptions made in this study, the solid-phase heat recovery effectiveness and the total solar-to-fuel efficiency were found to be 80% and 27%, respectively, for the baseline system. Along with the pre-heating process, pre-reduction occurs simultaneously, resulting in ceria non-stoichiometry of 0.015. which was attributed to the dual function of N2 as HTF and oxygen scavenger during recuperation. A solar-to-fuel efficiency of 27% was found with a reduction temperature at 1,900 K and relative oxygen partial pressure of 0.01. The concentration ratio and gas-phase heat recovery effectiveness for the baseline case were assumed to be 3,000 and 0.95, respectively. A higher thermal efficiency can be achieved by increasing the total number of receiver–reactors.
Sensitivity analysis demonstrated that the solar-to-fuel efficiency is highly sensitive to the concentration ratio and the gas-phase heat recovery effectiveness at high reduction temperature and low relative oxygen partial pressure conditions. Increasing the concentration ratio and gas-phase heat recovery effectiveness simultaneously improves the system performance. The total solar-to-fuel efficiency was found to be 42% with a concentration ratio of 5,000 and perfect gas-phase heat recovery. In addition, for the baseline values of the concentration ratio and the gas-phase heat recovery effectiveness, the overall solar-to-fuel efficiency can be effectively increased by increasing relative oxygen partial pressure at low temperature or by increasing temperature at high relative oxygen partial pressure.
The raw data supporting the conclusions of this article will be made available by the authors, without undue reservation.
SY concept, analysis, writing. LL concept, writing. BW writing. SL writing, JW funding, supervision, writing PL writing WL funding, supervision, concept, writing.
This work was supported by the National Natural Science Foundation of China (No. 51736006), the Scientific Research Foundation of Graduate School of Southeast University (No. YBPY 1855), the China Scholarship Council (SY, Grant No. (2017)3109), the Australian Renewable Energy Agency (Grant No. 2014/RND005), and the Australian Research Council (Grant No. FT140101213).
The authors declare that the research was conducted in the absence of any commercial or financial relationships that could be construed as a potential conflict of interest.
0D, zero dimensional; CPC, compound parabolic concentrator; CRR, cavity receiver–reactor; DNI, direct normal irradiance; HTF, heat transfer fluid; HXer, heat-exchanger; LMM, linear matrix model; LPM, lumped parameter method; RPC, reticulated porous ceria; TR, tower reflector.
1A higher solar-to-fuel efficiency of 7.5% was reported by (Haeussler et al., 2020) where the realistic parasitic energy consumption is not accounted for.
2RPC and Al2O3-made containers have been successfully demonstrated in a series of solar thermochemical water/CO2 splitting systems. Assessment of potential materials issues is beyond the scope of this study.
3One phase difference represents the angle difference between two adjacent cavities:
4τ is omitted in the following text and equations for brevity.
Abanades, S., Legal, A., Cordier, A., Peraudeau, G., Flamant, G., and Julbe, A. (2010). Investigation of Reactive Cerium-Based Oxides for H2 Production by Thermochemical Two-step Water-Splitting. J. Mater. Sci. 45 (15), 4163–4173. doi:10.1007/s10853-010-4506-4
Bader, R., and Lipiński, W. (2017). “Solar thermal processing,” in Advances in Concentrating Solar Thermal Research and Technology, Woodhead Publishing Series in Energy. Editors M. J. Blanco, and L. R. Santigosa, (Berlin: Springer) 403–459.
Bader, R., Venstrom, L. J., Davidson, J. H., and Lipiński, W. (2013). Thermodynamic Analysis of Isothermal Redox Cycling of Ceria for Solar Fuel Production. Energy Fuels 27 (9), 5533–5544. doi:10.1021/ef400132d
Blank, D. A., and Wu, C. (1994). Power Potential of a Terrestrial Solar-Radiant Stirling Heat Engine. Int. J. Ambient Energ. 15 (3), 131–139. doi:10.1080/01430750.1994.9675645
Chueh, W. C., and Haile, S. M. (2010). A Thermochemical Study of Ceria: Exploiting an Old Material for New Modes of Energy Conversion and CO2 mitigationMathematical, Physical and Engineering Sciences 368. Philos. Trans. A. Math. Phys. Eng. Sci. 368, 3269–3294. doi:10.1098/rsta.2010.0114
Chueh, W. C., Falter, C., Abbott, M., Scipio, D., Furler, P., Haile, S. M., et al. (2010). High-Flux Solar-Driven Thermochemical Dissociation of CO2 and H20 Using Nonstoichiometric Ceria. Science 330 (6012), 1797–1801. doi:10.1126/science.1197834
Dähler, F., Wild, M., Schäppi, R., Haueter, P., Cooper, T., Good, P., et al. (2018). Optical Design and Experimental Characterization of a Solar Concentrating Dish System for Fuel Production via Thermochemical Redox Cycles. Solar Energy 170, 568–575. doi:10.1016/j.solener.2018.05.085
Diver, R. B., Miler, J. E., Siegel, N. P., and Moss, T. A. (2010). “Testing of a CR5 Solar Thermochemical Heat Engine Prototype,” in Proceedings of the ASME 2010 4th International Conference on Energy Sustainabilty Volume 2, 97–104.
El-Ehwany, A. A., Hennes, G. M., Eid, E. I., and El-Kenany, E. A. (2010). Development of the Performance of an Alpha-type Heat Engine by Using Elbow-bend Transposed-Fluids Heat Exchanger as a Heater and a Cooler. Energ. Convers. Manage. 52 (2), 1010–1019. doi:10.1016/j.enconman.2010.08.029
Ermanoski, I., Siegel, N. P., and Stechel, E. B. (2013). A New Reactor Concept for Efficient Solar-Thermochemical Fuel Production. J. Sol. Energy Eng. 135 (3), 031002. doi:10.1115/1.4023356
Falter, C. P., Sizmann, A., and Pitz-Paal, R. (2015). Modular Reactor Model for the Solar Thermochemical Production of Syngas Incorporating Counter-flow Solid Heat Exchange. Sol. Energy 122, 1296–1308. doi:10.1016/j.solener.2015.10.042
Furler, P., Scheffe, J., Gorbar, M., Moes, L., Vogt, U., and Steinfeld, A. (2012a). Solar Thermochemical CO2 Splitting Utilizing a Reticulated Porous Ceria Redox System. Energy Fuels 26 (11), 7051–7059. doi:10.1021/ef3013757
Furler, P., Scheffe, J. R., and Steinfeld, A. (2012b). Syngas Production by Simultaneous Splitting of H2O and CO2 via Ceria Redox Reactions in a High-Temperature Solar Reactor. Energy Environ. Sci. 5 (3), 6098–6103. doi:10.1039/c1ee02620h
Haeussler, A., Abanades, S., Julbe, A., Jouannaux, J., and Cartoixa, B. (2020). Solar Thermochemical Fuel Production from H2O and CO2 Splitting via Two-step Redox Cycling of Reticulated Porous Ceria Structures Integrated in a Monolithic Cavity-type Reactor. Energy 201, 117649. doi:10.1016/j.energy.2020.117649
Hao, Y., Yang, C.-K., and Haile, S. M. (2014). Ceria-Zirconia Solid Solutions (Ce1-xZrxO2−δ, X ≤ 0.2) for Solar Thermochemical Water Splitting: A Thermodynamic Study. Chem. Mater. 26, 6073–6082. doi:10.1021/cm503131p
Häring, H. W. (2008). The Air Gases Nitrogen, Oxygen and Argon, Industrial Gases Processing. Hoboken: John Wiley & Sons, 9–109.
Hathaway, B. J., Bala Chandran, R., Gladen, A. C., Chase, T. R., and Davidson, J. H. (2016). Demonstration of a Solar Reactor for Carbon Dioxide Splitting via the Isothermal Ceria Redox Cycle and Practical Implications. Energy Fuels 30, 6654–6661. doi:10.1021/acs.energyfuels.6b01265
Lapp, J., Davidson, J. H., and Lipiński, W. (2013). Heat Transfer Analysis of a Solid-Solid Heat Recuperation System for Solar-Driven Nonstoichiometric Redox Cycles. J. Sol. Energy Eng. 135 (3), 031004. doi:10.1115/es2012-91078
Lapp, J., Davidson, J. H., and Lipiński, W. (2012). Efficiency of Two-step Solar Thermochemical Non-stoichiometric Redox Cycles with Heat Recovery. Energy 37, 591–600. doi:10.1016/j.energy.2011.10.045
Lapp, J., and Lipiński, W. (2014). Transient Three-Dimensional Heat Transfer Model of a Solar Thermochemical Reactor for H2O and CO2 Splitting via Nonstoichiometric Ceria Redox Cycling. J. Sol. Energy Eng. 136 (3), 031006. doi:10.1115/1.4026465
Li, L., Coventry, J., Bader, R., Pye, J., and Lipiński, W. (2016). Optics of Solar Central Receiver Systems: a Review. Opt. Express 24 (14), A985–A1007. doi:10.1364/oe.24.00a985
Li, L., Wang, B., Pye, J., and Lipiński, W. (2020a). Temperature-based Optical Design, Optimization and Economics of Solar Polar-Field Central Receiver Systems with an Optional Compound Parabolic Concentrator. Sol. Energy 206, 1018–1032. doi:10.1016/j.solener.2020.05.088
Li, L., Yang, S., Wang, B., Pye, J., and Lipiński, W. (2020b). Optical Analysis of a Solar Thermochemical System with a Rotating tower Reflector and a Receiver-Reactor Array. Opt. Express 28, 19429–19445. doi:10.1364/oe.389924
Li, S., Wheeler, V. M., Kreider, P. B., Bader, R., and Lipiński, W. (2018a). Thermodynamic Analyses of Fuel Production via Solar-Driven Non-stoichiometric Metal Oxide Redox Cycling. Part 2. Impact of Solid-Gas Flow Configurations and Active Material Composition on System-Level Efficiency. Energy Fuels 32 (10), 10848–10863. doi:10.1021/acs.energyfuels.8b02082
Li, S., Wheeler, V. M., Kreider, P. B., and Lipiński, W. (2018b). Thermodynamic Analyses of Fuel Production via Solar-Driven Non-stoichiometric Metal Oxide Redox Cycling. Part 1. Revisiting Flow and Equilibrium Assumptions. Energy Fuels 32 (10), 10838–10847. doi:10.1021/acs.energyfuels.8b02081
Li, S., Wheeler, V. M., Kumar, A., Venkataraman, M. B., Muhich, C. L., Hao, Y., et al. (2021). Thermodynamic Guiding Principles for Designing Non-stoichiometric Redox Materials for Solar Thermochemical Fuel Production: Ceria, Perovskites, and beyond. Energy Technol. 14, 2000925. doi:10.1002/ente.202000925
Marxer, D., Furler, P., Takacs, M., and Steinfeld, A. (2017). Solar Thermochemical Splitting of CO2 into Separate Streams of CO and O2 with High Selectivity, Stability, Conversion, and Efficiency. Energ. Environ. Sci. 10, 1142–1149. doi:10.1039/c6ee03776c
Miller, J. E., McDaniel, A. H., and Allendorf, M. D. (2014). Considerations in the Design of Materials for Solar-Driven Fuel Production Using Metal-Oxide Thermochemical Cycles. Adv. Energ. Mater. 4, 1300469. doi:10.1002/aenm.201300469
Muhich, C. L., Blaser, S., Hoes, M. C., and Steinfeld, A. (2018). Comparing the Solar-To-Fuel Energy Conversion Efficiency of Ceria and Perovskite Based Thermochemical Redox Cycles for Splitting H2O and CO2. Int. J. Hydrogen Energ. 43, 18814–18831. doi:10.1016/j.ijhydene.2018.08.137
Muhich, C. L., Ehrhart, B. D., Al-Shankiti, I., Ward, B. J., Musgrave, C. B., and Weimer, A. W. (2016). A Review and Perspective of Efficient Hydrogen Generation via Solar thermal Water Splitting. Wires Energ. Environ. 5 (3), 261–287. doi:10.1002/wene.174
Panlener, R. J., Blumenthal, R. N., and Garnier, J. E. (1975). A Thermodynamic Study of Nonstoichiometric Cerium Dioxide. J. Phys. Chem. Sol. 36 (11), 1213–1222. doi:10.1016/0022-3697(75)90192-4
Qian, X., He, J., Mastronardo, E., Baldassarri, B., Yuan, W., Wolverton, C., et al. (2021). Outstanding Properties and Performance of CaTi0.5Mn0.5O3-δ for Solar-Driven Thermochemical Hydrogen Production. Matter 4 (2), 688–708. doi:10.1016/j.matt.2020.11.016
Siegel, N. P., Miller, J. E., Ermanoski, I., Diver, R. B., and Stechel, E. B. (2013). Factors Affecting the Efficiency of Solar Driven Metal Oxide Thermochemical Cycles. Ind. Eng. Chem. Res. 52 (9), 3276–3286. doi:10.1021/ie400193q
Steinfeld, A. (2019). Concentrated Solar Energy - the Path for Efficient thermal Conversion to Power and Fuels. Sci. Bull. 64 (8), 485–486. doi:10.1016/j.scib.2019.04.012
Steinfeld, A., Furler, P., Haselbacher, A., and Geissbühler, L. (2019). A Thermochemical Reactor System for a Temperature Swing Cyclic Process with Integrated Heat Recovery and a Method for Operating the Same. Google Patents.
Steinfeld, A. (2005). Solar Thermochemical Production of Hydrogen-A Review. Solar Energy 78 (5), 603–615. doi:10.1016/j.solener.2003.12.012
Sun-to-liquid (2020). Available at: https://www.sun-to-liquid.eu/(Accessed September 10, 2020).
Venstrom, L. J., De Smith, R. M., Bala Chandran, R., Boman, D. B., Krenzke, P. T., and Davidson, J. H. (2015). Applicability of an Equilibrium Model to Predict the Conversion of CO2 to CO via the Reduction and Oxidation of a Fixed Bed of Cerium Dioxide. Energy Fuels 29, 8168–8177. doi:10.1021/acs.energyfuels.5b01865
Wang, B., Li, L., Pottas, J. J., Bader, R., Kreider, P. B., Wheeler, V. M., et al. (2020). Thermal Model of a Solar Thermochemical Reactor for Metal Oxide Reduction. J. Sol. Energy Eng. 142 (5), 051002. https://doi.org/10.1115/1.4046229
Wang, B., Li, L., Schäfer, F., Pottas, J. J., Kumar, A., Wheeler, V. M., et al. (2021). Thermal Reduction of Iron-Manganese Oxide Particles in a High-Temperature Packed-Bed Solar Thermochemical Reactor. Chem. Eng. J. 412 (C), 128255. doi:10.1016/j.cej.2020.128255
Welte, M., Barhoumi, R., Zbinden, A., Scheffe, J. R., and Steinfeld, A. (2016). Experimental Demonstration of the Thermochemical Reduction of Ceria in a Solar Aerosol Reactor. Ind. Eng. Chem. Res. 55, 10618–10625. doi:10.1021/acs.iecr.6b02853
Yuan, C., Jarrett, C., Chueh, W., Kawajiri, Y., and Henry, A. (2015). A New Solar Fuels Reactor Concept Based on a Liquid Metal Heat Transfer Fluid: Reactor Design and Efficiency Estimation. Sol. Energy 122, 547–561. doi:10.1016/j.solener.2015.08.019
C concentration ratio
cp specific heat at constant pressure, kJ kg−1 K−1
cv specific heat at constant volume, kJ kg−1 K−1
F heat loss fraction
f shifting frequency, min−1
ΔT temperature difference Tred −Tox, K
M molar mass, kg mol−1
m mass, kg
n amount of substance, mol
N cavity number in the pre-cooling (or pre-heating) part of recuperation zone
p pressure, Pa
P∗ non-dimensional oxygen partial pressure defined in Eq. 28
Q heat, kJ
T temperature, K
r gas flow rate per unit mass of ceria, kg s−1 kgceria−1
α correction factor
ε heat recovery effectiveness
β non-dimensional number defined in Eq. 20
γ non-dimensional number defined in Eq. 20
δ non-stoichiometry
ε∗ non-dimensional heat recovery effectiveness defined in Eq. 27
ηth solar-to-fuel efficiency
θ∗ non-dimensional reduction temperature defined in Eq. 28
ξ non-dimensional number defined in Eq. 22
τ reaction duration per cycle, min
Δτ time step, s
χ relaxation factor
Δδ change in non-stoichiometry
H high
HX heat exchange
L low
chem chemical item
gas gas-phase transport heat loss
fuel fuel
input input
other other heat loss
ox oxidation
quench quenching heat loss
rad radiative heat loss
recovery recovery of conductive heat loss
red reduction
ref reference
reject rejecting heat loss
shift shifted from the previous phase
solar solar energy
solid solid-phase
trans transport item
∞ ambient
Keywords: solar thermochemistry, water splitting, non-stoichiometry, cerium oxide, heat recovery
Citation: Yang S, Li L, Wang B, Li S, Wang J, Lund P and Lipiński W (2021) Thermodynamic Analysis of a Conceptual Fixed-Bed Solar Thermochemical Cavity Receiver–Reactor Array for Water Splitting Via Ceria Redox Cycling. Front. Energy Res. 9:565761. doi: 10.3389/fenrg.2021.565761
Received: 26 May 2020; Accepted: 12 May 2021;
Published: 24 June 2021.
Edited by:
Alfonso Chinnici, University of Adelaide, AustraliaReviewed by:
Limei Shen, Huazhong University of Science and Technology, ChinaCopyright © 2021 Yang, Li, Wang, Li, Wang, Lund and Lipiński. This is an open-access article distributed under the terms of the Creative Commons Attribution License (CC BY). The use, distribution or reproduction in other forums is permitted, provided the original author(s) and the copyright owner(s) are credited and that the original publication in this journal is cited, in accordance with accepted academic practice. No use, distribution or reproduction is permitted which does not comply with these terms.
*Correspondence: Wojciech Lipiński, d29qY2llY2gubGlwaW5za2lAYW51LmVkdS5hdQ==; Jun Wang, d2otandAc2V1LmVkdS5jbg==
Disclaimer: All claims expressed in this article are solely those of the authors and do not necessarily represent those of their affiliated organizations, or those of the publisher, the editors and the reviewers. Any product that may be evaluated in this article or claim that may be made by its manufacturer is not guaranteed or endorsed by the publisher.
Research integrity at Frontiers

Learn more about the work of our research integrity team to safeguard the quality of each article we publish.