 Lin Sun
 Minjun Peng2
95% of researchers rate our articles as excellent or good
Learn more about the work of our research integrity team to safeguard the quality of each article we publish.
Find out more
ORIGINAL RESEARCH article
Front. Energy Res. , 09 February 2021
Sec. Nuclear Energy
Volume 8 - 2020 | https://doi.org/10.3389/fenrg.2020.613852
This article is part of the Research Topic Nuclear Power Plant Equipment Prognostics and Health Management Based on Data-driven methods View all 12 articles
In nuclear reactor system research, the multiscale coupled thermal-hydraulic (T-H) system code and CFD code is one of the most prevalent research areas, and it could help improve simulation fidelity and optimize nuclear reactor design. Additionally, a new idea known as the function fitting method (FFM) for coupling parameter distribution has been newly proposed for exchanging data on the coupling interface, which uses math equations to present the velocity distribution characteristics at the coupling interface. This method could improve the simulation error and numerical instability. To verify and validate the abovementioned FFM, a comparison between the velocity function shape by FFM and real velocity distribution was completed. Besides, the Edwards pipe blowdown test results were used to verify the coupled code. The results showed good agreement with experiment results, and a better simulation accuracy compared to previous work. The current work will establish the ability to explore multiscale coupled thermal-hydraulic operation characteristics which permit precise local parameter distribution.
Nuclear safety is a top priority for nuclear power application and expansion. Estimate tools for increasing safety analysis and evaluation requirements need to become better and more precise. In the past few decades, on a system scale, the best estimate codes such as RELAP5 (Allison et al., 1993), RETRAN (McFadden et al., 1981), CATHARE (Barre and Bernard, 1990), and MARS (Jeong et al., 1999) have dominated nuclear reactor operation, safety analysis, and severe accident analysis. However, these codes can only present one-dimensional transient system behaviors, which can not provide the local characteristics of the reactor. As computational resources have dramatically developed, component scale analysis codes like COBRA (Stewart et al., 1977), RELAP5-3D (RELAP5-3D Code, 2012), VIPRE (Stewart et al., 1989), and local scale codes such as Fluent (Rohde et al., 2007), CFX (Höhne et al., 2010), and Star-CCM+ (Cardoni, 2011) have emerged. These computational fluid dynamic (CFD) codes can provide three-dimensional features, which have been applied in pressurized thermal shock (PTS) (Egorov et al., 2004), boron dilution and distribution in reactor vessels (Muhlbauer, 2003; Scheuerer et al., 2005), and so on. The above CFD application has faced the challenge of the computational cost of transient safety analysis. To conquer these difficulties, a compromised method of developing coupled codes based on system and CFD codes has been promoted.
Ronnie Andersson (Andersson et al., 2004) utilized a system and CFD code to analyze turbulence intensity and dissipation on multiphase flow in the reactor. Daniele Martelli (Martelli et al., 2017) coupled RELAP5/MOD3.3 and Fluent to simulate a NACIE experiment loop and loss of flow accident, which was in good agreement with experiment data. J-J. Jeong (Jeong et al., 1999) developed an integral modular code MARS coupled RELAP5 and sub-channel COBRA code, which adopted a semi-implicit method and dynamic memory allocation method. W. L. Weaver (Weaver et al., 2002; Weaver, 2005) developed a series of studies coupling RELAP5-3D and CFX, D.L. Aumiller (Aumiller et al., 2001; Aumiller et al., 2002) further coupled RELAP5-3D and CFD-FLOW3D based on the parallel virtual machine (PVM) method, both studies used the Edwards blowdown test to conduct the verification and validation (V&V) process. Nolan Anderson (Anderson, 2006; Anderson et al., 2008) also developed RELAP-3D and Fluent coupled code using PVM, for Very High Temperature Reactor (VHTR) lower plenum analysis.
The existing coupled code development technologies mainly include PVM, dynamic link library (DLL) (Li et al., 2014), and boundary files modification methods. Challenges in the coupling process (Ivanov and Avramova, 2007) mainly concern the method of coupling, coupling approach, spatial mesh overlays, time step algorithms, and coupling numeric and convergence schemes. Spatial mesh mapping, especially the data exchange at the coupling interface plays a key role in simulation accuracy and numerical convergence. Therefore, in this paper, a new method called the function fitting method (FFM) for coupling parameter distribution was proposed for coupling RELAP5 and Fluent, aiming at providing precise data exchange. An Edwards pipe blowdown test was used to verify and validate the coupled code.
For multiscale coupled thermal-hydraulic code, the kinds of variables that are transferred through the coupling interface must be considered as priority. The RELAP5 code sets the boundary conditions through time-dependent control volume (TMDPVOL) and time-dependent junction (TMDPJUN); while Fluent has a predetermined velocity-inlet, pressure-outlet, and outflow boundary conditions, etc.
Assuming that the control volume Ri (RELAP5-interface) is connected to the coupling interface between Fluent and RELAP5, the mass and energy conservation equations are solved in the control volume Ri. The junction j is also connected to Fluent and RELAP5, then the momentum conservation equation is solved in junction j, and the vector variables are stored in j (as shown in Figure 1). In fact, the RELAP5 interface control volume Ri and the junction j do not have realistic components in the RELAP5 system; its main function is to be used as a coupling interface, which is also known as a “ghost cell.” This coupling interface is an overlapped computational domain.
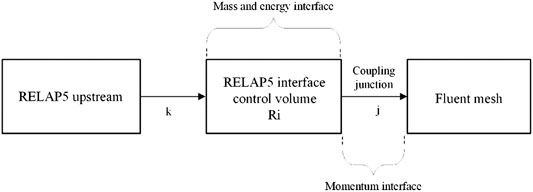
FIGURE 1. The coupling interface control volumes between RELAP5 and Fluent.
Under this scenario, the downstream Fluent computational mesh is regarded as the downstream control volume of the RELAP5 portion, and the abovementioned mass, energy, and momentum conservation equations can be derived in the following forms:
where, P is the pressure and v is the fluid velocity. While, the subscript g and f stand for gas and fluid, respectively. The superscript n and n + 1 represent the current and next time step.
Coefficients b, g1, g2, f1, and f2 are column vectors, these coefficient vectors are known variables under the current time step n. b is the source term in the equation, and the coefficient matrices g and f represent the convection effect. A′, B′, C′, and D′ are coefficients that contain only the current time step variable.
The exchange variables between RELAP5 and Fluent codes are listed in the following Table 1.
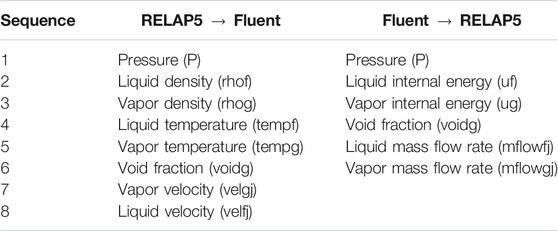
TABLE 1. Data transfer between RELAP5 and Fluent.
The data transfer between the coupling interface is bidirectional. While, Fluent passes parameters to RELAP5, which can be calculated by surface summation or averaging. For the mass flow rate, the sum of the Fluent surface cells is equal to that of the RELAP5 interface.
where, W is the mass flow rate and Nc stands for the Fluent cell numbers on the coupling interface.
Other variables like temperature, pressure, and void fraction, are represented by Φ, and can be described as follow:
where, Ai is the area of cell surface i.
For parameters passed from RELAP5 to Fluent, one-dimensional parameters obtained by the lumped parameter method of RELAP5 will be converted into the two-dimensional distribution of the Fluent interface. In past research, these data were generally averaged on the interface, but this method introduces errors into each calculation iteration. While, in some studies, the coupling boundary is set further afield so that it is far enough to minimize uneven effects on the interface. However, these two methods do not solve the different dimensional transformation problem of the coupling parameters. Therefore, in this paper, we worked on solving this issue by proposing a function fitting method for interface data.
For nuclear power systems and equipment, most fluid areas are round tubes, such as pipes and fluid machinery (pumps, valves, etc.,). For the application of the RELAP5/CFD coupled code, the primary system and safety system are modeled by one-dimensional system codes to obtain the transient characteristics. However, the pressure vessel, lower plenum, and the core are modeled by the three-dimensional CFD code Fluent. The connection between the system and the local equipment are mostly long round tubes, and the fluid flow therein can be considered fully developed. The flow and heat transfer of single-phase and two-phase fluids for round tubes have been widely studied. Therefore, in this paper, the function fitting method (FFM) for coupling parameter distribution was proposed. This method can accurately convert the one-dimensional lumped variables into two-dimensional ones that satisfy the corresponding physical laws, thereby effectively improving the error of calculation instability and accelerating calculation convergence.
The original intention of this method was to transfer the one-dimensional parameters into the two-dimensional surface ones through appropriate function fitting, and accurately reflect the real distribution. Therefore, for Newtonian viscous fluids, there are many mature empirical formulas for one-dimensional flow, and they can be used as one of the independent variables of the fitting function.
For the fully developed single phase turbulent flow in a round tube, the velocity distribution is relatively flat in the middle. While, in the viscous bottom layer near the wall surface, the velocity distribution changes sharply and the velocity gradient is relatively large. For the velocity distribution in the tube flow, the most influential factor is the Reynolds number and position. The flow velocity distribution function fitting method mainly considers the influence by friction coefficient and relative position.
The empirical formulas for the widely recognized turbulent flow frictional resistance coefficient are listed in Table 2.
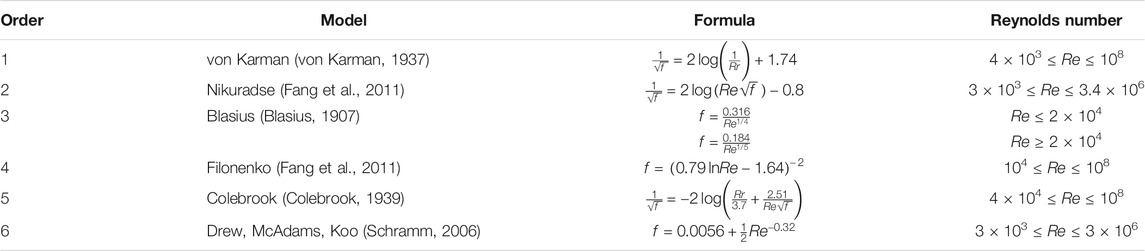
TABLE 2. Single phase turbulent flow friction factor in round pipe.
Rr in Table 2 is the relative roughness. The friction coefficient calculations for the Nikuradse and Colebrook models in the table are implicit, that is, f appears on both sides of the equation; therefore, either the equation is iteratively solved, or the solution is interpolated in the Moody diagram (Moody, 1944). These solution methods are very inconvenient (Haaland, 1983). Therefore, in the function fitting method, it is preferred to select the simple and accurate explicit friction coefficient calculation as one of the independent variables. After a large number of experiments, the Filonenko model was chosen because it is applicable in a wider range of Reynolds numbers. Besides, in related research, the experiments of scholars Romeo (Romeo et al., 2002), Fang (Fang et al., 2011), and Yıldırım (Yıldırım, 2009) have verified that this model is more accurate among the explicit friction relationship.
The function fitting method is also related to the position of the one-dimensional grid to the two-dimensional grid spatial mapping. Therefore, for the round tube coupling interface, the radial position of the round tube is selected as another independent variable. According to the characteristics of the flatness of the central cross-section, and the steep edge, the fitted mathematical function should also have the above characteristics.
The simplest and most straightforward method of the fitting function is to use piecewise polynomial fitting. However, the function obtained by this method requires multiple constraints, which is not suitable for practical application. In elementary functions, logarithmic function has the characteristics of rapid transition in the normalized (0–1) interval. Therefore, the fitting function must contain a logarithmic function term, which also requires the consideration of relative distance.
The term related to the friction coefficient is in the form of the polynomial and power function. The determination of the index needs to be verified by a large number of calculations, so that the obtained function conforms to the flow velocity distribution under different flow Reynolds numbers.
Finally, the conversion formula for the function fitting method is:
where, F is the fitting function, r is the distance from the central axial line, and R is the inner radius.
The f in Eq. 7 is the friction coefficient. Here, the Filonenko model is selected, namely:
The coupling parameter velocity conversion from the system code RELAP5 to the CFD code Fluent can be expressed as:
where,
In addition, for the coupling process between different thermal-hydraulic codes, attention should also be paid to the conservation of the coupling parameters. Especially for the coupling parameter distribution function fitting method, it is necessary to assure that the integral flow on the Fluent interface is equal to the total flow at the RELAP5 coupling junction, as follows:
where, Wj is the mass flow rate at the RELAP5 coupling junction and A is the area of the Fluent coupling interface.
In order to verify and validate the accuracy of the function fitting method proposed in the previous section, Fluent was used to analyze the flow in a round tube under different conditions. Besides, the results have been compared with the fitting function under the corresponding Reynolds number. Since the independent and dependent variables of the fitting function are dimensionless, in the CFD verification, the corresponding size and speed are also normalized accordingly. A horizontal tube with a length of 500 mm and an inner diameter of 10 mm was chosen; and the velocity distribution at the center of the tube was compared with the fitting function. The selected pressure, temperature, flow rate, and corresponding Reynolds number were included within the pressurized water reactor (PWR) operation and accident conditions. The specific verification conditions are shown in Table 3.
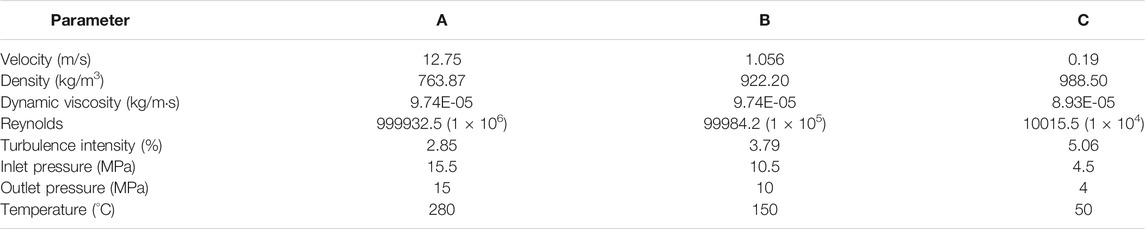
TABLE 3. Verification experiment conditions in horizontal round pipe.
In this V&V work, in order to accurately simulate the flow features in the boundary layer, the y plus value was confirmed as 30; the wall surface was divided into 20 boundary layers, the grid thickness of the first layer of the boundary layer was calculated to be 7 × 10⁻⁴ mm, and the growth ratio was 1.1. The mesh cross section is shown in Figure 2.
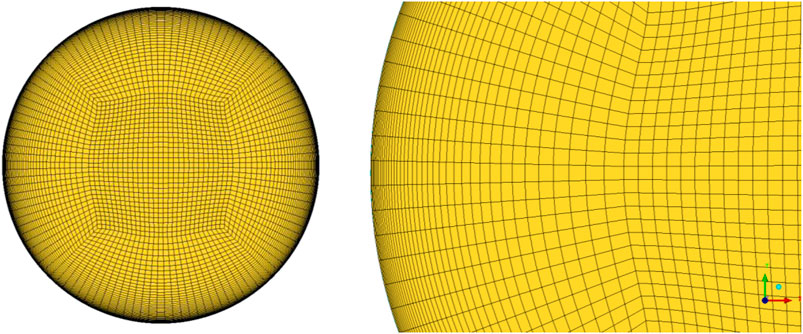
FIGURE 2. Boundary layer mesh configuration on the cross section of the round pipe.
In Figure 3, the normalized velocity distribution is compared between the fitting function and Fluent results. Under different pressures, temperatures, velocities, and Reynolds numbers, the fitting function represented accurate results to prove its applicability. The x-axis of the fitting function was in a relative position to the axial center, and the y-axis was the normalized velocity, which determined that this function was not constrained by specific size.
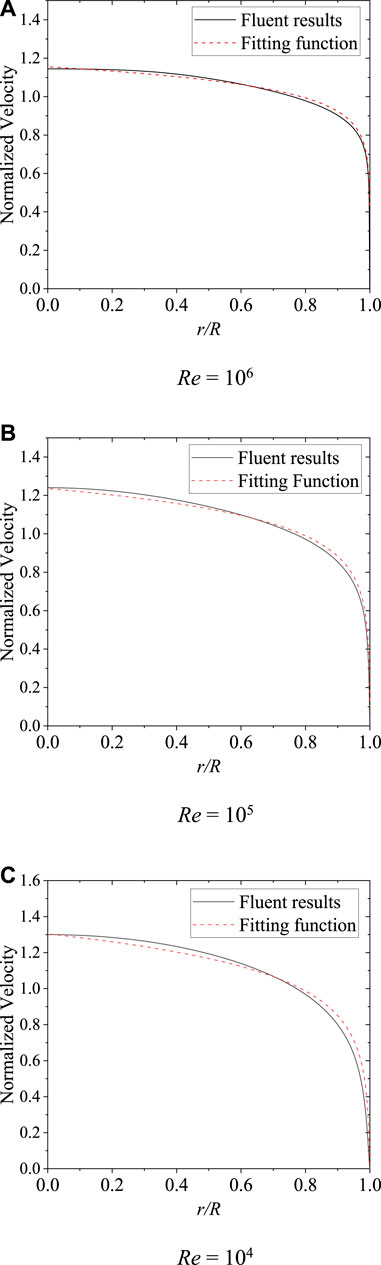
FIGURE 3. Comparison of the fitting function and Fluent results. (A)Re = 106. (B)Re = 105. (C)Re = 104.
In this paper, the Edwards pipe blowdown test was chosen to validate the multiscale coupled one dimensional (1D) and three dimensional (3D) code.
The original intention of the Edwards pipeline blowdown test was to simulate the phase change process in the safety analysis of the water-cooled reactor, which is very similar to the coolant loss process of the PWR loss of coolant accident (LOCA). The experimental facility contained a heating pipe filled with water, and the pressure was maintained above the saturation point. Before the glass plate at the end of the pipe was broken, the pressure was adjusted to the required level. During the blowdown test, measurement gauge stations were set up along the pipeline, with which pressure, temperature, and density changes were measured.
Before the blowdown process, the horizontal pipe was filled with supercooled water (602.15 K, 7.0 MPa). The ambient temperature was 293.15 K, and the ambient pressure was atmospheric pressure. The pipe was 4.096 m long and had an inner diameter of 73.15 mm. The design pressure of the pipeline was 17.2 MPa, and the design temperature was 616.5 K. The initial experimental pressure ranged from 3.55 to 17.34 MPa, and the temperature ranged from 514.8 to 616.5 K. The experiment layout is shown in Figure 4. The end of the pipe was the blowdown section, sealed by a toughened glass disc, the diameter of the glass disc was 88.9 mm, and the thickness was 12.7 mm. At the beginning of the experiment, the glass disc was ruptured by the lead pellet from a compressed air gun, and the water in the pipe was discharged into the environment. The reduction in the spray area accounted for 13% of the pipe cross-sectional area. A total of seven measuring gauge stations (GS1-GS7) were set up along the axial direction of the pipeline, and each was equipped with a facility for fitting fast response pressure and temperature transducers. The pipe was heated electrically with sheathe band heaters, formed to the curvature of the pipe. They covered approximately 70% of the pipe circumference and each had a capacity of 700 watts. Heat losses were reduced by using asbestos insulation.
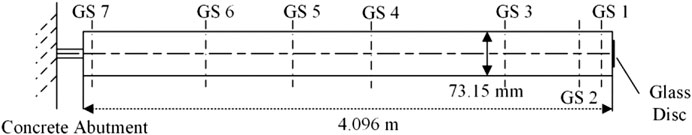
FIGURE 4. Edwards blowdown test.
In order to verify the RELAP5/Fluent coupled code, the Edwards pipe blowdown test was used as the benchmark problem in this paper. Meanwhile, the standalone RELAP5 code and other scholar’s coupled code results (Li et al., 2014) were compared with our work.
The standalone RELAP5 model nodalization is shown in Figure 5, in which the pipe component 003 PIPE stands for the experiment pipe, and the single junction component 004 SNGJUN connects the experiment pipe and rupture boundary. The time-dependent volume component 005 stands for the ruptured end of the pipe and also provides boundary conditions for the simulation. In RELAP5, the bubble radius change rate in the flash evaporation process is based on the Plesset-Zwick model (Plesset and Zwick, 1954), and the corresponding Nusselt solution is based on the Lee-Rypley model (Lee and Ryley, 1968):
where, the subscript b represents bubbles.
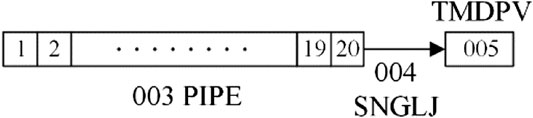
FIGURE 5. RELAP5 nodalization of the Edwards blowdown test.
In the coupled code analysis, the Edwards pipeline simulation model was divided into two parts along the axial direction. The upstream was modeled by Fluent, and the downstream to the end of the pipeline was simulated by RELAP5 (as shown in Figure 6). The downstream RELAP5 part contained 10 mass and energy control volumes, and nine momentum junctions among each control volume. Since the Edwards blowdown test is a strong transient process, the maximum time step of RELAP5 was set to 0.0001 s. In each time step, the inlet boundary of RELAP5 provided the pressure, temperature, and void fraction to the outlet boundary of Fluent; the Fluent returned the void fraction, pressure, temperature, and mass flow rate of the gas and liquid phase inlet boundary condition of RELAP5.
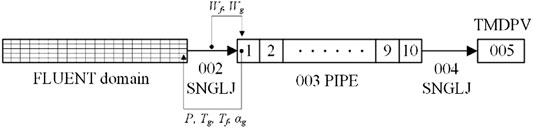
FIGURE 6. RELAP5/Fluent coupling scheme for the Edwards pipe test.
For the Fluent calculation part, the two-phase Euler model was adopted for the multiphase flow simulation, and a bubble diameter dbubble = 1 mm. The thermal phase change model was adopted for the rapid and intense evaporation-condensation process (ANSYS, 2015). The water properties were based on the National Institute of Standards and Technology (NIST) compressible gas model, which was important to capture the spread of pressure waves.
The Edwards pipe blowdown test process can be divided into two periods: one is the rapid pressure discharge period caused by the single-phase water loss, and the other is the slower pressure discharge period by the loss of the two-phase mixture. The first period happens almost instantaneously, at approximately 2 ms. The second period continues until the pressure is discharged close to the environment pressure.
Figure 7 shows the pressure variation of the GS-5. After the blowdown started, the pressure dropped sharply due to the rapid loss of relatively high-density supercooled water until saturation conditions were reached. The pressure drop during the discharge phase of the two-phase mixture was compensated by vapor generation. The pressure results simulated by the coupled Fluent/RELAP5 code was in good agreement with the Edwards pipeline test results (Edwards and O’Brien, 1970). The maximum deviation was 0.26 MPa, which corresponds to an error of 18.4% from the experiment results, which is acceptable for two-phase transient flow. The pressure results simulated by the coupled code was higher than the experiment and RELAP5 results. It is worth mentioning that the prediction of coupled analysis is not restricted by independent RELAP5. Compared with the coupled code with a simple boundary condition treatment from other papers, our results were closer to the experiment results.
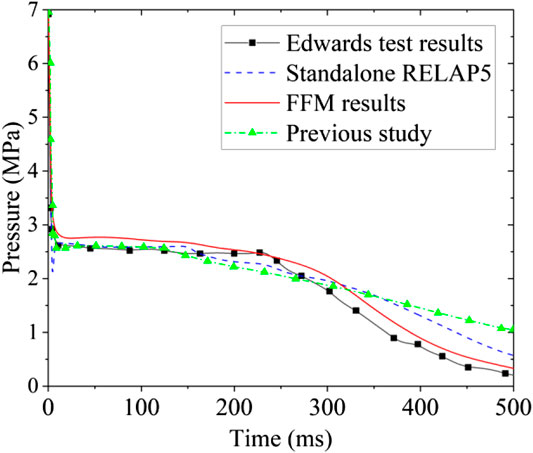
FIGURE 7. Comparison of the pressure at GS-5.
Figure 8 shows the pressure variation at GS-7. The coupled code results were within a reasonable range compared to the experiment results. In 0–250 ms, the simulation results of the coupled code were close to the experimental results, after which the simulation results were higher than the experiment ones. The maximum pressure deviation between the coupled code and the test results was 0.41 MPa, and the corresponding error was 28%. The pressure drop process simulated by the Fluent/RELAP5 coupled code and the standalone RELAP5 code began earlier than in the experiment. This phenomenon was partly due to the thermal phase change flashing model in the Fluent code. Its flashing rate was determined by the temperature difference between each phase and their corresponding saturation temperature, which led to a faster pressure drop.
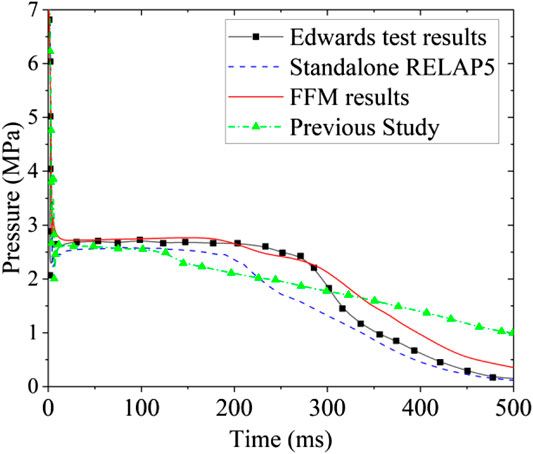
FIGURE 8. Comparison of the pressure at GS-7.
Figure 9 shows void fraction variation at GS-5. In the first millisecond, the vapor generation rate was relatively slow, and the coupled code results were slightly lower than the experiment ones. As the blowdown process reached saturation conditions, the largest increase rate of the void fraction occurred in the middle of the whole process. In the following period, due to the equilibrium state with the environment, the vapor generation rate decreased. The error between the coupled code results and the experiment ones can be attributed to the assumption that the average bubble size was simplified to a fixed value (1 mm) in the Fluent model. The size of the pre-existing nuclei in the sub-cooled liquid was substantially smaller than the prescribed 1 mm. This indicated a significant under-prediction of the interfacial area density available for the initiation of flashing. While the steam bubbles grew rapidly during the flashing process, which resulted in a mean size much larger than 1 mm in a short period (Liao and Lucas, 2017). Nevertheless, the uncertainty was weakened with the increase of the void fraction. The effects of prescribed bubble sizes were studied in Liao’s paper (Liao et al., 2013).
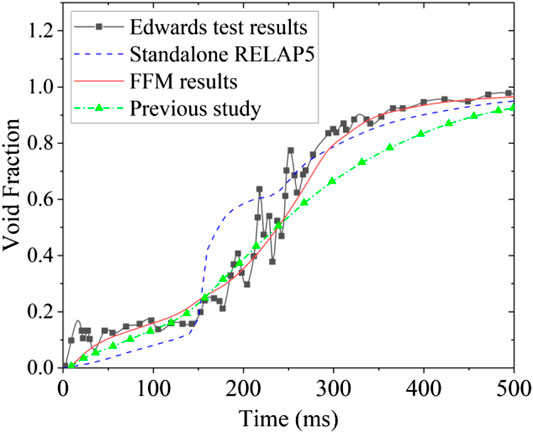
FIGURE 9. Comparison of void fraction at GS-5.
Figure 10 shows the mass flow rate variation of the control volume at the coupling interface. Since there is no available experiment data in the Edwards pipe blowdown test, the results of the coupled code were compared with those of the standalone RELAP5 code. The results of the coupled Fluent/RELAP5 code showed similar trends with those of RELAP5. The mixture mass flow rate by the standalone RELAP5 code was larger than that of the coupled code, and the falling tendency of the mass flow rate variation simulated by the coupled code began earlier.
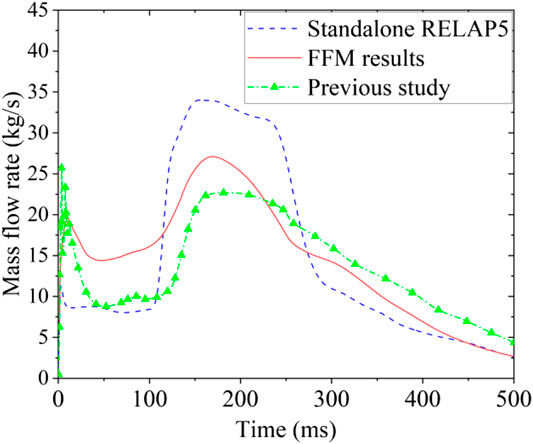
Figure 10. Comparison of the mass flow rate of the mixture at the coupling interface.
Figure 11 shows the mass flow rate variation at the break of the pipe. After the rupture of the end of the pipe, the discharge flow rate quickly reached the maximum value. The mass flow rate of the break simulated by the Fluent/RELAP5 coupled code was in good agreement with that of the standalone RELAP5, and the falling trend of mass flow also showed a similar relationship with that of the pressure. Although there is a lack of experimental results for the break mass flow rate, the results in this paper were close to those of the standalone RELAP5. It also indicated that the function fitting method encountered smaller errors in the simulation, which weakened the error induced by the coupling parameter.
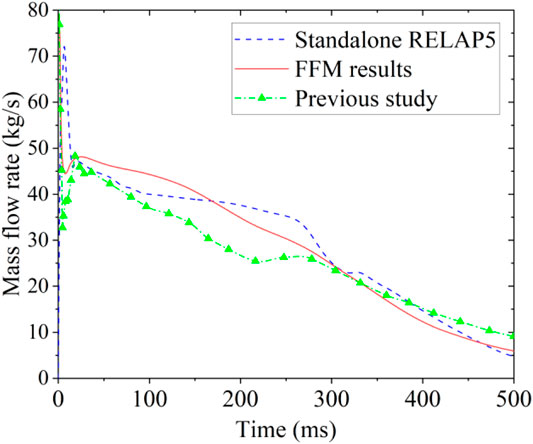
FIGURE 11. Comparison of the mass flow rate of the mixture at the pipe exit.
In this paper, a multiscale coupled thermal-hydraulic method was studied, and a coupled RELAP5/Fluent code was developed. To solve the problem of exchanging different dimensional thermal-hydraulic parameters through the coupling interface, the function fitting method was proposed. The physical distribution of different parameters was described by mathematical functions. The Edwards pipe blowdown test was used to verify the multiscale coupled thermal-hydraulic method. The results show that the FFM can help simulate the strong transient process accurately, and it can also improve the calculation accuracy when compared to the previous study that used uniform parameters distribution at the interface.
Due to the intellectual property limitations, the simulation data could not be published to the readers.
All authors listed have made a substantial, direct, and intellectual contribution to the work and approved it for publication.
The present work was supported by the China National Nuclear Corporation Science Fund for Talented Young Scholars (No. 167542).
The authors declare that the research was conducted in the absence of any commercial or financial relationships that could be construed as a potential conflict of interest.
Allison, C., Berna, G., Chambers, R., Coryell, E., Davis, K., Hagrman, D., et al. (1993). Report No.: EGG-2720. SCDAP/RELAP5/MOD3. 1 code manual: MATPRO–a library of materials properties for light-water-reactor accident analysis. Volume 4, DT Hagrman, NUREG/CR-6150 .Available at: https://doi.org/10.2172/100327 (Accessed June 01, 1995)
Anderson, N. A. (2006). Coupling RELAP5-3D and fluent to analyze a very high temperature reactor (VHTR) outlet plenum. College Station, TX: Texas A&M University.
Andersson, R., Andersson, B., Chopard, F., and Norén, T. (2004). Development of a multiscale simulation method for design of novel multiphase reactors. Chem. Eng. Sci. 59, 4911–4917.
Anderson, N., Hassan, Y., and Schultz, R. (2008). Analysis of the hot gas flow in the outlet plenum of the very high temperature reactor using coupled RELAP5-3D system code and a CFD code. Nucl. Eng. Des. 238, 274–279. doi:10.1016/j.nucengdes.2007.06.008
ANSYS (2015). CFX multiphase workshop 09: Edwards test modelling a steam line break with the IAPWS EOS ANSYS. 9, 1–42.
Aumiller, D. L., Tomlinson, E. T., and Bauer, R. C. (2001). A coupled RELAP5-3D/CFD methodology with a proof-of-principle calculation. Nucl. Eng. Des. 205, 83–90. doi:10.1016/S0029-5493(00)00370-8
Aumiller, D. L., Tomlinson, E. T., and Weaver, W. L. (2002). An integrated RELAP5-3D and multiphase CFD code system utilizing a semi-implicit coupling technique. Nucl. Eng. Des. 216, 77–87. doi:10.1016/S0029-5493(01)00522-2
Barre, F., and Bernard, M. (1990). The CATHARE code strategy and assessment. Nucl. Eng. Des. 124, 257–284. doi:10.1016/0029-5493(90)90296-A
Blasius, H. (1907). Grenzschichten in Flüssigkeiten mit kleiner Reibung. Petit: Druck von BG Teubner.
Colebrook, C. F., (1939). Turbulent flow in pipes, with particular reference to the transition region between the smooth and rough pipe laws. J. Inst. Civil Eng. 11, 133–156. doi:10.1680/ijoti.1939.13150
Cardoni, J. N. (2011). Nuclear reactor multi-physics simulations with coupled MCNP5 and STAR-CCM+. MS thesis. Champaign (IL): University of Illinois at Urbana-Champaign
Edwards, A. T., and O’Brien, T. (1970). Studies of phenomena connected with the depressurization of water reactors. Risley, United Kingdom: United Kingdom Atomic Energy Authority.
Egorov, Y., Boucker, M., Martin, A., Pigny, S., Scheuerer, M., and Willemsen, S. (2004). Validation of CFD codes with PTS-relevant test cases. 5th Euratom Framework Programme ECORA project. 2004, 91–116.
Fang, X., Xu, Y., and Zhou, Z. (2011). New correlations of single-phase friction factor for turbulent pipe flow and evaluation of existing single-phase friction factor correlations. Nucl. Eng. Des. 241, 897–902. doi:10.1016/j.nucengdes.2010.12.019
Haaland, S. E. (1983). Simple and explicit formulas for the friction factor in turbulent pipe flow. J. Fluid Eng. 105, 89–90.
Höhne, T., Krepper, E., and Rohde, U. (2010). Application of CFD codes in nuclear reactor safety analysis. Science and Technology of Nuclear Installations. 2010, 1–8. doi:10.1155/2010/198758
Ivanov, K., and Avramova, M. (2007). Challenges in coupled thermal-hydraulics and neutronics simulations for LWR safety analysis. Ann. Nucl. Energy. 34, 501–513. doi:10.1016/j.anucene.2007.02.016
Jeong, J.-J., Ha, K., Chung, B., and Lee, W. (1999). Development of a multi-dimensional thermal-hydraulic system code, MARS 1.3. 1. Ann. Nucl. Energy. 26, 1611–1642. doi:10.1016/S0306-4549(99)00039-0
Lee, K., and Ryley, D. J. (1968). The evaporation of water droplets in superheated steam. J. Heat Trans. 90, 445–451. doi:10.1115/1.3597540
Li, W., Wu, X., Zhang, D., Su, G., Tian, W., and Qiu, S. (2014). Preliminary study of coupling CFD code FLUENT and system code RELAP5. Ann. Nucl. Energy. 73, 96–107. doi:10.1016/j.anucene.2014.06.042
Liao, Y., and Lucas, D. (2017). Possibilities and limitations of CFD simulation for flashing flow scenarios in nuclear applications. Energies. 10, 139. doi:10.3390/en10010139
Liao, Y., Lucas, D., Krepper, E., and Rzehak, R. (2013). Flashing evaporation under different pressure levels. Nucl. Eng. Des. 265, 801–813. doi:10.1016/j.nucengdes.2013.09.027
Martelli, D., Forgione, N., Barone, G., and di Piazza, I. (2017). Coupled simulations of the NACIE facility using RELAP5 and ANSYS FLUENT codes. Ann. Nucl. Energy. 101, 408–418. doi:10.1016/j.anucene.2016.11.041
McFadden, J., Paulsen, M., Gose, G., Peterson, C., McClure, J., and Westacott, P. (1981). Report No.: EPRI NP-1850 CCM. RETRAN-02: A program for transient thermal-hydraulic analysis of complex fluid flow. Available at: https://www.osti.gov/biblio/6627455 (Accessed November 01, 1988)
Muhlbauer, P. (2003). Review of CFD applications in primary loop and recommendations. EVOL-ECORA-D02, 24–47.
Plesset, M. S., and Zwick, S. A. (1954). The growth of vapor bubbles in superheated liquids. J. Appl. Phys. 25, 493–500. doi:10.1063/1.1721668
RELAP5-3D Code Development Team %J INEEL-EXT-98-00834, R. (2012). RELAP5-3D code manual volume I: code structure, system models and solution methods. Idaho Falls, ID: Idaho National Laboratory.
Rohde, U., Höhne, T., Kliem, S., Hemström, B., Scheuerer, M., Toppila, T., et al. (2007). Fluid mixing and flow distribution in a primary circuit of a nuclear pressurized water reactor—validation of CFD codes. Nucl. Eng. Des. 237, 1639–1655. doi:10.1016/j.nucengdes.2007.03.015
Romeo, E., Royo, C., and Monzón, A. (2002). Improved explicit equations for estimation of the friction factor in rough and smooth pipes. Chem. Eng. J. 86, 369–374. doi:10.1016/S1385-8947(01)00254-6
Scheuerer, M., Heitsch, M., Menter, F., Egorov, Y., Toth, I., Bestion, D., et al. (2005). Evaluation of computational fluid dynamic methods for reactor safety analysis (ECORA). Nucl. Eng. Des. 235, 359–368. doi:10.1016/j.nucengdes.2004.08.049
Schramm, L. L. (2006). Emulsions, foams, and suspensions: fundamentals and applications. Hoboken, NJ: John Wiley & Sons.
Stewart, C., Wheeler, C., Cena, R., McMonagle, C., Cuta, J., and Trent, D. (1977). COBRA-IV: the model and the method. Richland, WA: Pacific Northwest Labs.
Stewart, C., Cuta, J., Montgomery, S., Kelly, J., Basehore, K., George, T., et al. (1989). VIPRE-01: a thermal-hydraulic code for reactor cores. Palo Alto, CA: Electric Power Research Inst. Richland, WA: Pacific Northwest Lab.
von Karman, T. (1937). On the statistical theory of turbulence. Proc. Natl. Acad. Sci. U. S. A. 23, 98–105. doi:10.1073/pnas.23.2.98
Weaver, W. L. (2005). Report No.: INL/EXT-05-00107. The application programming interface for the PVMEXEC program and associated code coupling system. Citeseer, Available at: https://doi.org/10.2172/911219 (Accessed December 15, 2012)
Weaver, W. L., Tomlinson, E. T., and Aumiller, D. L. (2002). A generic semi-implicit coupling methodology for use in RELAP5-3D ©. Nucl. Eng. Des. 211, 13–26. doi:10.1016/S0029-5493(01)00422-8
Keywords: coupled RELAP5/fluent code, Edwards blowdown test, function fitting method, mutliscale thermal-hydraulic code, computational fluid dynamics
Citation: Sun L, Peng M, Xia G, Wang X and Wu M (2021) Development and Validation of Multiscale Coupled Thermal-Hydraulic Code Combining RELAP5 and Fluent Code. Front. Energy Res. 8:613852. doi: 10.3389/fenrg.2020.613852
Received: 04 October 2020; Accepted: 11 December 2020;
Published: 09 February 2021.
Edited by:
Xianping Zhong, University of Pittsburgh, United StatesReviewed by:
Mehdi Hashemi-Tilehnoee, Islamic Azad University, IranCopyright © 2021 Sun, Peng, Xia, Wang and Wu. This is an open-access article distributed under the terms of the Creative Commons Attribution License (CC BY). The use, distribution or reproduction in other forums is permitted, provided the original author(s) and the copyright owner(s) are credited and that the original publication in this journal is cited, in accordance with accepted academic practice. No use, distribution or reproduction is permitted which does not comply with these terms.
*Correspondence: Xuesong Wang, d2FuZ3h1ZXNvbmdAY2lhZS5hYy5jbg==
Disclaimer: All claims expressed in this article are solely those of the authors and do not necessarily represent those of their affiliated organizations, or those of the publisher, the editors and the reviewers. Any product that may be evaluated in this article or claim that may be made by its manufacturer is not guaranteed or endorsed by the publisher.
Research integrity at Frontiers
Learn more about the work of our research integrity team to safeguard the quality of each article we publish.