 Luca Riboldi
 Erick F. Alves
 Marcin Pilarczyk
 Elisabetta Tedeschi2
 Lars O. Nord
- 1Department of Energy and Process Engineering, NTNU Norwegian University of Science and Technology, Trondheim, Norway
- 2Department of Electric Power Engineering, NTNU Norwegian University of Science and Technology, Trondheim, Norway
This paper presents an innovative hybrid energy system for stable power and heat supply in offshore oil and gas installations. The proposed concept integrates offshore wind power, onsite gas turbines and an energy storage system based on fuel cell and electrolyzer stacks. It is expected to be an effective option to decarbonize the offshore petroleum sector as it allows a more extensive exploitation of the offshore wind resource by means of energy storage. To ascertain its potential, an integrated model was developed. The integrated model allows to simulate the process and electric grid performances. The inclusion of both domains provides a comprehensive picture of a given design operational performance. The feasibility of the proposed concept was first investigated through a parametric analysis where an understanding of its potential and limitations was gained. A rigorous optimization was then implemented to identify the designs resulting in the best performances and ultimately to obtain a comprehensive picture of the suitability of the concept. It is shown that a well-designed system can reduce carbon emissions compared, not only to a standard concept based on gas turbines (almost 1,300 kt less CO2 emissions, making up for a relative 36% reduction), but also to the integration of a wind farm alone (more than 70 kt less CO2 emissions, making up for a relative 3% reduction, but complying with grid dynamics requirements). Moreover, the energy storage system brings benefits to the electric grid stability and allows the integration of large wind power capacity without overpassing the 2% maximum frequency variation (as it is the case without energy storage). Not least, the optimization showed that the definition of an optimal design is a complex task, with little margin to further gains in terms of carbon emissions, likely due to technological limitations.
1 Introduction
Global warming is among the biggest challenges facing the world today, something clearly reflected in efforts made by governments, industries and academia to reduce greenhouse gases (GHG) emissions and provide sustainable energy for all. The general roadmap to reach these goals includes country-specific paths depending on the national energy and industrial system. For instance, in Norway, the petroleum sector is currently a key element of the socio-economic development but, simultaneously, accounts for 28% of the total GHG emissions (Bothner et al., 2020).
Konkraft (2020) presents possible emission-reduction technologies for the energy industry on the Norwegian continental shelf. The target is decreasing GHG emissions by 40% in 2030 compared with 2005 and reaching near zero in 2050. The 40% drop by 2030 corresponds to an absolute reduction of 5.4 Mt of CO2 equivalents compared with 2005. Feasible approaches include design optimization of the platform (Nguyen et al., 2019), energy efficiency measures (Nguyen et al., 2016), carbon capture and storage (Roussanaly et al., 2019) and electrification (Riboldi et al., 2019).
Within this context, renewable energy sources appear to be applicable to various projects. Choi et al. (2017) presents 11 different cases of onshore and offshore oil and gas production sites at which different technologies were incorporated including photovoltaic (PV), wind, solar and geothermal energy. Nonetheless, in this study, offshore facilities were connected only with wind power technology. The potential installation of dedicated PV arrays on an offshore rig would be probably much more challenging and costly than the equivalent wind turbine installation, especially in areas such as the North sea where wind power is abundant compared to solar energy. For instance, in 2005, Shell constructed and installed two monotower platforms with two small wind turbines and two arrays of PV panels on the deck (Mundheim, 2007). However, these platforms are small unmanned facilities for well drilling at shallow waters. Also, MacDonald (2014) evaluated solutions based on wave energy and other renewables to cover the electrical demand in living quarters of offshore platforms. Although all sources could accomplish the required energy demand, some form of energy storage is needed. All in all, the author considered two deep-sea wave energy devices as promising solutions in hybrid system. But they still have to demonstrate their commercial and technical maturity to be applied in the oil and gas industry. Not least, Hanssen et al. (2015) analyzed a hybrid offshore renewable energy platform which comprises wind turbines and arrays of wave energy converters. The investigation yielded promising technical results and economic performance for the North Sea area. However, there are no more works dedicated to this installation. Finally, Rafiee and Khalilpour (2019) offers a good overview of the various applications of renewable energy sources in the oil and gas sector. The authors focused on the hybridization of upstream and downstream processes in oil and gas supply chains and found that not only the integration of clean energy sources with the oil and gas industry decreases its emission intensity, but may also reduce production costs.
In this sense, a mitigation option for the oil and gas industry which made significant progress in recent years is offshore wind power. Offshore wind displays advantageous characteristics in comparison to onshore, for instance higher average wind speed, lower turbulence intensity and wind shear (He et al., 2010). The Norwegian Sea and the northern end of the North Sea were regarded as extremely promising for the combination of oil, gas and offshore wind, when evaluating technical, environmental and market aspects (Legorburu et al., 2018).
Wind is obviously an irregular power source, which poses inherent challenges to match the power demand from a stand-alone user such as an offshore installation. The solution proposed so far has been to couple offshore wind farms with gas turbines (GTs) (Korpås et al., 2012). However, this approach has invariably led to the under-design of wind farms or the dissipation of excess wind power.
Another challenge that arises from this standard solution is the grid stability for large wind installed capacity. For example, Orlandini et al. (2016) showed that a maximum wind power of 10 MW was feasible considering an installed electrical load of 30 MW to comply with frequency requirements. Conservative operating strategies are often applied to achieve the requested level of reliability and flexibility, leading to poor performance and increased emissions. A smart load management of flexible loads interfaced by variable speed drives, such as water injection systems, shows to be beneficial, as discussed by Sanchez et al. (2017).
Not least, all the challenges outlined increase costs and make the integration of wind power into offshore installations an intricate business case. Riboldi and Nord (2018) demonstrated that the economic viability of wind power integration needs to be supported by favorable conditions in terms of gas and CO2 prices and improves if large offshore projects are considered.
In summary, the studies available in the literature show a significant potential for emission cuts in the oil and gas extraction sector by exploiting the offshore wind resources. However, multiple technical and economical issues must be addressed to effectively harness wind power. A typical technical issue is to efficiently couple the intermittent nature of renewable sources with the reliable power supply requested by oil and gas platforms. Adding the possibility of energy storage to the equation could be extremely helpful to smooth the irregular contribution of wind power. Alves et al. (2019) corroborated this hypothesis by investigating power quality issues in a wind-powered offshore oil and gas platform operating in island mode with energy storage.
Hybrid electric power systems could offer the opportunity to improve safety, reliability and operational efficiency when compared to traditional electrical power systems (Korn et al., 2018). Several storage techniques have been proposed for systems with different characteristics. Despite the maturity of some of those techniques, their application offshore would introduce a set of additional challenges, such as space and weights constraints, difficulty of storage and harsh operating conditions. This paper introduces an innovative and efficient technological solution to curb emissions while not endangering the economics of offshore operations.
To this end, the proposed Hybrid Energy System for stable power and heat supply in OFFshore oil and gas installations (HES-OFF) concept combines a renewable energy source with an energy storage system (ESS) and conventional GTs. The underlying idea is to exploit the full potential of the wind offshore resource and typical equipment of offshore installations by introducing an ESS consisting of stacks of proton exchange membrane (PEM) fuel cells (FCs) and electrolyzers (ELs) together with a subsea H2 storage system. The PEM technology was chosen as the most appropriate for this concept due to its fast-dynamic response, good efficiency and relative maturity. This HES-OFF is expected to offer significant advantages:
• Full exploitation of renewable energy sources: the ESS allows the storage of excessive wind energy that otherwise would have been immediately converted into heat to avoid grid overloading.
• Removal of redundant GTs: back-up power is guaranteed by the FC stack thus it might be possible to remove redundant GTs.
• Increased security of power supply: a properly designed ESS helps to cope with unforeseen variations of wind power and demand allowing a more flexible operation of the plant.
• Improved operation of the GT: use of a cleaner fuel (H2) and a more efficient operational strategy that do not directly respond to wind fluctuations.
• Additional electric grid stability: the ESS acts as a buffer smoothing out the fluctuations of the wind power system.
The paper aims to ascertain that the HES-OFF system is capable to deliver the listed advantages and so decarbonize the offshore petroleum sector. For this purpose an integrated model was developed to simulate the process and electric grid performances. Such model is used to perform a parametric analysis followed by a rigorous design optimization, and gain a full understanding of the potential of this hybrid concept.
2 Materials and Methods
2.1 Principles of the Proposed Concept
The proposed HES-OFF operates in the following manner. The GT provides base-load power while the waste heat available in its exhaust gas is harvested to supply process heat to the installation. The wind farm supplies the remaining power demand, while the ESS helps to cope with its intermittency by providing backup power. In the case of excess wind power, the EL stack absorbs this surplus and produces hydrogen. The latter can be stored or used in the GT where the possibility to blend it with natural gas is envisioned. Conversely, in the case of lack of wind power, the FC stack provide backup power using the hydrogen stored. Figure 1 presents a schematic of the proposed system.
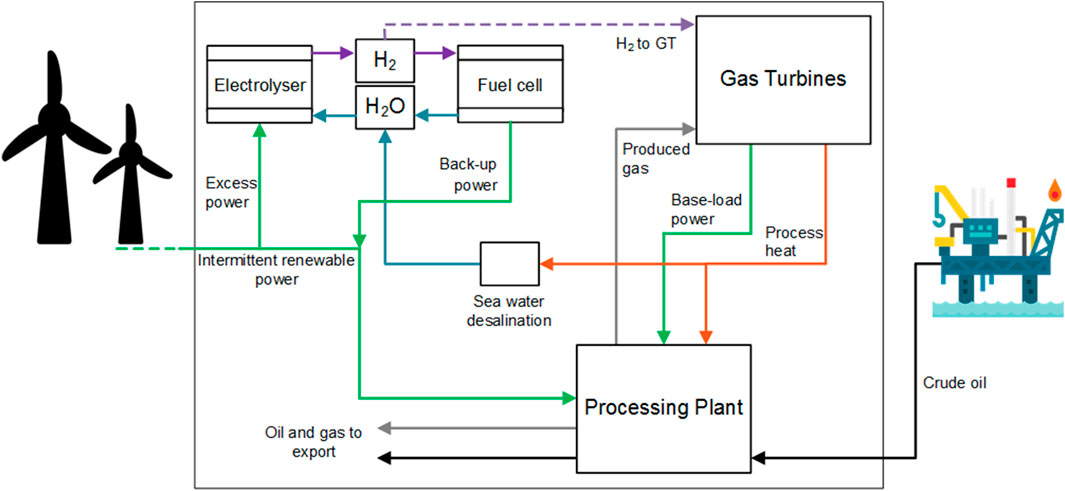
FIGURE 1. Schematic representation of the proposed HES-OFF.
2.2 Integrated Model
An integrated model of the proposed system was developed combining sub-models of the process and the electric grid components. This integrated model allows designing the hybrid energy system for maximum process performance, while simultaneously verifying the stable operation of the offshore grid. This approach not only helps avoiding designs that would prove operationally unfeasible, but actively directs the design process toward optimal solutions by considering the mutual influence of the process and the electric domains.
Figure 2 gives an overview of the design approach based on the integrated model. More details are presented in the following sections.
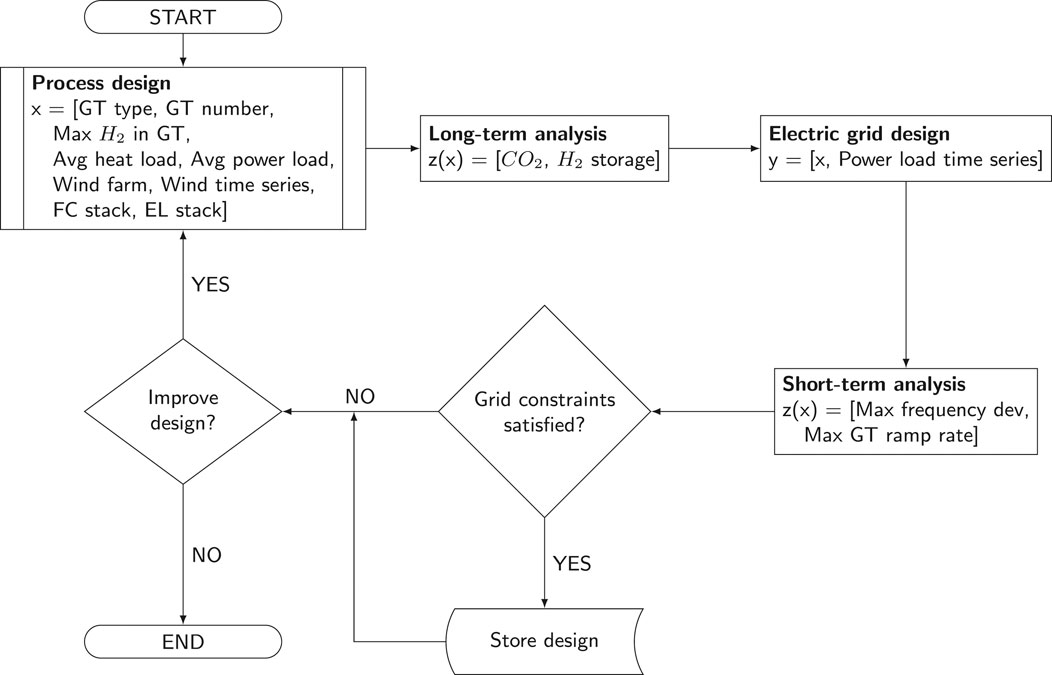
FIGURE 2. Flowchart of the proposed design methodology combining models of the process and electric domains.
2.3 Process Models
In this section, the sub-models simulating the main process components of the hybrid system are described. The process components contribute to meet the heat and power demands of the offshore installation:
where PW is wind power, PGT is gas turbine power, PFC is fuel cell power, PEL is electrolyzer power, PWdiss is wind power dissipated and QWHRU is heat harvested from the waste heat recovery unit.
In the current study, the hydrogen storage technology has not been explicitly defined, with the size of the storage simply given in kg H2. Preliminary analyses showed that gaseous storage as the preferable option compared to liquid storage. The additional energy requirements of a cryogenic process would indeed be detrimental for achieving an acceptable roundtrip energy efficiency. Given the large volumes associated with gaseous hydrogen storage, subsea storage solutions are envisaged. Potential storage technologies exist, such as the utilization of gas balloons (Pimm et al. (2014)), gas pipes and underground formations (Kruck et al. (2013)). More detailed analyses will be made to identify the optimal technological solutions. Another limitation of this study is that it does not model seawater desalination that is needed to produce the make up water used by the electrolyzer stack. The inherent assumption is that the residual thermal energy from the GT flue gas is sufficient to supply the necessary thermal energy for the desalination process. Preliminary calculations showed that this assumption holds true even in the worst case scenario where all water required by the electrolyzer stack would need to be produced by a designated unit (i.e., no water made available from the fuel cell stack). However, further analyses are needed to ensure the energy balance and to address the practical challenges to introduce another unit onto the offshore installation.
2.3.1 Gas Turbines
The GTs are simulated through a data-defined model based on the curves provided by the manufacturer. Data for the entire operating range of the engines (10–100%) were retrieved for the 2 GTs modeled, a GE LM2500 + G4 (rated power 33.3 MW) and a GE LM6000 PF (rated power 44.7 MW). Those are aeroderivative gas turbines, typically used for offshore applications. More details on the models and their validation can be found in Riboldi et al. (2019).
The proposed concept includes the possibility to co-feed a certain amount of H2 to the GT. The maximum concentration of H2 that can be used depends on the type of GT considered, particularly on the type of combustor. A white paper by the manufacturer of the modeled GTs (Goldmeer, 2019) reports that aeroderivative models with a single annular combustor can handle hydrogen concentrations from 30 up to 85 vol%. However, dry low emission and dry low NOx combustors must operate with more limited amounts of hydrogen in the fuel, down to 5 vol% in certain cases. In this analysis, a conservative upper threshold of 20 vol% was selected.
Moreover, a simplified approach was considered to model the effect of H2 in the fuel. The strategy implemented keeps a constant chemical energy entering the GT combustor. That implies changes in the mass flow rate of fuel because of the different heating values at different fuel compositions. This is an approximation as it is known that the presence of a significant amount of H2 in the fuel might have profound effects in the operation of a GT (Chiesa et al., 2005). However, the approximation may be considered acceptable given the limited maximum H2 concentration considered and the nature of this analysis.
2.3.2 Waste Heat Recovery Unit
A model of a waste heat recovery unit (WHRU) was developed and the physical hardware was designed to resemble that of an actual WHRU from an offshore installation. More details about this model and its validation can be found in Riboldi and Nord (2017). In the integrated model of the proposed concept, the WHRU model is not directly included. However, some input data from its model are necessary. First, an estimation of the pressure drops, to determine the outlet pressure from the GT. Second, a way to evaluate the relation between the exhaust gas from the GT and the heat that can be harvested. This allows the estimation of the heat available at each operating condition. Polynomial correlations, obtained by interpolating simulation outputs, were developed to make this information available to the integrated model.
2.3.3 Fuel Cell Stack
As stated earlier, PEM FC stacks are foreseen in the proposed concept. Based on preliminary analyses, the expected output power was in the order of 1–4 MW. Such systems contains a few modules, each of them comprised by several stacks. The whole system is equipped with necessary components and auxiliaries commonly referred as balance of plant equipment, namely fuel and water management system, heat exchangers, sensors and controls.
The strategy adopted to model the complete PEM FC system was simulating a singular stack of 125 kW rated power and scaling it up to a full-scale system. A simple steady-state, zero-dimensional model of the FC stack was prepared to assess the part-load performance of the stack. For this purpose, the scripts published in Spiegel (2008) were used and supplemented by additional in-house scripts for scaling-up the system. The outputs, including polarization curves and performance characteristic, have been calculated based on updated technical data of modern commercial stacks, where the main reference for parameters and tuning was the PowerCell model S3 125 kW (PowerCell, 2018). Considering the standard operating conditions specified by manufacturer, the highest performance of this stack is 64 MJ/kgH2 (electrical energy per kg of consumed hydrogen) at the 20–25 kW range. Then, the stack performance drops linearly to 56 MJ/kgH2 at full load. The calculated performance curve has been used in scaling-up the system to the multi-megawatt output and used in the integrated model. The FC stack degradation is neglected in the analysis.
2.3.4 Electrolyzer Stack
In the proposed concept, a PEM EL system is used to convert electricity and water into hydrogen and oxygen. The anticipated rated power of this system is in the 2–6 MW range, and its partial-load performance has been considered in the integrated model. A dedicated model for a 500 kW stack was prepared based on Zhang et al. (2012) and additional in-house scripts for scaling-up the system. The 500 kW commercial stack NEL Hydrogen model M100 (NEL Hydrogen, 2020) served as reference for parameters and tuning of the model. The determined performance characteristic shows that the electrolyzer part-load performance is higher than at full load as it is in the case of the FC stack. According to the performed calculations and respecting standard operating conditions specified by the manufacturer, the EL stack’s performance at 500 kW load is 4.9 gH2/MJ, then increases almost linearly to 5.5 gH2/MJ at 250 kW, thereafter exponentially reaches value of 6.4 gH2/MJ at 50 kW. Similarly to the FC system, the degradation process is neglected in the analysis. The presented electrolyzer performance characteristic has been used in scaling-up the system to the multi-megawatt output and used in the integrated model.
2.3.5 Wind Power
To calculate the offshore wind power available, wind data must be first retrieved. Appropriate wind speed time series are necessary to understand the potential of a given geographical location. A one year wind speed time series with 20-min resolution served as basis for our analysis (Korpås et al., 2012). The dataset refers to measurements from an oil platform in the North Sea by The Norwegian Meteorological Institute (MET Norway) (Riboldi and Nord, 2018). The wind speed raw data were corrected with a factor to consider the wind speed at turbine hub height:
where k is the wind correction factor and hhub, href are the height of the wind turbine (WT) hub and reference data, respectively. An average wind speed of 10.2 m/s at the turbine hub height was calculated, in line with the expected range of 9–11 m/s for offshore applications on the Norwegian Continental Shelf (Berge et al., 2009). Refer to the Supplementary Material for the probability density function of this dataset.
An additional dataset was retrieved for comparison from an open-source database of scientific-quality weather and energy data. The methods on which the database is developed are described in Staffell and Pfenninger (2016). The weather data are taken from global reanalysis models and satellite observations (Gelaro et al., 2017). The additional dataset refers to the weather conditions of an offshore area in the North Sea in 2017 and have a resolution of 1 h. An average wind speed of 10.9 m/s is calculated.
For both data series, the conversion from wind speed to wind power is based on the power curve of the Siemens Gamesa SWT 6.0–154 WT, a commercial 6 MW three-bladed floating turbine concept.
2.4 Electric Grid Model
In electric grids, deviations of the average system frequency ω (rad/s) from its rated value ωs are proportional to the mismatch between power generation and demand. In other words, if power generation exceeds the demand, frequency increases beyond its rated value, until energy balance is achieved. Conversely, the frequency decreases if there is power generation deficit. This concept is better understood if one considers all generators in a power system as an equivalent mass rotating around a shaft with damping at rated angular speed ωs (rad/s), as seen in Figure 3.
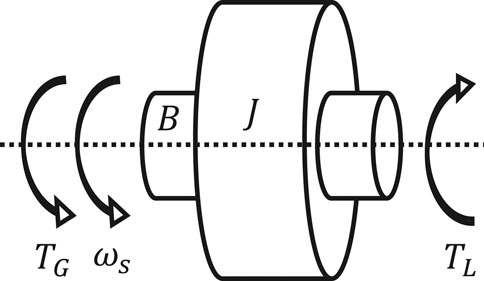
FIGURE 3. Ideal representation of the electric grid as a rotating mass with inertia and damping.
If Newton’s second law of motion is applied to this system, Eq. 4 is obtained:
where
From the electric power engineering perspective, one of the main challenges of the HES-OFF is guaranteeing frequency stability in the electric grid. Stability here is seen in the sense of keeping frequency values within an acceptable range for changes in power generation and demand (Kundur et al., 2004). Due to the stochastic nature of wind power, the interconnection of an offshore windfarm to an oil-and-gas platform may cause instabilities if the system is not properly designed. Moreover, as discussed in Fadaeinedjad et al. (2009), Honrubia-Escribano et al. (2012) and Liang (2017), integration of renewable energy sources and increased frequency and voltage deviations can increase maintenance, reduce reliability and affect performance of process and electric equipment. Therefore, the proposed integrated model includes a stability assessment of the electric grid and produces designs that satisfy minimum conditions for stable operation, as shown in Figure 2.
To achieve that, the average frequency dynamics of the system is evaluated using the normalized state-space realization of Eq. 4’s model:
where
Not least, the wind farm is modeled similarly to the process model described in Section 2.3.5, i.e. interpolating a time series of average wind speeds with the WT power curve. However, the effect of wind turbulence is added in the electric grid model according to the recommendations in industry standards for offshore turbines (IEC 61400-3:2019, 2019). The Kaimal spectrum is applied with a length scale of
Note that voltage stability is ignored in this surrogate model. This is justified by the following facts: 1) in offshore installations, voltage dynamics typically have a negligible effect on the sizing of the process equipment (Alves et al., 2019); 2) voltage stability can be improved by control strategies (Årdal et al., 2012; Sanchez et al., 2017; Alves et al., 2019); 3) voltage stability analysis requires complex dynamic simulations with long solve times, what may render the overall optimization procedure intractable (Alves et al., 2019).
2.5 Long-Term Analysis
The long-term analysis deals with the design of the HES-OFF considering the various stages of life of the offshore installation: peak, mid-life and tail. For each stage of life, an annual time span is considered, where the year is discretized with an hourly resolution, i.e., 8,760 instances. While the power and heat demands are constant throughout the year, the wind speed profiles lead to varied hourly wind powers. Depending on the operational strategy, different contributions from the FC and EL stack will be requested and the storage level will change consequently. The analysis must ensure that the HES-OFF is able to meet the power and heat demands in each instance of the year and that a net-zero balance of stored H2 is achieved at the end of the year. The main objective is to minimize CO2 emissions. Secondary objectives are to remove 1 GT and maximize the exploitation of the offshore wind resource.
The following solution strategy is implemented. Once a design is defined, it is first tested over one year without considering energy storage. At the end of the year, either a net deficit of power (typical of peak years) or a net surplus of power (typical of tail years) is obtained. In the case of a net deficit of power, the next step implemented by the solution algorithm is to evaluate in which instances during the year it is possible to increase GT load and to use extra power for H2 production by the EL stack. The production is stopped when either the maximum storage level or the H2 output target is reached. In the case of a net surplus of power (typical of tail years), the solution algorithm decreases the GT load and use the FC stack to cover the related decrease of power output whenever possible during the year. When the level of storage reaches a maximum, a fraction of the H2 is co-fed to the GT in order to constrain the size of the storage. If this measure is not enough to handle the amount of H2 available because of excess power, some wind power is dissipated and the H2 production is therefore reduced. If at the end of the iteration throughout the year, some H2 is still unused, additional H2 is co-fed to the GT whenever possible throughout the year.
2.6 Short-Term Analysis
The main goal of the short-term analysis is checking the feasibility of the offshore grid design from an operational perspective. This step is performed based on the outputs of the long-term analysis described earlier in Section 2.5. It checks the robustness of a proposed solution to electrical transients in a time scale of minutes. Examples of such transients are load variations in pumps and compressors and wind power production. It can be considered one of the innovations of this work compared to the state-of-the-art design techniques for HES-OFFs reported in the literature.
The short-term analysis tries to answer the following questions: can the electrical frequency of the electric grid be maintained within the allowed range specified in industry standards for offshore installations (IEC 61892:2015, 2015)? Will the allowed ramp rates of GTs be respected during typical load and wind power transients?To achieve that, the following procedure is executed:
(1) Equipment sizes are obtained from the long-term analysis results, namely: number and type of GTs, number of WTs, size of the FCs and ELs stacks.
(2) Average load and wind power and their possible variations are obtained from historical data.
(3) This data is parametrized into a MATLAB Simulink model of the offshore grid, as described in Section 2.4.
(4) The Simulink model is executed for two 180-s simulations. The first time with the maximum positive variation of wind power, the second with the minimum negative variation. During these two executions, the maximum positive load variation is introduced at 60s and the minimum negative load variation at 120s.
(5) At the end of these executions, the following values are obtained from the time series of the simulation: maximum and minimum frequency of the offshore grid, maximum ramp rate of the GTs.
(6) The dynamic constraints of the offshore grid are considered satisfied if all these values are below their specified limits. Otherwise, the long-term analysis is re-executed changing the size of equipment as described below:
• If the minimum frequency limit was reached, the FC stack is increased.
• If the maximum frequency limit is reached, the EL stack is increased.
• If the GT ramp rate is reached, the number of WT is reduced.
2.7 Optimization Framework
An optimization framework was developed to identify the optimal designs for the HES-OFF. The input parameters for the optimization problem (i.e., the decision variables) are those deemed having the largest impact on the performances. They are illustrated in Table 1 with their selected lower and upper bounds.
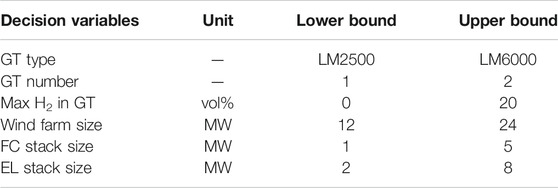
TABLE 1. Input parameters for the optimization problem.
The metrics selected to analyze the performance of a design (i.e., the objective functions) are the cumulative CO2 emissions and the H2 storage size. Both objectives are to be minimized by the optimizer. To explore only the space considered of interest, an additional constraint was established, that is to discard designs leading to an H2 storage size larger than 50,000 kg. A multi-objective constrained optimization problem is so defined. A meta-heuristic approach was selected to solve the optimization problem. The genetic algorithm using the MATLAB Global Optimization Toolbox (MathWorks, 2020) was implemented, with the following characteristics:
: Population size: 500
: Maximum number of generations = 10
: Function tolerance = 10−3
: Number of stall generations: 5
: Crossover fraction: 0.8
3 Results
3.1 Case Study
An offshore facility located in the Norwegian sector of the North Sea is used as case study. The power and heat are supplied to the processing block which delivers export oil and gas and additionally fuel to the GTs. Electrical power is consumed primarily by pumps (i.e., circulation of cooling water, water injection, oil export) and compressors (i.e., gas export, gas lift, gas re-injection) (Riboldi and Nord, 2017). All electrically driven equipment is connected to the grid. Crude oil separation and stabilization makes up for a large share of the heat requirement, with the remaining part supplied to other processing requirements and utility demands. For the long-term analysis, the power and heat supply demands were based on estimations provided by the platform operator and discretized as follows:
• Peak demand (2years): 43.6 MW power, 14.0 MW heat
• Mid-life demand (4years): 35.2 MW power, 11.0 MW heat
• Tail demand (12years): 32.9 MW power, 8.0 MW heat
For the short-term analysis, historical data of the power demand was compiled from the supervisory control and data acquisition system of the platform. A data set covering a time interval of one week with 1 s interval between samples was extracted and fit by a normal distribution. From the latter, it was obtained an average load demand of 44.6 MW and maximum load variation of 3 MW with 99.9% of probability.
3.2 Parametric Analysis
First, a parametric analysis was performed aiming not only to preliminarily evaluate the potential of the HES-OFF concepts, but also to identify parameters that influence significantly the performances and in which ranges they can be varied. This information is essential to appropriately define the subsequent optimization problem. The results of this parametric analysis have been partially reported in Riboldi et al. (2020).
The following parameters were kept constant in this analysis:
• Maximum GT load: 95% (with energy storage), 90% (without energy storage)
• Minimum GT load: 40% (to ensure the heat demand is met in every instance)
• Maximum fraction of H2 in GT: 20 vol%
• WT size: 6 MW
The parameters that have been investigated are (with the default values when the focus is on another parameter):
• Type and number of GTs
• Number of WTs
• Maximum H2 storage size – 50,000 kg default
• Maximum EL stack size – 6.0 MW default
• Maximum FC stack size – 3.6 MW default
The main findings are only qualitatively described in this section. The complete set of results obtained is available in the Supplementary Material.
3.2.1 Maximum Storage Size
The designs based on the large GT (LM6000) return, on average, smaller sizes of H2 storage than those obtained when using the small GT (LM2500), not larger than about 10,000 kg. On the other hand, the large GT does not allow to constrain the maximum size of the storage below a certain threshold. The small GT can meet those constraints in most cases but to the cost of wind power dissipation. With respect to CO2 emissions, allowing large sizes of storage leads to reduction in emissions, as expected. However, these reductions saturate after a certain storage size. It should also be highlighted that the designs based on the small GT must rely on two units, otherwise very large storage is required. On the contrary, it is always possible to operate the system with a single unit when the large GT is considered.
3.2.2 Maximum Electrolyzer Stack Size
Decreasing the EL stack size results in a slight increase of the CO2 emissions. However, the negative impact is very limited. A maximum increase of cumulative emissions of 0.5–0.6% was registered for the cases based on the small and large GTs, respectively. In the first case, the size of the stack was varied between 2.5 and 7 MW, in the second case between 4 and 7 MW. The sizing of the EL stack might have a role in constraining the storage size necessary, mainly when the small GT is considered.
3.2.3 Maximum Fuel-Cell Stack Size
The FC stack size appears not particularly relevant for the large GT, while showing a slightly larger influence for the cases based on the small GT. The data suggests that the main design challenge is to store enough H2 rather than being able to instantaneously consume the H2 produced. In other words, the storage rated energy capacity in MJ seems to play a larger role than its rated power capacity in MW. With regard to the large GT, increasing the FC stack size does not affect the CO2 emissions significantly. A limited positive effect is noted on the cumulative emissions but mainly on the storage size, when large wind farms (i.e. excess of wind power) are considered. In such cases, the storage size is influenced by the ability to quickly consume H2 and a larger FC stack might have a positive effect.
3.2.4 Discussion of the Parametric Analysis
Overall, the following can be argued from the parametric analysis of the case study. The design parameters investigated (i.e. the H2 storage, the EL and FC stack sizes) seem to have little effect on the cumulative CO2 emissions. This might suggest that it is not useful to pursue an optimal technical design in terms of minimum possible emissions, considering that those might offer relatively low environmental advantages and might not be justified economically. Hence, it could be more convenient to keep those design parameters at a level that ensure reliable operation. To confirm this hypothesis, the optimization framework described in Section 2.7 was applied and its results are presented in the following section.
3.3 Integrated Results Using the Optimization Framework
3.3.1 Benchmark Scenarios
Based on the insights gained through the parametric analysis, a first set of designs were defined and tested and those constitute the benchmark scenarios. The results obtained by these proposed HES-OFF designs were compared against two other concepts: a standard design relying solely on GTs (GTs), and designs involving GTs and WTs without any storage (GTs + WTs). These two additional concepts were simulated using the same models previously described.
For all concepts, the maximum allowed frequency deviation in the electric grid was ±2% from its rated value (60 Hz) and the maximum GT ramp rate 14.7%/s. In the proposed HES-OFF designs, the maximum GT load was set to 95% rather than 90% to account for the decreased contribution of GTs to operational reserves, which is also ensured by the ESS. The size of the FC and EL stacks are set at their default values, i.e., 3.6 and 6 MW respectively. Not least, the proposed designs selected constrained the H2 storage size to about 5,000 kg for the small GT, and to the minimum possible for the large GT.
Tables 2 and 3 report the results of this comparative analysis. These results suggest that the proposed concept reduces CO2 emissions compared both to the GTs and the GTs + WTs concepts. If the design based on the small GT in a simple cycle is taken as reference, a maximum CO2 emissions reduction of about 40% can be achieved by the HES-OFF system. The improvements compared to the standard integration of wind power lie in a range between 1% and 7%. The lowest cumulative CO2 emissions are obtained by the proposed design based on the small GT coupled with the largest size of wind farm tested (24 MW), reaching a cumulative CO2 emissions cut of over 1,400 kt compared to the standard solution based on the same GT. However, such design fails to constrain the H2 storage and to remove 1 GT. At smaller sizes of the wind farm size (18 and 12 MW), the proposed designs using the LM6000 GT gain in competitiveness compared to those based on the LM2500. Overall, the small GT designs can be characterized as high-risk high-gain concepts, where the challenges to implement them are larger but the potential positive effects on CO2 emissions are larger as well. Conversely, use of the large GT results in easier to implement designs and stable performance, but lower potentials to cut CO2 emissions.
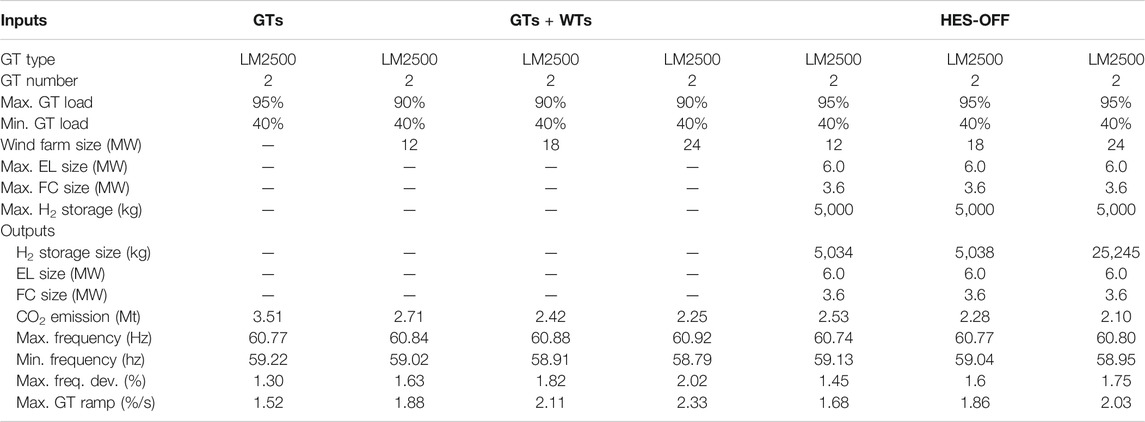
TABLE 2. Designs based on the LM2500 GT - Comparative analysis between a standard concept on GTs only (GTs), a concept involving GTs and WTs (GTs + WTs), and the proposed concept (HES-OFF).
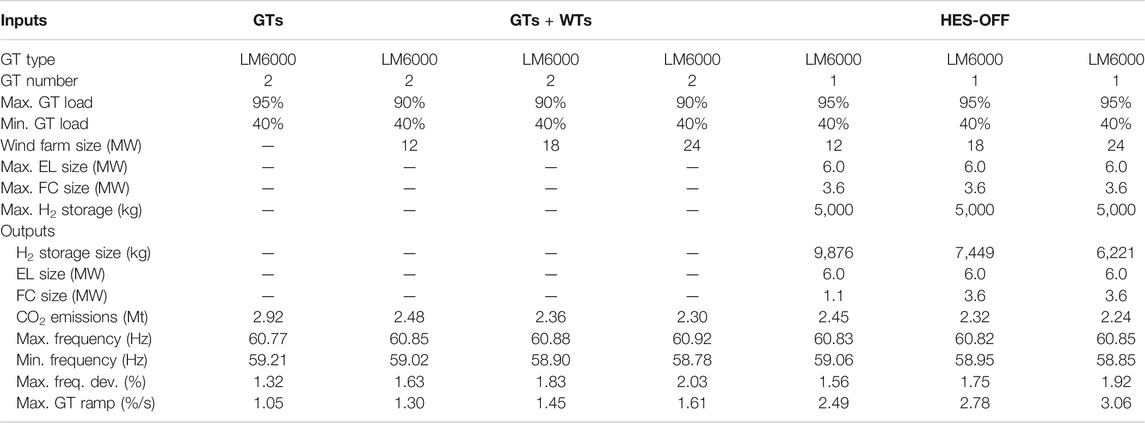
TABLE 3. Designs based on the LM6000 GT - Comparative analysis between a standard concept on GTs only (GTs), a concept involving GTs and WTs (GTs + WTs), and the proposed concept (HES-OFF).
In addition, the proposed designs contribute to decrease frequency deviations of the offshore grid when compared to the GTs + WTs ones. Note that the minimum frequency limit and hence the maximum frequency deviation can be respected in the proposed concept relying on the LM6000 GT with the 18 and 24 MW wind farms. This shows the importance of considering grid requirements in the design phase of a HES-OFF. Not least, the use of only one LM6000 GT in the proposed designs comes at the price of increased GT ramp rates. While these values are well below the critical ramp rate informed by the manufacturer, it is important to highlight that additional efforts by the GT governor may be required due to the continuous compensation of the wind power variation. Such operation could lead to premature failure of actuators by wear and tear and, consequently, additional maintenance of the GT as discussed in Troy et al. (2012).
3.3.2 Investigation of the Optimal Designs
The optimization framework allowed to further investigate the proposed HES-OFF designs and to fully understand the potential of this concept. The following sections present how some of the constraints imposed in the optimization procedure affect the objective functions to be minimized, namely the CO2 emissions and the H2 storage size.
3.3.2.1 Reference Case
The optimization process was initially implemented using only the long-term analysis, thus not including considerations on the grid stability. The Pareto fronts illustrated in Figure 4 were obtained by the optimizer using the reference wind data series from MET Norway. Table 4 shows the two optimal designs resulting in minimum cumulative CO2 emissions (Min CO2) and minimum size of the H2 storage (Min H2 storage).
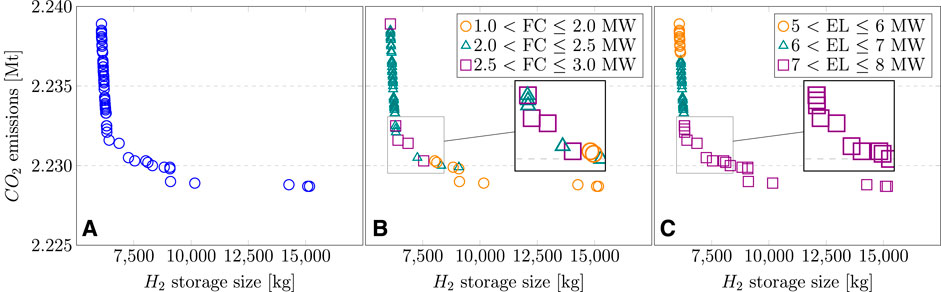
FIGURE 4. Pareto front 1 - the reference case, (A) shows a limited reduction of CO2 emissions, (B) highlights the different FC stack size ranges, and (C) the different EL stack size ranges.
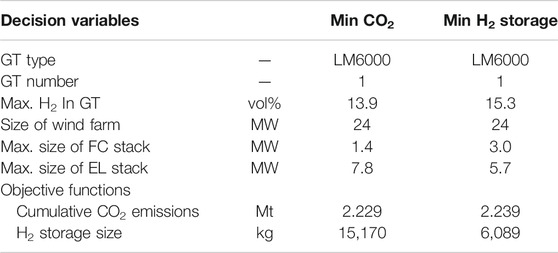
TABLE 4. Optimal designs of the reference case - Pareto 1.
The optimization process seems to have worked satisfactorily as a lower value for cumulative CO2 emissions and for H2 storage size were obtained when compared to the results of the parametric analysis. The optimal solutions cut CO2 emissions up to 1,300 kt compared to the standard GT-based concept, making up for a 36% reduction. However, Figure 4A shows that the reduction of CO2 emissions is somewhat limited for a large increase in the storage size. The range between the maximum and minimum level of CO2 emissions in the Pareto front is slightly higher than 10 kt. An analysis of the optimal solutions shows that only designs relying on the LM6000 GT were selected and only the largest possible size of the wind farm. This indicates that the H2 storage size is not strongly affected by the GT or wind farm sizes, while a large wind farm allows to cut more emissions. It is also interesting to note that the Pareto front displays a knee, after which emissions decrease only marginally while the size of the H2 storage increases significantly. The designs around the knee are consequently strong candidates to be the most relevant.
Moreover, effects of other input parameters were not so obvious. Figure 4B presents FC stack sizes for different Pareto designs. The designs resulting in the lowest emissions rely on relatively small FC stacks. This might indicate that the optimizer pointed toward the utilization of H2 not only in the FC but also in the GT, as much as possible. Therefore, it may be convenient to have the minimum FC stack size that ensures reliable operation and utilize the extra H2 in the GT. On the other hand, larger stacks are required when the priority is to reduce the H2 storage. Yet a maximum FC stack of 3 MW was obtained, quite below the maximum size allowed in the optimization (i.e., 5 MW). The results around the Pareto knee shows optimal FC sizes between 1.5 and 3 MW.
Figure 5 shows EL stack sizes for different Pareto designs. Large EL stacks are necessary to obtain the lowest possible CO2 emissions. However, the CO2 emissions reductions are rather limited while large EL stacks seem to be connected to large H2 storage. If a design in the vicinity of the Pareto knee is targeted, EL stacks of at least 7 MW should be envisaged.
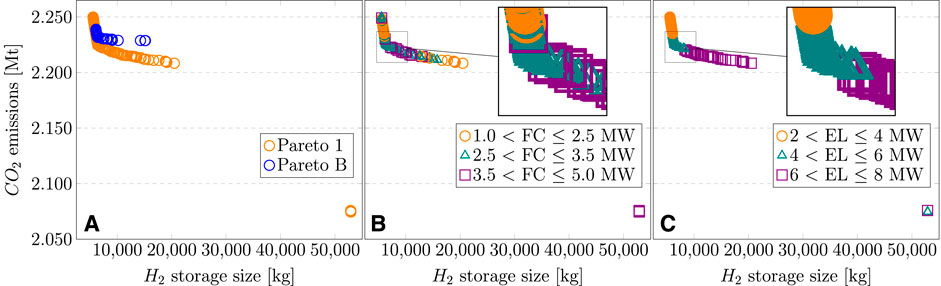
FIGURE 5. Pareto front 1B- constant performance of FC and EL stacks, (A) shows a larger reduction of CO2 emissions when compared to Pareto 1, (B) highlights the different FC stack size ranges, and (C) the different EL stack size ranges.
3.3.3.2 Constant Performance of Fuel Cell and Electrolyzer Stacks
A possible explanation of the limited range of CO2 emissions cuts obtained may be related to the relatively low round-trip efficiency of the ESS. To verify this, an optimization problem was defined in which a constant and relatively high efficiency was configured in FC and EL stacks, namely 66 MJ/kg H2 and 0.007 kg H2/MJ. The Pareto front obtained (Pareto 1B) was compared to Pareto 1 and results are illustrated in Figure 6. In addition, Table 5 shows the two optimal designs resulting in minimum cumulative CO2 emissions (Min CO2) and minimum H2 storage size of the (Min H2 storage) for Pareto 1B.
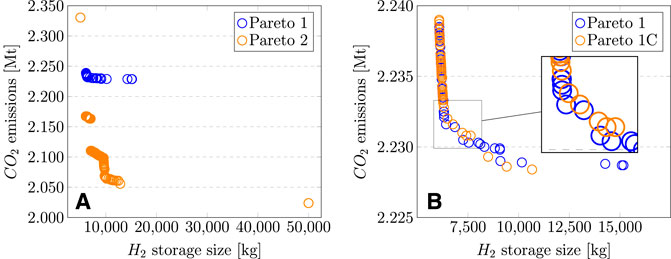
FIGURE 6. (A) Pareto front 2 shows a larger reduction of CO2 emissions when compared to Pareto 1, while (B) Pareto front 1C has fewer feasible solutions when compared to Pareto 1.
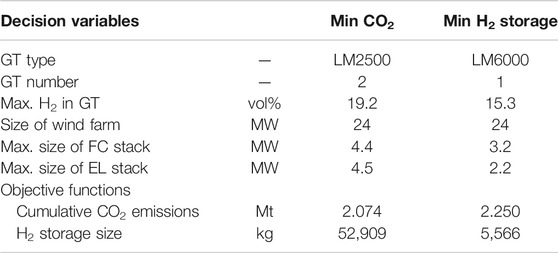
TABLE 5. Optimal designs of the constant FC and EL performance case - Pareto 1B.
With these adaptations, also optimal designs based on the smaller GT are obtained. Indeed, those designs reached the lowest cumulative CO2 emissions and are placed in the right bottom corner of Figure 6A. As expected, the better efficiency of the ESS resulted in a larger potential to reduce CO2 emissions. Nevertheless, the range of emission cuts is still limited, suggesting that there might be a hard limit to emissions reduction achievable by the proposed HES-OFF.
Figures 5B,C show the FC and EL stacks size ranges for the optimal designs identified in Pareto 1B. It can be observed that the larger efficiency led to a more intensive utilization of the FC, with optimal designs using up to 5 MW stacks. The influence on the optimal EL stack size is less apparent.
3.3.2.3 Alternative Wind Data
The wind speed data set used is expected to have a strong influence on the results. To this end, the optimization problem was run for an alternative wind data series, as described earlier in Section 2.3.5. The Pareto front obtained (Pareto 2) was compared to Pareto 1 and results are illustrated in Figure 6A. Table 6 shows the two optimal designs resulting in minimum cumulative CO2 emissions (Min CO) and minimum H2 storage size of the (Min H2 storage). The reference wind data series appears to be more challenging for the design of the hybrid system. The alternative wind dataset resulted in a performance improvement of the proposed HES-OFF, with cumulative CO2 emissions decreasing by about 10%, while a similar range of H2 storage size is obtained.
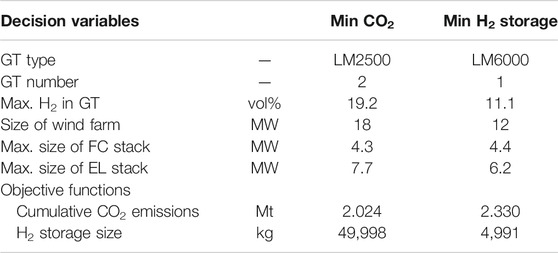
TABLE 6. Optimal designs of the alternative wind data case - Pareto 2.
3.3.2.4 Accounting for Electric Grid Dynamics
The last analysis makes use of the whole integrated model illustrated in Figure 2. The optimizer first tests the long-term performance of each design in terms of cumulative CO2 emissions and H2 storage size. The outputs of this analysis are then utilized as inputs to test the short-term grid stability. If a design is found not to comply with the grid dynamics criteria as reported, it is discarded. This integrated approach, composed of two consecutive steps, allows to direct the optimization toward process designs that are operationally feasible from the electric grid perspective.
The Pareto front obtained (Pareto 1C) is illustrated in Figure 6B and compared to Pareto 1, while Table 7 shows, for each of them, the two optimal designs resulting in minimum cumulative CO2 emissions (Min CO2) and minimum H2 storage size (Min H2 storage). It can be observed that the two Pareto fronts nearly overlap in large part of the solution space. That was expected as the same optimization problem was solved. The notable difference is Pareto 1C has fewer feasible solutions, because the optimizer rejected all designs that do not fulfill the dynamic criteria imposed. Those include the designs which returned the minimum CO2 emissions but the larger H2 storage size in the reference case.
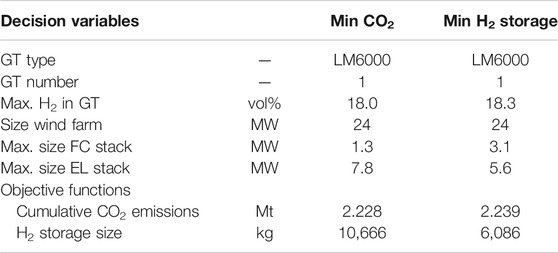
TABLE 7. Optimal designs accounting for grid dynamics - Pareto 1C.
4 Conclusion
This paper compared the performances of three concepts for stable power and heat supply in offshore oil and gas installations: a standard design relying solely on GTs, a state-of-the-art solution involving GTs and WTs without any storage, and a novel HES-OFF in which a H2-based ESS was integrated with GTs and WTs. The performances have been obtained through an integrated model, consisting of two macro-models representing the power unit and the offshore electric grid. Those are in turn constituted by sub-models properly developed to represent the various components of the system. The analyses carried out include the two domains embedded in the modeling – i.e., process and grid dynamics – and, therefore, involve different time scales – i.e., hours and seconds. They were therefore labeled long-term and short-term.
The long-term analysis is used to size the main process components of the system and to understand the effect of different design choices on the energy and environmental performance. The short-term analysis takes as input one given design and verifies the robustness of the proposed solution to electrical transients. Both domains are necessary to correctly evaluate the potentials and the limitations of the HES-OFF.
The proposed integrated model was then used to perform several analyses on the case study defined, an oil and gas platform in the North Sea. The proposed HES-OFF concept was first assessed by means of a parametric analysis, aiming to identify the key design parameters influencing the system performance. The effect of the type and number of gas turbines, the size of the wind farm, the size of the fuel cell and electrolyzer stacks, and the size of the hydrogen storage were tested. The outputs obtained were then compared to standard and state-of-the-art concepts to supply energy offshore. The main findings from the parametric analysis are:
• The proposed concept can significantly curb CO2 emissions compared to the standard concept based solely on gas turbines. A potential for CO2 emissions reduction of up to 40%, corresponding to around 1,400 kt of CO2, was observed.
• The proposed concept can as well further decrease CO2 emissions compared to the state-of-the-art concept as the energy storage system allows to more extensively exploit the offshore wind resource. In this case the emissions reduction is predictably more limited, ranging between 1% and 7%.
• For the parameters investigated, little effect was noted on the achievable CO2 emissions reductions. Those seem to be more constrained by technological limitations (e.g., roundtrip efficiency of the energy storage system, amount of H2 that can be fed to the gas turbine) than by design considerations.
• The obtained size of the underwater H2 storage appears to be reasonable if the designs are developed with proper constraints and a minor dissipation of wind power is allowed when necessary.
• The proposed designs improve the grid stability and allow a successful integration of larger wind power capacity in the offshore electric grid without overpassing the 2% frequency variation as in the case of standard integration of the wind farm.
While the parametric analysis gave a first picture of the feasibility of the proposed concept, the developed optimization framework produced a more comprehensive insight into the performance of the novel hybrid energy system. A multi-objective optimization based on a genetic algorithm was defined, where the two minimization objectives were the cumulative CO2 emissions and the hydrogen storage size. The optimizer provided Pareto front of optimal designs, outlining what is the best performance that can be expected by the proposed HES-OFF system. Moreover, the optimization results provide new important insights to understand the performance obtained and identify directions for further improvements. The main findings from the optimization are:
• The optimizer indicated a maximum CO2 emissions cut of almost 1,300 kt (i.e., 36% reduction) compared to the standard GT-based concept. The reduction compared to a standard integration of wind power an GT is limited to around 70 kt (i.e. 3% reduction). The emissions reductions achievable might be constrained by technological limitations.
• The optimizer generally selected the larger gas turbine (LM6000) as the best compromise for simultaneously constraining emissions and the hydrogen storage size.
• Relatively small fuel cell stacks (a maximum of 3 MW in the reference case) were obtained for the optimal designs. This might indicate that the fuel cell stack is designed to constrain the storage size and further increases are not advantageous for curbing emissions. It is rather preferable to increase the amount of hydrogen used in the gas turbine, than reconverting the storage into electricity.
• The wind dataset selected for the analysis has a strong influence on the results. An alternative dataset resulted in a performance improvement of the HES-OFF system, with a increase of emissions savings of 10%. This source of uncertainty must be properly addressed in the design of HES-OFFs.
• The designs targeting the minimum possible CO2 emissions might be critical in terms of electric grid stability and, accordingly, should be screened out by the short-term analysis.
Finally, it is worth highlighting that the two types of analyses allowed by the integrated model – long-term and short-term – were successfully included in the optimization problem. This is an innovative approach for the design of a HES-OFF where the optimizer is evaluating simultaneously the performance in terms of process metrics (energy efficiency, CO2 emissions etc.) as well as the robustness of the proposed solution to electrical transients and security of power supply.
Data Availability Statement
The original contributions presented in the study are included in the article/Supplementary Material, further inquiries can be directed to the corresponding author.
Author Contributions
Conceptualization, LR and LN; methodology, LR and EA; software, LR, MP, and EA; validation, LR, MP, and EA; formal analysis, LR and EA; investigation, LR, MP, and EA; resources, LN and ET; data curation, LR and EA; writing - original draft preparation, LR and EA; writing - review and editing, MP, ET and LN.; visualization, LR and EA; supervision, ET and LN; project administration, LN; funding acquisition, LR, LN, and ET.
Funding
This research was funded by the Research Council of Norway under the program PETROMAKS2, grant number 281986, project “Innovative Hybrid Energy System for Stable Power and Heat Supply in Offshore Oil and Gas Installation (HES‐OFF).”
Conflict of Interest
The authors declare that the research was conducted in the absence of any commercial or financial relationships that could be construed as a potential conflict of interest.
Supplementary Material
The Supplementary Material for this article can be found online at: https://www.frontiersin.org/articles/10.3389/fenrg.2020.607284/full#supplementary-material.
References
Alves, E., Sanchez, S., Brandao, D., and Tedeschi, E. (2019). Smart load management with energy storage for power quality enhancement in wind-powered oil and gas applications. Energies 12, 2985. doi:10.3390/en12152985
Årdal, A. R., Undeland, T., and Sharifabadi, K. (2012). Voltage and frequency control in offshore wind turbines connected to isolated oil platform power systems. Energy Proc. 24, 229–236. doi:10.1016/j.egypro.2012.06.104
Berge, E., Byrkjedal, Ø., Ydersbond, Y., and Kindler, D. (2009). “Modelling of offshore wind resources. Comparison of a meso- scale model and measurements from FINO 1 and North Sea oil rigs,” in Proceedings of EWEC 2009. E. W. E. Association (Red Hook, Curran Associates, Inc.), Vol. 4, 2327–2334.
Bothner, T. M., Knutsen, E., and Andersen Engedal, M. I. (2020). “Emissions to air 2019,” in Statistics Norway, Oslo, Norway. Tech. Rep.
Chiesa, P., Lozza, G., and Mazzocchi, L. (2005). Using hydrogen as gas turbine fuel. J. Eng. Gas Turbines Power 127, 73–80. doi:10.1115/1.1787513
Choi, Y., Lee, C., and Song, J. (2017). Review of renewable energy technologies utilized in the oil and gas industry. Int. J. Renew. Energy Resour. 7, 592–598.
Fadaeinedjad, R., Moschopoulos, G., and Moallem, M. (2009). The impact of tower shadow, yaw error, and wind shears on power quality in a wind-diesel system. IEEE Trans. Energy Convers. 24, 102–111. doi:10.1109/TEC.2008.2008941
Gelaro, R., McCarty, W., Suárez, M. J., Todling, R., Molod, A., Takacs, L., et al. (2017). The modern-era retrospective analysis for research and applications, version 2 (MERRA-2). J. Clim. 30, 5419–5454. doi:10.1175/JCLI-D-16-0758.1
Goldmeer, J. (2019). Power to gas: hydrogen for power generation - fuel flexible gas turbines as enablers for a low or reduced carbon energy ecosystem. Boston: General Electric Company.
Hanssen, J. E., Margheritini, L., Mayorga, P., Hezari, R., O’Sullivan, K., Martinez, I., et al. (2015). “Design and performance validation of a hybrid offshore renewable energy platform,” in Tenth International Conference on Ecological Vehicles and Renewable Energies (EVER), Monte-Carlo, Monaco.
He, W., Jacobsen, G., Anderson, T., Olsen, F., Hanson, T. D., Korpås, M., et al. (2010). The potential of integrating wind power with offshore oil and gas platforms. Wind Eng. 34, 125–137. doi:10.1260/0309-524X.34.2.125
Honrubia-Escribano, A., Gómez-Lázaro, E., Molina-García, A., and Fuentes, J. (2012). Influence of voltage dips on industrial equipment: analysis and assessment. Int. J. Electr. Power Energy Syst. 41, 87–95. doi:10.1016/j.ijepes.2012.03.018
IEC (2019). Wind energy generation systems - Part 3: design requirements for floating offshore wind turbines (Geneva, Switzerland: International Electrotechnical Commission). Tech. Rep. IEC 61400-3:2019.
IEC (2015). Mobile and fixed offshore units - electrical installations (Geneva, Switzerland: International Electrotechnical Commission). Tech. Rep. IEC 61892:2015.
Kelly, M. (2018). From standard wind measurements to spectral characterization: turbulence length scale and distribution. Wind Energ. Sci. 3, 533–543. doi:10.5194/wes-3-533-2018
Konkraft (2020). The energy industry of tomorrow on the Norwegian continental Shelf: climate stategy towards 2030 and 2050. Tech. Rep. 2020-1. Konkraft.
Korn, M., Mesineni, S., and Hu, W. (2018). Offshore powering with a closed loop and bus: coupling energy storage for maritime electrical networks. IEEE Ind. Appl. Mag. 24, 43–51. doi:10.1109/MIAS.2017.2740443
Korpås, M., Warland, L., He, W., and Tande, J. O. G. (2012). A case-study on offshore wind power supply to oil and gas rigs. Energy Proc. 24, 18–26. doi:10.1016/j.egypro.2012.06.082
Kruck, O., Crotogino, F., Prelicz, R., and Rudolph, T. (2013). Overview on all known underground storage technologies for hydrogen. Tech. rep., HyUnder.
Kundur, P., Paserba, J., Ajjarapu, V., Andersson, G., Bose, A., Canizares, C., et al. (2004). Definition and classification of power system stability. IEEE Trans. Power Syst. 19, 1387–1401. doi:10.1109/TPWRS.2004.825981
Legorburu, I., Johnson, K. R., and Kerr, S. A. (2018). Multi-use maritime platforms - North Sea oil and offshore wind: opportunity and risk. Ocean Coast Manag. 160, 75–85. doi:10.1016/j.ocecoaman.2018.03.044
Liang, X. (2017). Emerging power quality challenges due to integration of renewable energy sources. IEEE Trans. Ind. Appl. 53, 855–866. doi:10.1109/TIA.2016.2626253
MacDonald, J. (2014). Providing scope for reducing the carbon footprint of an offshore oil rig. M.Sc. thesis. Glasgow: University of Strathclyde.
Mundheim, K. (2007). “Monotower platform with renewable power,” in Offshore mediterranean conference and Exhibition, Ravenna, Italy.
Nguyen, T.-V., Barbosa, Y. M., da Silva, J. A. M., and de Oliveira Junior, S. (2019). A novel methodology for the design and optimisation of oil and gas offshore platforms. Energy 185, 158–175. doi:10.1016/j.energy.2019.06.164
Nguyen, T.-V., Voldsund, M., Breuhaus, P., and Elmegaard, B. (2016). Energy efficiency measures for offshore oil and gas platforms. Energy 117, 325–340. doi:10.1016/j.energy.2016.03.061
Orlandini, V., Pierobon, L., Schløer, S., De Pascale, A., and Haglind, F. (2016). Dynamic performance of a novel offshore power system integrated with a wind farm. Energy 109, 236–247. doi:10.1016/j.energy.2016.04.073
Pimm, A., Garvey, S., and de Jong, M. (2014). Design and testing of energy bags for underwater compressed air energy storage. Energy 66, 496–508. doi:10.1016/j.energy.2013.12.010
Rafiee, A., and Khalilpour, K. R. (2019). Renewable hybridization of oil and gas supply chains. Cambridge: Academic Press. 331–372. Book section 11. doi:10.1016/b978-0-12-813306-4.00011-2
Riboldi, L., Alves, E. F., Pilarczyk, M., Tedeschi, E., and Nord, L. O. (2020). “Innovative hybrid energy system for stable power and heat supply in offshore oil & gas installation (HES-OFF): system design and grid stability,” in Proceedings of the 30th European symposium on computer aided process engineering (ESCAPE30). Amsterdam: Elsevier. 211–216.
Riboldi, L., and Nord, L. O. (2017). Concepts for lifetime efficient supply of power and heat to offshore installations in the North Sea. Energy Convers. Manag. 148, 860–875. doi:10.1016/j.enconman.2017.06.048
Riboldi, L., and Nord, L. O. (2018). Offshore power plants integrating a wind farm: design optimisation and techno-economic assessment based on surrogate modelling. Processes 6, 249. doi:10.3390/pr6120249
Riboldi, L., Völler, S., Korpås, M., and Nord, L. O. (2019). An integrated assessment of the environmental and economic impact of offshore oil platform electrification. Energies 12, 2114. doi:10.3390/en12112114
Roussanaly, S., Aasen, A., Anantharaman, R., Danielsen, B., Jakobsen, J., Heme-De-Lacotte, L., et al. (2019). Offshore power generation with carbon capture and storage to decarbonise mainland electricity and offshore oil and gas installations: a techno-economic analysis. Appl. Energy 233–234, 478–494. doi:10.1016/j.apenergy.2018.10.020
Sanchez, S., Tedeschi, E., Silva, J., Jafar, M., and Marichalar, A. (2017). Smart load management of water injection systems in offshore oil and gas platforms integrating wind power. IET Renew. Power Gener. 11, 1153–1162. doi:10.1049/iet-rpg.2016.0989
Staffell, I., and Pfenninger, S. (2016). Using bias-corrected reanalysis to simulate current and future wind power output. Energy 114, 1224–1239. doi:10.1016/j.energy.2016.08.068
Troy, N., Flynn, D., Milligan, M., and O’Malley, M. (2012). Unit commitment with dynamic cycling costs. IEEE Trans. Power Syst. 27, 2196–2205. doi:10.1109/TPWRS.2012.2192141
Keywords: offshore installations, hybrid energy system, energy storage, grid stability, design optimization, hydrogen
Citation: Riboldi L, Alves EF, Pilarczyk M, Tedeschi E and Nord LO (2020) Optimal Design of a Hybrid Energy System for the Supply of Clean and Stable Energy to Offshore Installations. Front. Energy Res. 8:607284. doi: 10.3389/fenrg.2020.607284
Received: 16 September 2020; Accepted: 12 November 2020;
Published: 23 December 2020.
Edited by:
Enhua Wang, Beijing Institute of Technology, ChinaReviewed by:
Yusuf Bicer, Hamad bin Khalifa University, QatarViktor Józsa, Budapest University of Technology and Economics, Hungary
Copyright © 2020 Riboldi, Alves, Pilarczyk, Tedeschi and Nord. This is an open-access article distributed under the terms of the Creative Commons Attribution License (CC BY). The use, distribution or reproduction in other forums is permitted, provided the original author(s) and the copyright owner(s) are credited and that the original publication in this journal is cited, in accordance with accepted academic practice. No use, distribution or reproduction is permitted which does not comply with these terms.
*Correspondence: Luca Riboldi, bHVjYS5yaWJvbGRpQG50bnUubm8=