- 1School of Electric Power Engineering, Nanjing Institute of Technology, Nanjing, China
- 2CGN New Energy Investment (Shenzhen) Co. LTD., Nanjing, China
In order to accurately identify the key lines in the photovoltaic (PV) grid-connected system, an identification method based on the improved PageRank algorithm is proposed. Firstly, the correlation matrix reflecting the electrical characteristics of the system is constructed using the line current-carrying rate, line breaking power flow transfer rate and line coupling rate, to replace the original network topology matrix. Secondly, through the entropy method, a comprehensive evaluation index based on electrical betweenness, load deviation rate and voltage shock rate is constructed to improve the distribution of the initial PageRank (PR) value of the PV grid-connected system. To study the changes’ impact of PVs active power outputs on the identification results of key lines in the Multi-PV power system, the HGWO-SVM (Hybrid Grey Wolves Optimized Support Vector Machine) algorithm was used to obtain the PVs daily outputs prediction curves and obtain fixed outputs of PVs at different periods, so as to study the impact of the variation of PV daily output on the key line identification. Taking the IEEE 39-node system containing multi-PV as an example, the identification results show that the improved PageRank algorithm is superior to the original method in line identification accuracy. The HGWO-SVM algorithm by adaptively modifying the cross operator and mutation operator also has a certain improvement in prediction accuracy. The changes of PVs daily outputs have different degree of influence on the line criticality (namely final PR value) during periods of high light intensity and other periods of light intensity.
Introduction
With the rapid development of power industry, large-scale interconnection of power systems has become the norm. However, with the continuous expansion of power grid, the application of UHV (ULTRA-High Voltage) technology, and the introduction of new energy sources such as wind power and PVs, the operating mechanism of the power system has become increasingly complex. The number of major blackouts, such as the “U.S.-Canada blackout,” which caused by minor accidents and lead to extended chain failure scope of the large system, is increasing day by day. Once a major blackout occurs, it will bring extremely huge national economic losses (Xu et al., 2003). Therefore, studying the identification of key lines of the power system and monitoring the key lines can effectively prevent the occurrence of potential large-scale accidents caused by cascading failures and improve the stability of the power system (Yang et al., 2015). Literature (Yi-jia et al., 2006) considers the active power output of the generator and the weighted topology structure of power grid, assuming that the power between buses only flows along the shortest path, and proposes the weighted line betweenness for key line identification, which does not match the actual power flow. Literature (Wei et al., 2010) proposed that weighted line betweenness is used for key line identification, and at the same time, the line betweenness is corrected with the peak value of all the line betweenness in a small area as an index. Literature (He et al., 2013) puts forward a new index to evaluate the vulnerability of the system structure by combining the system operation status and the line betweenness with weighted reactance. Literature (Wen-ying et al., 2013) uses power flow tracking algorithm to calculate the utilization of generators and loads on the line, and uses power flow interface number to identify key lines. Literature (Liu et al., 2016), based on the topology and operating status of the power grid, comprehensively considers a variety of factors, and proposes a comprehensive betweenness to identify vulnerable lines. Literature (Bai and Hong-miao, 2015) defines the betweenness of the mixed power flow based on the actual power flow path to make the identification result more in line with the actual power grid. Literature (Chen et al., 2018) uses branch active power flow to define line efficiency weights, and establishes a comprehensive vulnerability assessment index for power grids by obtaining global efficiency changes to identify power grid vulnerability. Literature (Yu et al., 2018; Zeng et al., 2018) combine the entropy weight method and the analytic hierarchy process to assign the weight of the identification index set to obtain the comprehensive evaluation index. The identification result is more comprehensive than the single betweenness identification result. The above models are all based on the conventional grid topology and operating status, and use one or more indicators for identification. Literature (Chen et al., June 2007; Chu and Iu, 2017) propose to apply the complex network theory to the power system, and identify key lines based on the complex network theory. Literature (Fan et al., 2018) proposes a DKsPS identification method that considers the decomposition depth of the K-shell and the literature (Fan et al., 2018) uses an improved structural hole theory (ISH method) to consider the coupling relationship between lines. Literature (Ma et al., 2016; Ma et al., 2017; Ma et al., 2019) introduce the concept of hidden faults based on the consideration of the grid topology and operating status. The PageRank algorithm can consider the impact of hidden faults on line identification due to its own characteristics. The identification results are similar to the above based on multiple betweenness. The identification result is more in line with the actual power grid. Consider that new energy sources are connected to the grid, which will have an impact on the stability of the grid, which will affect line identification (Li et al., 2018). Literature (Ni et al., 2019) combines entropy weight method and analytic hierarchy process to establish key line comprehensive evaluation indicators based on the impact and disconnection consequences of the line to identify wind and solar grid-connected systems. Literature (Tao et al., 2020) uses the method of discretizing the probability distribution of output error to consider the output fluctuation of wind power grid-connected power, combining line load rate and power flow betweenness for identification. Literature (Zhu et al., 2019) considers generator output capacity and load size as main factors, using comprehensive weighting method of game theory to identify importance of transmission line. Literature (Zeng et al., 2020) puts forward the line weakness index, calculate the weak line of the power grid considering the transient stability constraints. Literature (Zhang et al., 2020) establishes a comprehensive evaluation model of fragile lines that considers the relative structural fragility and state evaluation indicators, and realizes the classification of fragile lines from the two perspectives of grid topology and operating status.
Most of the above methods do not consider the new energy access to the system, or the method of considering the new energy grid connection only reflects the difference between whether the system is connected or not. For this reason, this paper considers the line current carrying rate under N-1 fault, the line breaking power transfer rate and the line coupling rate constitute the correlation index, and the electrical betweenness, load deviation rate and voltage impact rate constitute a comprehensive evaluation index. Using the HGWO-SVM algorithm to predict daily PVs output, to predict output more time interval, force analysis, by comparing the different key line identification result of the output time, at different times of the research on PVs output impact on line identification results.
PageRank Algorithm
Algorithm Identification
Google's classic algorithm — PageRank is originally used to rank the importance of the page. In the circuit identification used in the power system, it is necessary to convert the research object from the page node to the line between the two nodes, taking into account the network topology and the line. Electrical connection. The PageRank algorithm considers that the jump of web page browsing is random and average, the PR value of each node is transferred to the next pointing node on average. Due to the characteristics of the power grid, the degree of correlation between the lines is different. Therefore, the distribution of PR values for the power grid lines must comply with the electrical correlation of the grid:
(1) Through N-1 verification, establish a line correlation matrix G based on line current carrying rate, line breaking power transfer rate and line coupling rate.
(2) Determine the initial PR value of the line based on the comprehensive evaluation index of electrical betweenness, load deviation rate and voltage shock rate.
(3) Introduce virtual nodes in the correlation network to construct the topology matrix
Correlation Matrix
Construct the correlation matrix G based on the N−1 verification:
Among them:
Line Current Carrying Rate
In the formula:
Line Breaking Power Transfer Rate
In the formula:
Line Coupling Rate
In the formula:
Construct the correlation index
The elements of the correlation matrix G reflect the coupling electrical connection between the lines after the system is simulated based on branch breaking, and reflect the criticality of the line. For the line to be evaluated, the higher the criticality and quantity of other lines associated with it The more the number, the more critical the performance of the line, which is also the rationality of introducing the PageRank algorithm into the power grid for key line identification.
Initial PR Value of the Line
Due to the influence of the topology and other factors on the line in the system, it is not the average distribution of the initial PR value of the traditional page. Therefore, in this paper, the initial PR value of the line is determined by the comprehensive evaluation index composed of the electrical betweenness, load deviation rate and voltage shock rate of the conventional network.
Electrical Betweenness
In the formula: S and L are the set of power generation and load nodes;
Load Deviation Rate
In the formula:
Voltage Shock Rate
In the formula: L is the collection of load nodes,
The entropy method is used to normalize the above three indicators and determine the weight of the three indicators. Establish a comprehensive evaluation index, and based on the criticality of the network topology, assign the weight of the initial PR value to each line of the original network. To achieve the goal of assigning more weight to lines with high topology and less weight to lines with low topology. Make the allocation of the initial PR value more reasonable.
Expansion Matrix
The introduction of virtual nodes in the system indicates hidden faults. The virtual nodes are connected to all nodes of the system. The virtual nodes are processed in the method proposed in Ma et al. (2016) and Ma et al. (2017) to establish an expansion matrix, whose elements are defined as follows:
(1)
(2)
(3)
Among them: the parameter ε represents the correlation factor of the hidden fault’s influence on the lines i and j.
By Eqs. 10–12, the established correlation matrix G is extended to an extended matrix
The
Hybrid Gray Wolf Optimization Support Vector Machine Algorithm
In this paper, the HGWO-SVM is used to predict the output of PVs. Based on the HGWO-SVM prediction model proposed in literature (Deng et al., 2019), the mutation operator and crossover operator are adaptively improved to avoid fall into the local optimum and enhance the overall convergence performance.
Mutation and Cross-Adaptive Improvement
Differential evolution (DE) regroups according to the differences between individuals in the process of population evolution to obtain a highly competitive intermediate population, and future generations and fathers obtain the next generation population through competition (Zhang et al., 2017). Differential evolution improves GWO mainly in three steps: mutation, crossover and selection.
(1) Mutation: Choose two different individuals
(2) Crossover: Compare the crossover operator and the random number to determine the source of the mutated gene; by improving the crossover operator CR to make it smaller first and then larger, the crossover operator is improved as follows:
In the formula, the value of CR shows a monotonous increasing trend, so the population diversity of the algorithm is better in the early stage, and the convergence speed is faster in the later stage.
(3) Selection: After mutation and crossover operation, mutant individual U(t+1) competes with individual X(t+1). If the parent individual is better than the new child individual, the parent is retained, otherwise the child is retained To continue to the next mutation.
Hybrid Gray Wolf Optimization Support Vector Machine Prediction Process
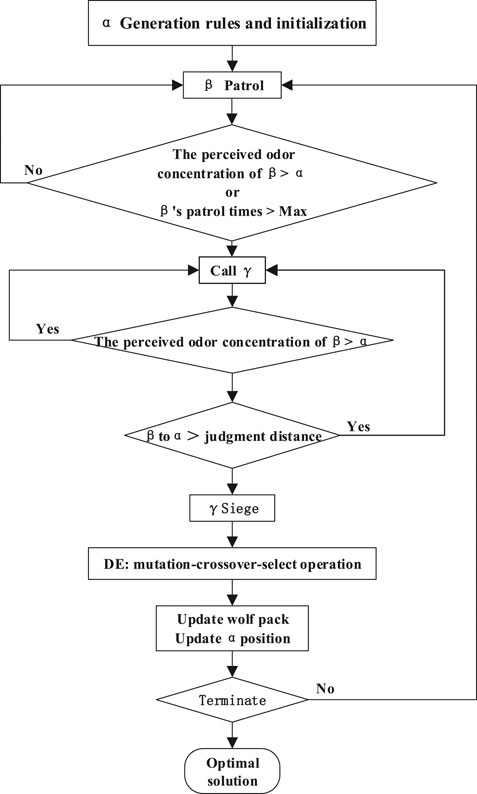
The gray wolf algorithm (GWO) optimization is inspired by the social class and predatory behavior of wolves in nature (Mirjalili et al., 2014). The relationship between the social class and behavior of wolves is shown in Figure 1.
GWO’s prediction idea: As the leader of the wolf pack, the head wolf is responsible for commanding the wolf pack, and makes decisions that can capture prey as soon as possible and avoid falling into danger through the information obtained by the companion. A few elites in the wolves are responsible for hunting. They often hunt in the prey activity area, search according to the characteristic smell of the prey, and always approach the prey toward the most concentrated area. Once the detective wolf finds its prey, the wolves around to get information will participate in the hunting together.
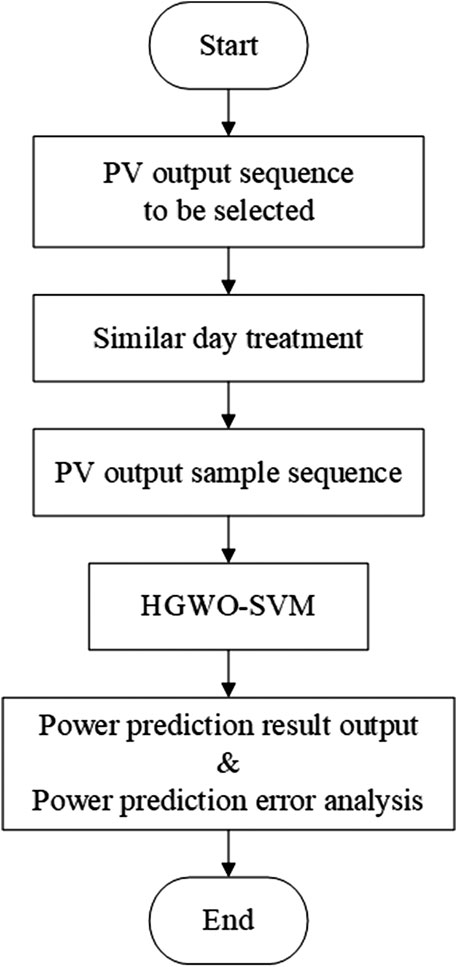
By adaptively improving F and CR, the local search capability of HGWO-SVM is improved to avoid falling into local optimum. The HGWO-SVM prediction process is shown in Figure 2 and the specific prediction steps are shown in Figure 3.
Simulation
PageRank Line Identification
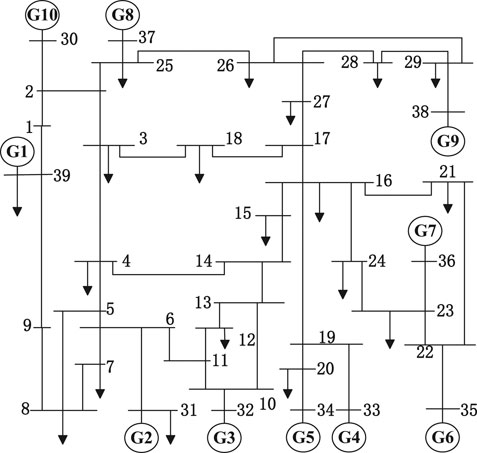
The IEEE 39-node system model is established based on the PSAT. The IEEE 39-node system is shown in Figure 4.
The identification steps are as follows:
(1) Establish a correlation matrix G that can visually reflect the electrical connection through the line current carrying rate, line breaking power transfer rate, and line coupling rate, and further derive the expansion matrix
(2) Use the entropy weight method to determine the entropy weight of the electrical betweenness, load deviation rate and voltage shock rate. Construct a comprehensive evaluation index to determine the initial PR value of the original network line to replace the average PR value of the traditional PageRank algorithm.
(3) Complete the line identification through the PageRank algorithm, delete the PR value of the n + 1st element, and sort the PR values of the remaining lines to complete the identification. The higher the PR value, the higher the criticality of the line.
Table 1 is the entropy weight method to determine the weight distribution of electrical betweenness, load deviation rate and voltage shock rate. Table 2 is the comparison between the circuit identification results obtained by this method and several existing identification methods.
The identification results are shown in Table 2. Comparing several methods in this paper, it can be found that the identification results of the various identification methods are slightly different due to the different identification angles. Through identification, it can be found that the lines in the system that are closer to the power generation node, such as l25–2,l2–3, l29–28, l22–21, and the long-distance hub lines in the system, such as l16–19, l16–17 are critical lines in the system. Among them, l25–2 can be judged to be the most critical line. After l25–2 fails, the system will be disconnected, and the area where the G8 and G10 are located will change from the original dual power supply to single power supply. Which will affect the degree of coupling of the entire network, leading to a wide range of voltage and power flow changes. Literature (Zeng et al., 2018), (Zhu et al., 2019) and (Zeng et al., 2020) regard l16–19 as the most critical line, which is the result of all methods taking voltage change as the main influencing factor. This article uses the voltage offset as one of the basis for determining the initial PR value distribution of the network, so there are differences in the ordering of the same key lines. Through the comparison of the first 10 lines, it can be found that there are four to six lines in the set of key transmission lines identified by the six methods are the same, but the order of the same key lines is different, and the identification angles of these six methods are different. There are different degrees of difference, and this method ignores the sequence of identification lines and only considers the results of line identification, which is roughly consistent with the above six methods, which confirms the correctness of the method used in this article.
HGWO-SVM Photovoltaic Ultra-short Term Forecast
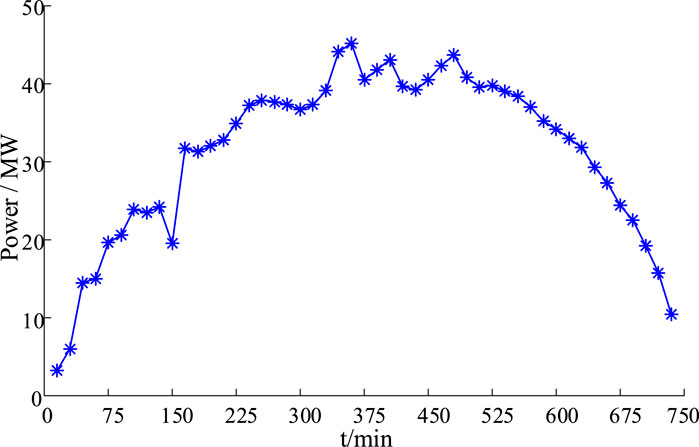
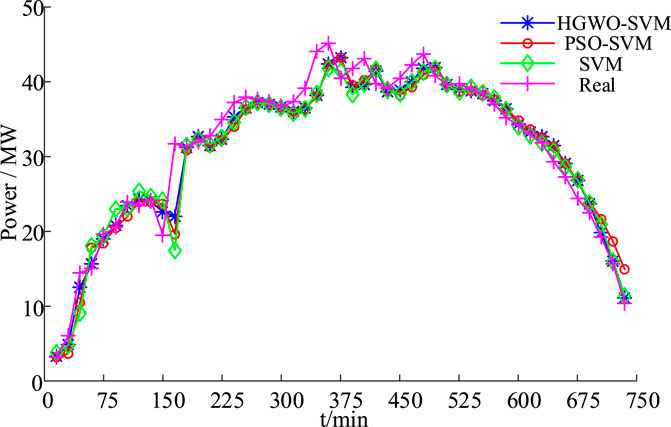
This paper takes a photovoltaic power plant in Florida (installed capacity of 58 MW) as an example to collect the actual output power data of the PVs from 6:15 on July 1, 2016 to 18:15 on August 1, and the selected collection time interval is about 15 min, there are 1225 groups in total. The first 980 sets of data are used for training, and the last 49 points are predicted 15 minutes in advance. The actual PV output is shown in Figure 5.
In this paper, HGWO-SVM, SVM and PSO-SVM are used for predictive comparison analysis. In order to verify the validity of HGWO-SVM prediction, three types of analysis, mean absolute error (MAE), mean relative error (MAPE) and root mean square error (RMSE) are used. The indicator, the indicator expression is as follows:
In the formula:
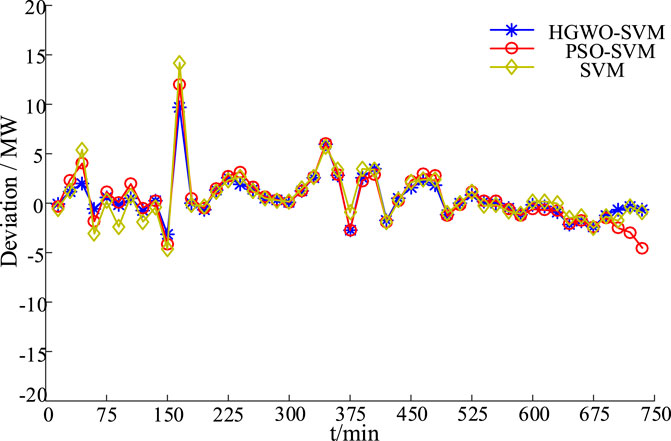
The prediction comparison, prediction error comparison and prediction output index comparison of HGWO-SVM, PSO-SVM and SVM are shown in Figures 6, 7 and Table 3.
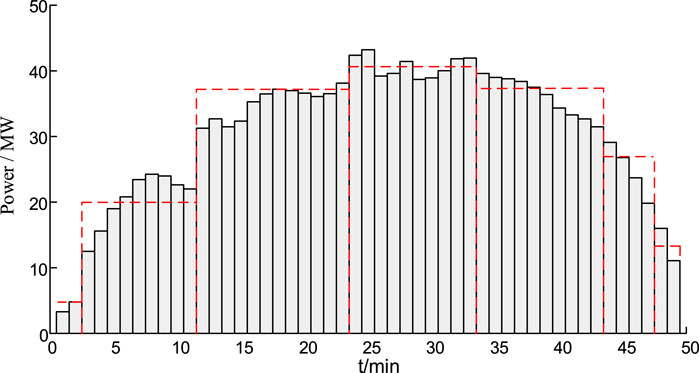
From the analysis of Figures 6, 7 and Table 3, we can see that the HGWO-SVM prediction method is superior to other methods: HGWO-SVM prediction data is closer to the actual data, and the prediction error is smaller than the original SVM and PSO-SVM. Therefore, the predicted output curve of HGWO-SVM can be divided into approximate time periods to obtain the approximate PVs output power maps of different time periods, as shown in Figure 8.
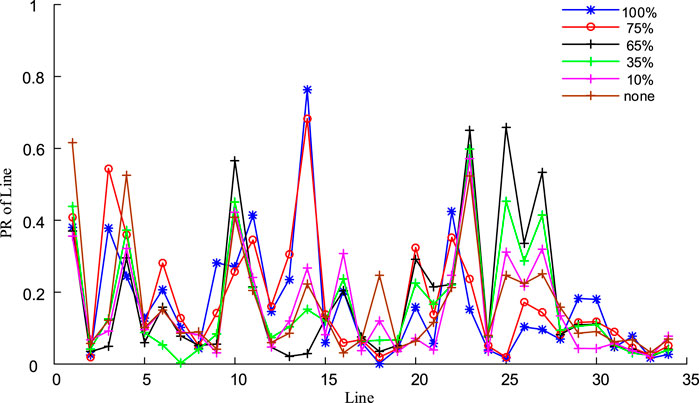
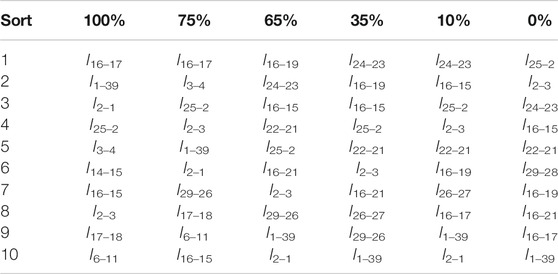
The photovoltaic capacity configuration is based on the standard of not exceeding 20% of the load of the access node. In PSAT, multiple nodes are connected to the photovoltaic power supply, as follows: node 8, node 20 (100 MW), node 3, 4, 15, 16, 21, 23, 24, 27, 29 (50 MW), nodes 7, 25, 28 (20 MW). According to the simulation of the approximate PVs output in Figure 7 for simulation analysis, it can be found that the output of the PVs power plant is more than 50% during the sunrise time period, and the output from noon to 3 PM is higher than 50%. 70%, and the output in the morning and evening is smaller, less than 25%. Therefore, according to the approximate determination of PVs in different time periods, the system line identification in different time periods is carried out. The fixed output settings for different periods are: theoretical full output, maximum output at noon (75%), output at noon (65%), output at morning (evening) (35%), output at morning (evening) (10%) and no PV. The comparison of multi-period line identification results is shown in Figure 9 and Table 4.
According to the comparison in Figure 9, it can be found that during the period when the PVs output is less than 65%, that is, the light intensity is not high, the PR value of the line changes generally proportionally with the change of the PVs output. During this period, the key line that was originally ranked at the top still belongs to the key line, only the criticality of these lines fluctuates slightly. For example, the critical order of the lines l24–23 and l16–19 which directly connected to the PVs has changed slightly. Among them, the criticality of l24–23 exceeds l25–2. Therefore, the period of low output has little impact on the line identification results, and the key line identification results are similar to the key line identification results of the unconnected photovoltaic; while in the high light intensity period of noon, that is, the PVs output reaches 75% and above during this period, It can be clearly found that the key lines of the system have changed. Analysis of Table 4 shows that during periods of high light intensity, the criticality of lines such as l16–17, l3–4 and l14–15 has changed significantly: the criticality of lines directly connected to PVs has changed significantly, such as l16–17 becomes the most critical line. For example, the criticality of l2–1 and l1–39 changes greatly, and it is ranked high in the recognition results, while l3–4 and l14–15 change from the original sub-critical line to the key line. Therefore, during periods of high-intensity lighting, PVs output has a greater impact on the line identification results.
Conclusion
The identification of key lines of the power grid can play a role in preventing and analyzing cascading failures of the power system in an environment where the proportion of new energy grids is increasing. In this paper, the improved PageRank algorithm is used to identify the key lines of the IEEE 39-node system, and on this basis, the influence of multi-PV grid connection power changes on the line identification is considered. Through calculation example, it can be found that:
(1) The improved PageRank identification method comprehensively considers the network characteristics and electrical characteristics of the system, and the identification accuracy is improved compared with the original method; combined with the identification results, it can be found that the lines closer to the power generation nodes in the system and the long-distance hub lines in the system are the key line in the system.
(2) By adaptively improving the mutation operator and crossover operator in HGWO-SVM, the prediction accuracy of HGWO-SVM has been improved to a certain extent.
(3) In the period when the light intensity is not high, the criticality of the line changes generally proportionally with the change of the PVs output, but the original critical degree of the line is still a critical line during this period, so the period of low PVs output is The influence of the line identification result is small; while the period of high light intensity, the criticality of the line changes significantly, and the identification result also changes. Therefore, the period of high PVs output has a greater impact on the line identification result.
This paper simulates the sunrise power change of PVs output by the method of predicting the curve to determine the output in time, and there are still in and out; while the transmission grid as a network with a large area, the PVs output at different positions will not generally change synchronously. Different factors, such as the time difference of light, will lead to the unsynchronized changes of PVs output, which is also the focus of later work.
Data Availability Statement
The original contributions presented in the study are included in the article/Supplementary Material, further inquiries can be directed to the corresponding author.
Author Contributions
HF and SL provided the idea and conducted this research. HL participated in partial work.
Funding
This work is supported by the University Student Technological Innovation “Challenge Cup” Support Project of Nanjing Institute of Technology (TZ20190008). Project Name: Voltage stability monitoring for PV-connected power system based on PMU. ATTRIBUTES: University projects, non-commercial projects.
Conflict of Interest
Author HL was employed by the company CGN New Energy Investment (Shenzhen) Co. LTD.
The remaining authors declare that the research was conducted in the absence of any commercial or financial relationships that could be construed as a potential conflict of interest.
References
Bai, H. A. O., and Hong-Miao, S. H. I. (2015). Hybrid flow betweenness approach for identification of vulnerable line in power system. IET generation. Transm. Distrib. 9, 1324. doi:10.1049/iet-gtd.2014.1016
Chen, W. U., Hai-teng, H., Wan-chun, Q., Wen-jia, Z., Wen-tao, S., and Hui, C. (2018). Research on identification method of power system vulnerability based on improved line efficiency. Electric Power Engineering Technology/Dianli Gongcheng Jishu 37, 64–68. doi:10.19464/j.cnki.cn32-1541/tm.2018.05.011
Chen, X., Sun, K., Cao, Y., and Wang, S. (2007). “Identification of vulnerable lines in power grid based on complex network theory.” in Proceedings of 2007. Tampa, FL, (IEEE Power Engineering Society General Meeting), 24–28.
Chu, C-C., and Iu, H. Ho-Ching. (2017). Complex networks theory for modern Smart grid applications: a survey. IEEE Trans. Emerg. Sel. Topics Circuits Syst. Circuits and Systems 7, 177–191. doi:10.1109/PES.2007.385733
Deng, S., Wang, X., Zhu, Y., and Fei, L. (2019). Hybrid grey wolf optimization algorithm–based Support vector machine for grout ability prediction of fractured rock mass. J. Comput. Civ. Eng. 2, 33. doi:10.1061/%28ASCE%29CP.1943-5487.0000814?af=R
Fan, W.-L., Wen, F., Zhang, X.-M., Mei, S.-W., and Huang, S. (2018). Vulnerable transmission line identification considering depth of K-shell decomposition in complex grids. IET Gener., Transm. Distrib. 12, 1137–1144. doi:10.1049/IET-GTD.2017.0767
Fan, W., Zhang, X., Mei, S., and Shaowei, H., Wei, W., Lijie, D. (2018). Vulnerable transmission line identification using ISH theory in power grids. IET Gener. Transm. Distrib. 12, 1014–1020. doi:10.1049/iet-gtd.2017.0571
He, J., Pang, S.-L., Yan, B., and Zhang, W.-M. (2013). Identification of vulnerable lines of power grid based on capacity median index. Power System Protection and Control/Dianli Xitong Baohu yu Kongzhi 41, 30–35. doi:10.7667/j.issn.1674-3415.2013.08.005
Li, S., Wei, Z., and Ma, Y. (2018). Fuzzy load-shedding strategy considering photovoltaic output fluctuation characteristics and static voltage stability. Energies 11 (4), 779. doi:10.3390/en11040779
Liu, X., Mao, Y., Liang, S., Li, Y., Fan, X., Deng, H., et al. (2016). Identification of vulnerable lines in power grid based on integrated median. Power System Protection and Control/Dianli Xitong Baohu yu Kongzhi 44, 116–121. doi:10.7667/j.issn.1674-3415.2016.02.016
Ma, Z., Liu, F., Shen, C., and Zhang, S. (2016). Rapid identification of vulnerable lines in power grid using modified PageRank algorithm —— Part I: theoretical foundation. Proceedings of the CSEE/Zhonggong Dianji Gongcheng Xuebao 36, 6363–6370. doi:10.13334/j.0258-8013.pcsee.161352
Ma, Z., Liu, F., Shen, C., and Zhang, S. (2017). Rapid identification of vulnerable lines in power grid using modified PageRank algorithm —— Part II: factors affecting identification results. Proceedings of the CSEE/Zhonggong Dianji Gongcheng Xuebao 37, 36–44. doi:10.13334/j.0258-8013.pcsee.161353
Ma, Z., Shen, C., Liu, F., and Mei, S. (2019). Fast screening of vulnerable transmission lines in power grids: a PageRank-based approach. IEEE Transactions on Smart Grid 10, 1982–1991. doi:10.1109/TSG.2017.2785267
Mirjalili, S., Mirjalili, S. M., and Lewis, A. (2014). Grey wolf optimizer. Adv. Eng. Software 69, 46–6110. doi:1016/j.advengsoft.2013.12.007
Ni, L., Wen, J., Zhang, X., and Lyu, G. (2019). Identification for vulnerable lines in wind-solar power grid based on weighted disconnection probability and severity of disconnection consequence. High. Volt. Eng./Gaodianya Jishu 45, 4013–4020. doi:10.13336/j.1003-6520.hve.20191125029
Tao, H., Xie, D., Zhao, F., Guo, C., Yang, C., and Shen, Y. (2020). Comprehensive identification of critical line in power systems with large-scale wind power integration. Power System Protection and Control/Dianli Xitong Baohu yu Kongzhi 48, 115–123. doi:10.19783/j.cnki.pspc.190547
Wei, Z., Liu, J., Li, J., Han, W., and Pan, R. (2010). Vulnerability analysis of electric power network under a directed weighted topological model based on the P-Q networks decomposition. Power System Protection and Control/Dianli Xitong Baohu yu Kongzhi 38, 19–22. doi:10.7667/j.issn.1674-3415.2010.24.004
Wen-ying, L., Cai, L., Xu, P., Dan, Y., Wang, J., and Wang, W. (2013). Identification of critical lines in power systems based on tidal currents. Proceedings of the CSEE/Zhongguo Dianji Gongcheng Xuebao 33, 90–98. doi:10.13334/j.0258-8013.pcsee.2013.31.012
Xu, H., Zhang, Q., Li, G., Huang, Z., and Zhou, J. (2003). Lessons and enlightenment from the "August 14" blackout in the United States and Canada-concurrently on the resolution of the major risks of "August 29" and "september 4" in east China power grid. East China Electric Power/Huadong Dianli 31, 3–13. doi:10.3969/j.issn.1001-9529.2003.09.002
Yang, H., Wu, G., Song, X., Song, Y., and Zheng, C. (2015). Power system security. Beijing, China: China Electric Power Press.
Yi-jia, C., Chen, X., and Sun, K. (2006). Identification of vulnerable lines in power grid based on complex network theory. Electric Power Automation Equipment/Dianli Zidonghua Shebei 26 (121–125), 31.
Yu, Q., Qu, Y., and Liang, S. H. I. (2018). Identification of critical lines in power grid based on comprehensive critical degree. Sci. Technol. Eng./Ke Xue Ji Shu yu Gong Cheng 18, 246–252.
Zeng, L., Zeng, Xin., and Jia, L. V. (2018). Identification of vulnerable line of power grid in view of grid structure and running state. Smart Grid/Zhihui Dianli 46, 8–12.
Zeng, L., Yao, W., Ai, X., et al. (2020). Double Q-learning based identification of weak lines in power grid considering transient stability constraints. Proceedings of the CSEE/Zhongguo Dianji Gongcheng Xuebao 8, 40–2441.
Zhang, X. M., Tu, Q., Kang, Q., et al. (2017). Hybrid algorithm and function optimization of grey Wolf optimization and differential evolution. Computer Science/Jisuanji Kexue (9), 44–98.
Zhang, Y., Gu, X., Wang, T., Liu, Y., and Qin, X. (2020). Category identification of power grid vulnerable lines based on the vulnerable causes. Electrical Measurement & Instrumentation/Diance & Yibiao 15, 57–79. doi:10.19753/j.issn1001-1390.2020.15.012
Keywords: line identification, pagerank algorithm, photovoltaic, hybrid grey wolves optimized support vector machine, multi-photovoltaic power system
Citation: Feng H, Li S and Li H (2020) Identification of Key Lines for Multi-Photovoltaic Power System Based on Improved PageRank Algorithm. Front. Energy Res. 8:601989. doi: 10.3389/fenrg.2020.601989
Received: 02 September 2020; Accepted: 09 November 2020;
Published: 08 December 2020.
Edited by:
Chia-Chi Chu, National Tsing Hua University, TaiwanReviewed by:
Jian-Hong Liu, Yuan Ze University, TaiwanHeng-Yi Su, Feng Chia University, Taiwan
Yu-Jen Liu, National Chung Cheng University, Taiwan
Copyright © 2020 Feng, Li and Li. This is an open-access article distributed under the terms of the Creative Commons Attribution License (CC BY). The use, distribution or reproduction in other forums is permitted, provided the original author(s) and the copyright owner(s) are credited and that the original publication in this journal is cited, in accordance with accepted academic practice. No use, distribution or reproduction is permitted which does not comply with these terms.
*Correspondence: Sheng Li, bGlzaGVuZ19uaml0QDEyNi5jb20=
 Hao Feng1
 Sheng Li
