- 1Tongliao Power Supply Company, State Grid East Inner Mongolia Electric Power Company, Tongliao, China
- 2NARI Technology Development Co., Ltd., Nanjing, China
- 3Key Laboratory of Modern Power System Simulation and Control & Renewable Energy Technology, Ministry of Education, Northeast Electric Power University, Jilin, China
In order to analyze the impact of large-scale photovoltaic system on the power system, a photovoltaic output prediction method considering the correlation is proposed and the optimal power flow is calculated. Firstly, establish a photovoltaic output model to obtain the attenuation coefficient and fluctuation amount, and analyze the correlation among the multiple photovoltaic power plants through the k-means method. Secondly, the long short-term memory (LSTM) neural network is used as the photovoltaic output prediction model, and the clustered photovoltaic output data is brought into the LSTM model to generate large-scale photovoltaic prediction results with the consideration of the spatial correlation. And an optimal power flow model that takes grid loss and voltage offset as targets is established. Finally, MATLAB is used to verify that the proposed large-scale photovoltaic forecasting method has higher accuracy. The multi-objective optimal power flow calculation is performed based on the NSGA-II algorithm and the modified IEEE systems, and the optimal power flow with photovoltaic output at different times is compared and analyzed.
Introduction
In recent years, with the strong support of national policies, photovoltaic capacity of China has grown rapidly in the short duration (Mohammadi and Mehraeen, 2017). At the end of 2019, the national photovoltaic power generation capacity reached 224.3 billion kWh, a year-on-year increase of 26.3%. The “Three Norths” area is affected by the large scale of local new energy installations and the limited consumption space. This area abandoned 87% of the country’s photovoltaic power generation, and its light abandonment rate dropped by 2.3% year-on-year to 5.9% (Hashemi and Østergaard, 2017). In order to further reduce the national light abandonment rate, it is of great significance to study the large-scale photovoltaic output prediction method and its impact on the planning and operation of the power system (Bowen et al., 2016; Sun et al., 2017; Zhongkai et al., 2018).
New energy sources such as photovoltaics and wind power have volatility and randomness (Yang et al., 2016). How to improve the accuracy of new energy prediction has become a hotspot for both domestic and foreign scholars (Lorenz et al., 2009; Li et al., 2019). An improved vector auto-regression model that can combine historical PV output power with weather monitoring data is proposed. The model generates PV output simulation series and applies them to short-term forecasts for small-scale smart grids (Huang et al., 2014; Bessa et al., 2015). In (Ghislain et al., 2019), history data of adjacent power stations was applied to generate the probability density function of photovoltaic output based on quantile regression and Lasso penalty technology, which provides a theoretical basis for short-term photovoltaic output prediction. Cluster analysis methods are applied in the process of PV output modeling and reliability assessment. Based on the theory of cluster analysis, a multiscale time-series clustering model of solar irradiance intensity is developed from the perspective of data mining (Lin et al., 2018).
With the integration of large-scale new energy into the power grid, the regularity and volatility of new energy output have an increasing influence on the operating status of the system (Xia et al., 2016; Ye et al., 2019). Gaussian mixture models are applied to accurately establish source-load uncertainty models, due to the stochastic response of source-load interactions. An adaptive linearized semi-invariant method for probabilistic power flow calculation that considers the source-load strength randomness is proposed, which can effectively reduce the global linearization error of the power flow (Liu et al., 2019). Under the condition that the wind farm is connected to a hybrid AC-DC system, the optimal power flow problem of minimizing the total transmission loss is studied in the article. The internal point method (IPM) is applied when dealing with discrete variables as a way to improve the accuracy of the optimal solution (Cao et al., 2013). The traditional safety constrained economic dispatch model for provincial power grids is extended and applied to large power grids across provinces and regions. In order to solve the problem of optimal resource allocation over a large area, the model is further optimized to improve the solution efficiency. The economic dispatching problem of large-scale multi-region cogeneration units under different scenarios is studied in (Nazari-Heris et al., 2019), balancing the operation cost and pollutant emission targets, and the proposed method can reduce the cost of $1939534.08 per year. The impact of price uncertainty on active distribution network dispatching is studied in (Nazari-Heris et al., 2020), in which the multi-objective problem is solved by robust optimization algorithm and ε-constraints. In (Nazari-Heris et al., 2018), optimal stochastic scheduling of virtual power plant considering NaS battery storage and combined heat and power units is studied.
Due to the insufficient number of power plants modeled in the existing literature, PV output impact on the system at different moments and the spatially correlation of large-scale PV generation are not represented. Therefore, this paper proposes the optimal power flow calculation considering the correlation of large-scale photovoltaic power generation. First, in this paper, attenuation coefficients and fluctuations are obtained from PV output models and measured data, and the k-means method is used in the clustering analysis of PV output fluctuations in large-scale power plants. The attenuation coefficient and fluctuation amount through the photovoltaic output model and the measured data, and use the k-means method to cluster analysis on the photovoltaic output fluctuation of large-scale power stations. Secondly, establish an LSTM prediction model that considers spatial correlation, obtain a large-scale photovoltaic output prediction curve, and establish an optimal power flow model that takes power system loss and voltage offset as targets. Finally, the proposed large-scale photovoltaic prediction method and optimal power flow calculation model were simulated in the modified IEEE39-bus system and IEEE118-bus system, verifying that the prediction method has higher accuracy and the daily regularity of photovoltaic output has a greater impact on the system.
Correlation of Large-Scale Photovoltaic Output
Ideal Model of Photovoltaic Power Generation
The ideal output Pt of the photovoltaic power station without considering the influence of the shading and temperature is Eq. 1 (Wang et al., 2019):
Where Pstc is the output of photovoltaic panels under standard conditions (solar radiation intensity Istc = 1000 W/m2; temperature Tstc = 298 K).
The total solar radiation intensity at a certain place on the earth at time t is Eq. 2:
Where It is the solar radiation intensity without attenuation. Ib is the direct solar radiation. Id is the solar scattered radiation.
Ib is the main component of solar radiation. The direct solar radiation in a certain place can be expressed as (Yang et al., 2011):
Where S is the solar constant, about 1366 W/m2; N is the day sequence, which means the day number of the year; ρ is the solar incident angle, which is the difference between the solar zenith angle θZ and the photovoltaic panel inclination β; τb is the atmospheric transparency coefficient of direct solar radiation; M is the atmospheric mass, which is related to the altitude.
Where a is the altitude of the measuring place;
Due to the action of air molecules and erosol particles, light radiation energy is redistributed in a certain law to form scattered radiation (Bunea et al., 2006; Dall Anese et al., 2014). According to the Berlage formula, the intensity of solar scattered radiation is Eqs 6–8 (Yang et al., 2011; Zhang et al., 2014):
Where k is a parameter related to air quality. τd is the atmospheric transparency coefficient of scattered radiation. Φ is the latitude of the area; δ is the solar declination angle; ωs is the solar hour angle.
The solar declination angle changes with the seasons and is calculated by the following formula (Zhang et al., 2014):
Where N1 = 92.975 is the number of days from the vernal equinox to the summer solstice; α1 is the number of days from the vernal equinox; and so on, N2 = 93.269, N3 = 89.865, N4 = 89.012.
The time angle of the Sun is represented by ωs, sunrise is negative, sunset is positive, and it is 0° at noon, increasing by 15° every hour according to the rotation of the earth. Meanwhile, the time difference has an impact on ωs. Beijing time is the time in the eastern eight time zone, and the longitude of the interval is 120° east. The formula for calculating the time angle ωs based on Beijing time in a certain area is Eq. 10:
Where ψ is the local longitude; t is Beijing time.
Spatial Correlation Characteristics of Large-Scale Photovoltaic Output
Photovoltaic power generation is affected by a variety of practical conditions (Samadi et al., 2014; Lingfeng et al., 2017). Without considering the volatility, the theoretical output will be attenuated. The daily attenuation coefficient Ki is used to characterize the attenuation of photovoltaic output, the expression is Eq. 11:
Where Ki is the attenuation coefficient on the i day;
Eq. 11 uses the least squares method to find the best fitting coefficient, so that the squared residual sum of attenuated theoretical output and the measured output is minimized, which is the optimization problem of matching the theoretical model with the measured data.
Natural phenomena such as cloud movement, floating dust occlusion, etc., cause fluctuations in photovoltaic output and produce fluctuation components. The difference between the actual photovoltaic output and the theoretical attenuation output represents the fluctuation component ΔPt of the photovoltaic output, and its expression is Eq. 12:
The spatial correlation characteristics of photovoltaic output are affected by two spatial scales: large-scale weather and small-scale weather. Large-scale weather mainly affects the overall attenuation, while small-scale weather affects fluctuations. The similar fluctuations in photovoltaic output indicate that the geographical environment and weather conditions of the power station are similar, and the spatial correlation of photovoltaic output is high. Therefore, this paper clusters the fluctuations of each photovoltaic power station output in each power station group. By selecting the optimal cluster number, the final group result of the power station is obtained. The k-means method is used here to cluster the output fluctuations of multiple photovoltaic power stations, and the optimal cluster number of power stations is determined by the sum of squared error (SSE) within the group.
Photovoltaic Output Prediction Model Considering Spatial Correlation
Taking into account the spatial correlation between power stations can make the photovoltaic output prediction model more comprehensive and reduce the photovoltaic output prediction error. Therefore, this paper considers the fluctuation of photovoltaic output to perform a cluster analysis of large-scale photovoltaic power stations, and obtains the spatial correlation characteristics between the power stations, and then predicts the photovoltaic output of multiple photovoltaic power stations at the same time.
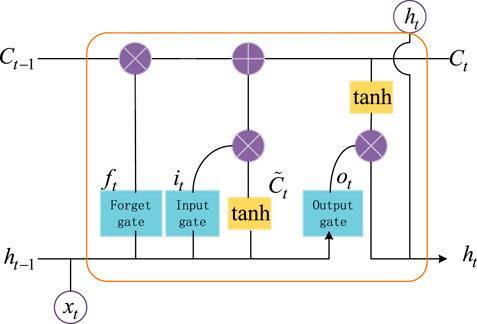
Long short-term memory (LSTM) neural network is an improved deep learning algorithm based on recurrent neural network (RNN), especially for processing time series with seasonal periodic changes. LSTM neural network consists of input layer, hidden layer and output layer. Figure 1 shows the unfolded cyclic network.
The LSTM gating mechanism contains three gates: forget gate ft, input gate it and output gate ot. In addition, the structure also contains an internal memory
Where Wf, Wi, Wo and Wc are the weight matrix; bf, bi, bo, bc are the bias parameters; σ are the activation functions that are usually rely or sigmoid functions; xt, Ct, ht are the input layer state, control unit state, and hidden unit state at time t, respectively.
The structure of the LSTM model is the same as the cyclic neural network. It can be seen as multiple copies of the same neural network, and each neural network module will pass the message to the next module. Taking the history output data and solar radiation intensity data of the target photovoltaic power station as the input of the LSTM network model, the expression of the prediction model can be obtained Eq. 14:
Where ht+1 is the predicted value of photovoltaic power of the target power station; ht, … , ht−n is the history data of photovoltaic output of the target power station; xt+1, … , xt−n is the solar radiation intensity data of the target power station.
Figure 2 is a block diagram of the photovoltaic output prediction model considering spatial correlation. There is a higher spatial correlation between the PV plants obtained by clustering with the above method. Taking the power stations in each type of power station group as the target power station in the prediction model, and using the history output data and solar radiation intensity data of each target photovoltaic power station as the input of the LSTM network model, a multi-dimensional photovoltaic output prediction sequence can be obtained at the same time. The prediction data from all PV clusters are summed to get the total predicted output of large-scale PV clusters in the province.
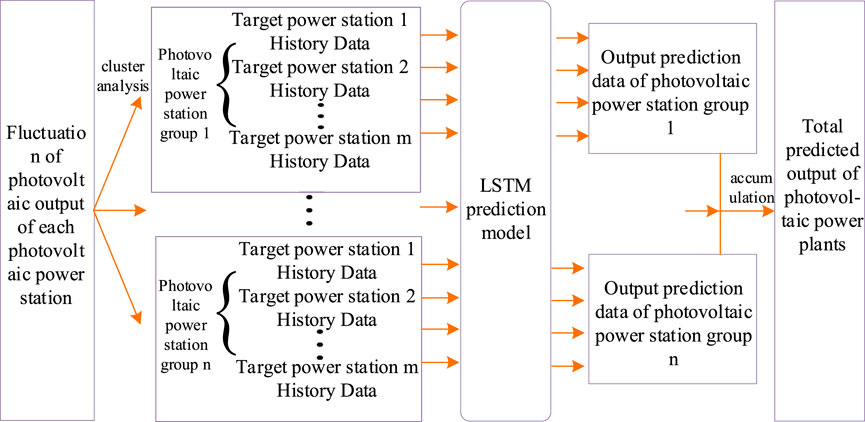
FIGURE 2. Structural diagram of photovoltaic output prediction model considering spatial correlation characteristics.
Optimal Power Flow Calculation
Optimal Power Flow Model
Based on the NSGA-II algorithm, this paper performs the optimal power flow calculation with the objective functions of active grid loss and voltage offset. The optimal power flow model consists of three parts: objective function, equality constraints and unequal constraints.
Objective Function
(1) Active power loss
Where Ploss is the total grid loss of the system, Pk.loss is the active power loss of branch k; gk is the conductance of branch k; NL is the set of AC and DC branches, and NVSC is the set of nodes of the converter station.
(2) Voltage offset
Where
Equality Constraints
Where PGi and QGi respectively represent active power and reactive power of generator output at node i, PLi and QLi respectively represent the active power and reactive power of the load at node i, and Ui and Uj represent the voltage amplitude of nodes i and j respectively. θij represents the phase angle difference between node i and node j, Gij and Bij represent the conductance and susceptance between node i and node j respectively, and NB is the set of power system nodes.
Inequality Constraints
Where PGimax, PGimin, QGimax, QGimin represent the upper and lower limits of the active power of the generator at bus i, and the upper and lower limits of output reactive power, respectively; Timin and Timax respectively represent the upper and lower limits of the adjustable ratio of the transformer at bus i, NT represents the number of transformers in the system, Uimax and Uimin respectively represent the upper and lower limits of bus i voltage, Plimax and Plimin respectively represent the upper and lower limits of the active power carried by the branch, NG represents the generator set, Nl is the power line set, and NB is the power system set.
Optimal Power Flow Solution
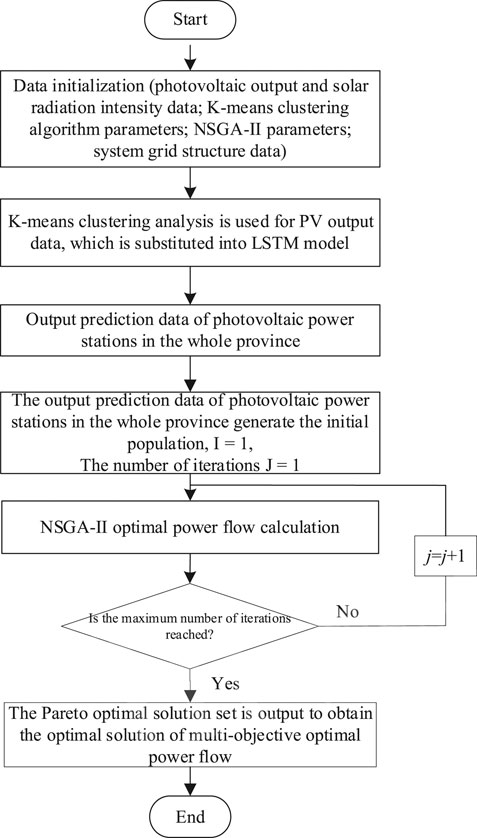
Figure 3 shows the flow chart of the optimal power flow using NSGA-II to consider photovoltaic correlation. Specific steps are as follows:
(1) Initialization parameters need to be set. The user has to set up the system grid structure, enter the PV output and solar irradiance data, k-means algorithm parameters and NSGA-II algorithm parameters.
(2) The paper uses the k-means clustering method to analyze the fluctuation of PV output, and then substitutes the history PV output data and other information of the power plants into the LSTM model, so as to obtain the predicted output of large-scale PV power plant clusters in the province.
(3) We then replace the photovoltaic output into the optimal power flow calculation model and carries on the optimal power flow calculation.
Example Analysis
Large-Scale PV Forecast Output
This paper uses the actual data of a large-scale centralized photovoltaic power station in a province as an example, intercepting the photovoltaic output from May to July 2018 for simulation. The data sampling interval is 15 min, and each photovoltaic power station contains 5,152 output data.
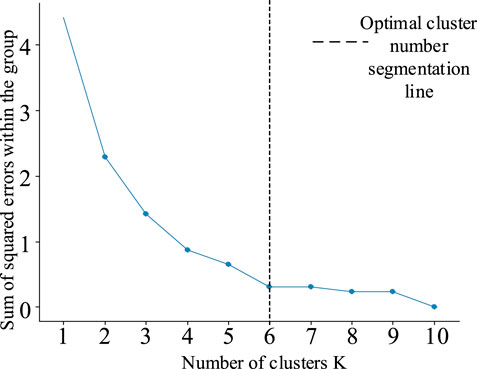
The k-means method is used to cluster the attenuation coefficients and fluctuations of multiple photovoltaic power stations, and the optimal cluster number of the power station group is determined by the sum of squared errors (SSE) within the group. Taking province A as an example, cluster analysis of large-scale power stations in the province was carried out on the first to seventh of June when the weather fluctuates frequently. Taking June 1 as an example, the result of the optimal number of clusters in a power plant group through SSE is shown in Figure 4. It can be seen that the blue curve has an obvious inflection point when the number of clusters is set to 6. After that, as the number of clusters increases, the trend of the curve is relatively flat, which proves that the optimal number of clusters in the power plant group is 6. Table 1 shows the optimal clustering number of photovoltaic power plants in the province from June 1 to 7.
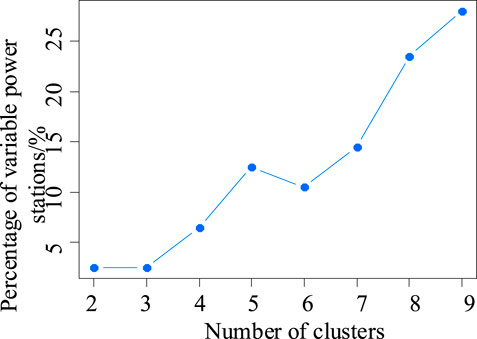
This paper selects power stations that always belong to the same cluster set as typical power stations under different weather conditions, and defines power stations that do not belong to the same set as variable power stations. In order to improve the forecast accuracy of PV output in the province, the percentage of variable power plants should be lower. Through the statistics of clustering number and variable power plant ratio data, the variable power plant ratio curve under different clusters number can be plotted as shown in Figure 5. By observing the curve for the clustering number from 5 to 7, it is obvious that the minimum value of the variable power plant ratio is obtained when the clustering number is 6. Therefore, considering different weather conditions, the optimal classification number of power stations in the province is 6. Table 2 shows the number of power stations corresponding to the six types of cluster power stations in Province A.
The cross-validation method was applied to the history data of six kinds of photovoltaic power plant groups, and the history data was trained and tested according to the ratio of 9:1 (4637:515) of the training set to the test set. Set the time step of the model input layer to 10 and the number of hidden layers to 2, The dimension of the first layer of the hidden layer is 15, and the dimension of the second layer of the hidden layer is 30. The model simulation results in the forecast curve of the province on August 1 as shown in Figure 6. Based on this model, carry out 1–4 steps, which is 15 min-1 h ultra-short-term rolling forecast. It can be seen that the large-scale photovoltaic forecasting method considering the correlation has higher accuracy.
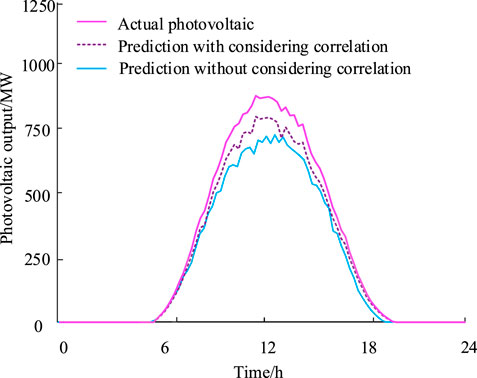
FIGURE 6. Prediction curve of day-ahead and intra-day photovoltaic output and actual measurement curve of A province.
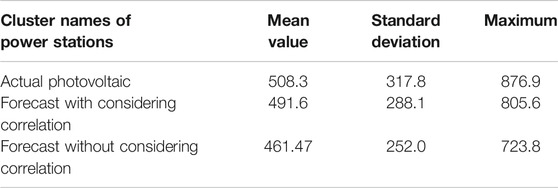
The benefits of considering photovoltaic correlation is further verified. Table 3 lists the comparison of forecast results with and without considering correlation. It can be seen that the mean value, standard deviation and maximum of the prediction are all closer to the actual value of photovoltaic, compared with the forecast results without considering correlation, which further demonstrate that the large-scale photovoltaic forecast method considering the correlation has higher accuracy.
Optimal Power Flow Calculation
In order to analyze the impact of large-scale photovoltaic on the system, simulation verification was carried out in the modified IEEE 39-bus system and IEEE 118-bus system. The optimal power flow mode is implemented on a personal computer with Intel Core i7 CPU(2.20 GHz) and 16.00 GB RAM.
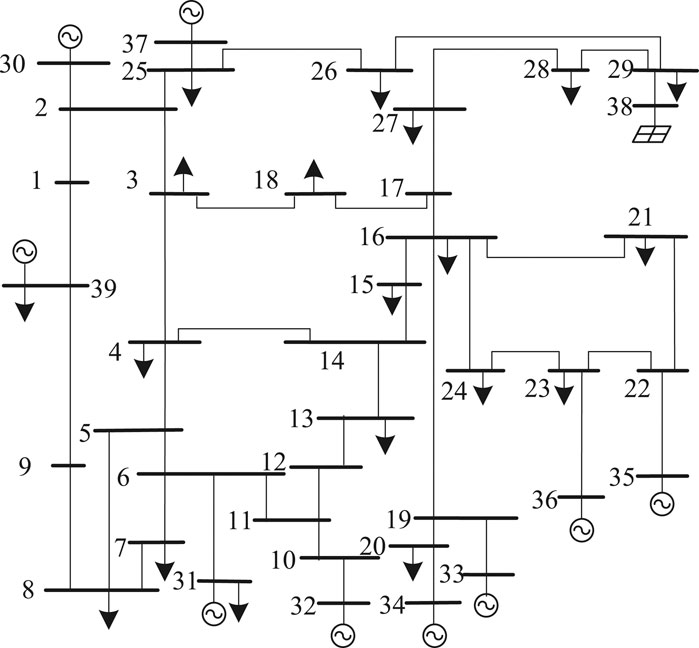
The power grid connection of modified IEEE 39-bus system is shown in Figure 7. The province’s intraday photovoltaic output forecasts at different times will replace the traditional generator in 38th bus. The simulation parameters are taken from manpower 4.1.
The NSGA-II algorithm is used to perform multi-objective optimal power flow calculations for systems containing large-scale PV output, and an optimal set of Pareto solutions is obtained for each moment. In NSGA-II algorithm process, the maximum iteration number is set as 200, the population size is set to be 100, and the distribution indices for crossover and mutation operators are 20. The computation time of the proposed optimal power flow model is 10 min. Figure 8 shows the Pareto solution set at 12:00, and the optimal solution set is uniformly distributed in the objective function space. It is verified that the NSGA-II algorithm has strong validity and applicability, can coordinate the active power loss and voltage offset of the system, and has a strong global search capability.
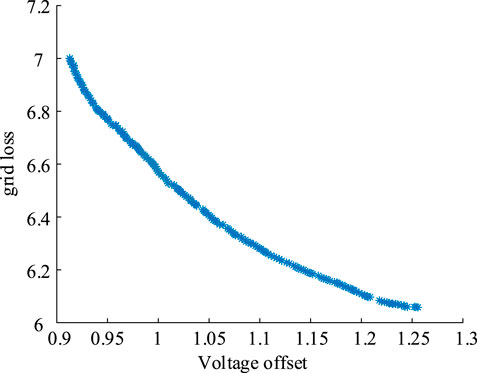
FIGURE 8. Distribution of Pareto solution in objective function space at 12:00 for IEEE 39-bus system.
Table 4 shows the comparison of the optimal power flow calculation results at different times. As the 38th bus is connected to photovoltaic output, the PV output gradually increases. Therefore, the traditional generators are avoided to supply power to the remote load, which reduces the transmission distance and the grid loss in the system. At the same time, the improvement in power supply reduces the variations of the optimization objectives, and the system operating state tends to stabilize. In addition, the grid loss and voltage offset are in a mutually restrictive relationship, and the operator can select the system operating state according to actual needs.
In order to further validate the effectiveness of the proposed method in a large-scale system, case studies are performed on IEEE118 system. The province’s intraday photovoltaic output forecasts at different times will replace the traditional generator in 90th bus. The computation time of the proposed optimal power flow model is 17 min. Figure 9 shows the Pareto solution set at 12:00, and Table 5 shows the comparison of the optimal power flow calculation results of IEEE118 system at different times. These results further demonstrate the NSGA-II algorithm have a better performance in solving multi-objective problems, and the effectiveness of the proposed method is also validated.
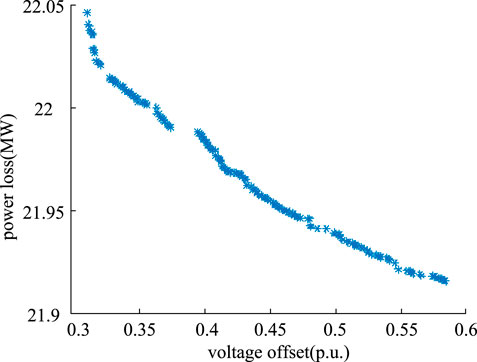
FIGURE 9. Distribution of Pareto solution in objective function space at 12:00 for IEEE 118-bus system.
Conclusion
This paper proposes an optimal power flow calculation method considering the correlation of large-scale photovoltaic output, and the following conclusions are obtained:
(1) The k-means clustering algorithm is used to obtain the spatial correlation between large-scale PV plants. The accuracy of the PV output prediction model is improved by using the LSTM network model for multidimensional PV output prediction.
(2) The impact of regular variations in PV output on the system is obtained through optimal power flow analysis. Traditional generators are required to adjust their output according to the PV conditions to meet the grid-wide load. As the PV output increases, the transmission path and the grid loss decrease, but the voltage offset increases.
(3) The photovoltaic forecast method proposed in this paper is conductive for dispatch center to obtain more realistic photovoltaic output, and then the optimal dispatching is utilized to balance the economy and security of the power system.
Data Availability Statement
The original contributions presented in the study are included in the article, further inquiries can be directed to the corresponding author.
Author Contributions
HL and HJL made important contributions to the concept, idea, topic selection, design and data acquisition, analysis or interpretation of the research work; WL and JB wrote papers or modified their key contents; ZW comprehensively reviewed and checked the final published papers.
Funding
This research was financially supported by the Key technology projects of State Grid Inner Mongolia East Electric Power Co., Ltd. (SGMDTL00YWJS2000669).
Conflict of Interest
Author HL was employed by the Tongliao Power Supply Company. Author HJL was employed by the NARI Technology Development Co., Ltd. The remaining authors declare that the research was conducted in the absence of any commercial or financial relationships that could be construed as a potential conflict of interest.
References
Bessa, R. J., Trindade, A., and Miranda, V. (2015). Spatial-temporal solar power forecasting for smart grids. IEEE Trans. Ind. Inf. 11 (1), 232–241. doi:10.1109/tii.2014.2365703
Bowen, Y., Jinhua, X., and Ying, F. (2016). Inter-regional power grid planning up to 2030 in China considering renewable energy development and regional pollutant control: a multi-region bottom-up optimization model. Appl. Energy 184, 641–658. doi:10.1016/j.apenergy.2016.11.021
Bunea, G., Wilson, K., Meydbray, Y., Campbell, M., and De Ceuster, D. (2006). “Low light performance of mono-crystalline silicon solar cells,” in Proceedings of the IEEE 4th world conference on photovoltaic energy conference, Waikoloa, HI, May 2006 2, pp. 1312–1314. doi:10.1109/WCPEC.2006.279655
Cao, J., Du, W., Wang, H. F., and Bu, S. Q. (2013). Minimization of transmission loss in meshed AC/DC grids with VSC-mtdc networks. IEEE Trans. Power Syst. 28 (3), 3047–3055. doi:10.1109/tpwrs.2013.2241086
Dall’Anese, E., Dhople, S. V., Johnson, B. B., and Giannakis, G. B. (2014). Decentralized optimal dispatch of photovoltaic inverters in residential distribution systems. IEEE Trans. Energy Convers. 29 (4), 957–967. doi:10.1109/TEC.2014.2357997
Ghislain, A. X., Robin, G., and Georges, K. (2019). Probabilistic model for spatio-temporal photovoltaic power forecasting. IEEE Trans. Sustain. Energy 10 (2), 708–789. doi:10.1109/TSTE.2018.2847558
Hashemi, S., and Østergaard, J. (2017). Methods and strategies for overvoltage prevention in low voltage distribution systems with PV. IET Renew. Power Gener. 11 (2), 205–214. doi:10.1049/iet-rpg.2016.0277
Huang, L., Shu, J., Jiang, G., and Zhang, J. (2014). Photovoltaic generation forecast based on multidimensional time-series and local support vector regression in microgrids. Autom. Electr. Power Syst. 38 (5), 19–24. doi:10.7500/AEPS20130710005
Li, G., Li, G., and Zhou, M. (2019). Model and application of renewable energy accommodation capacity calculation considering utilization level of interprovincial tie-line. Prot. Control Mod. Power Syst. 4 (1), 1–12. doi:10.1186/s41601-019-0115-7
Lin, G., Qi, Z., and Baorong, Z. (2018). Modeling and prediction of photovoltaic power characteristics based on multi-scale clustering analysis. Autom. Electr. Power Syst. 42 (1), 24–30. doi:10.7500/AEPS20171027003
Lingfeng, X., Jiaming, L., and Liang, Z. (2017). Generation method of photovoltaic output sequence considering the spatio-temporal correlation of photovoltaic power plants. Proceedings of the CSEE 37 (07), 1982–1993. doi:10.13334/j.0258-8013.pcsee.160433
Liu, Z., Zhinong, W., and Gao, S. (2019). Adaptive linearized probabilistic power flow calculation with high proportion of wind power grid connected in the source load interactive environment. Grid Tech. 43 (11), 3926–3937. doi:10.13335/j.1000-3673.pst.2018.2352
Lorenz, E., Hurka, J., Heinemann, D., and Beyer, H. G. (2009). Irradiance forecasting for the power prediction of grid-connected photovoltaic systems. IEEE J. Sel. Topics Appl. Earth Observation Remote Sens. 2 (1), 2–10. doi:10.1109/jstars.2009.2020300
Mohammadi, P., and Mehraeen, S. (2017). Challenges of PV integration in low-voltage secondary networks. IEEE Trans. Power Deliv. 32 (1), 525–535. doi:10.1109/tpwrd.2016.2556692
Nazari-Heris, M., Madadi, S., Abapour, S., and Mohammadi-ivatloo, B. (2018). “Optimal stochastic scheduling of virtual power plant considering NaS battery storage and combined heat and power units,” in Proceedings of the fourth international energy management and technology conference, Tehran, Iran, January, 2018.
Nazari-Heris, M., Abapour, S., and Mohammadi-Ivatloo, B. (2019). “Robust optimization method for obtaining optimal scheduling of active distribution systems considering uncertain power market price,” in Robust optimal planning and operation of electrical energy systems. Editors B. Mohammadi-ivatloo and M. Nazari-Heris (Cham, Switzerland: Springer). doi:10.1007/978-3-030-04296-7_16
Nazari-Heris, M., Mohammadi-Ivatloo, B., Zare, K., and Siano, P. (2020). Optimal generation scheduling of large-scale multi-zone combined heat and power systems. Energy 210, 118497. doi:10.1016/j.energy.2020.118497
Samadi, A., Eriksson, R., Soder, L., Rawn, B. G., and Boemer, J. C. (2014). Coordinated active power-dependent voltage regulation in distribution grids with PV systems. IEEE Trans. Power Deliv. 29 (3), 1454–1464. doi:10.1109/tpwrd.2014.2298614
Siano, J., Ray, W., and Litz, M. S. (2017). Low light illumination study on commercially available homojunction photovoltaic cells. Appl. Energy 191, 10–21. doi:10.1016/j.apenergy.2017.01.029
Sun, J., Li, M., Zhang, Z., Xu, S., He, J., Wang, H., et al. (2017). Renewable energy transmission by HVDC across the continent:system challenges and opportunities. CSEE J. of Power and Energy Systems 3 (4), 353–364. doi:10.17775/CSEEJPES.2017.01200
Wang, Z., Kang, J., Cheng, L., Pei, Z., Dong, C., and Liang, Z. (2019). Mixed Gaussian models for modeling fluctuation process characteristics of photovoltaic outputs. Front. Energy Res. 9, 80. doi:10.3390/en9020080
Xia, S., Luo, K. W. X., and LiZhou, G. (2016). Probabilistic transient stability constrained optimal power flow for power systems with multiple correlated uncertain wind generations. IEEE Transactions on 7 (3), 1133–1144. doi:10.1109/tste.2016.2520481
Yang, J., Liu, Z., and Meng, B. (2011). Resources calculation of solar radiation based on matlab. Energy Eng. J. Assoc. Energy Eng. 1, 35–38. doi:10.16189/j.cnki.nygc.2011.01.010
Yang, S., Zeng, D., Ding, H., Yao, J., Wang, K., and Li, Y. (2016). Multi-objective demand response model considering the probabilistic characteristic of price elastic load. Energies 9 (2), 80–93. doi:10.3390/en9020080
Ye, L., Zhang, Y., Zhang, C., Lu, P., Zhao, Y., and He, B. (2019). Combined Gaussian Mixture Model and cumulant for probabilistic power flow calculation of integrated wind power network. Comput. Electr. Eng. 74, 117–129. doi:10.1016/j.compeleceng.2019.01.010
Zhang, X., Kang, C., Zhang, N., Huang, Y. H., Liu, C., and Xu, J. F. (2014). Analysis of mid/long term random characteristics of photovoltaic power generation. Autom. Electr. Power Syst. 38 (6), 6–13. doi:10.7500/AEPS20131009012
Keywords: large-scale photovoltaic, correlation, neural network, prediction, optimal power flow
Citation: Li H, Li H, Lu W, Wang Z and Bian J (2020) Optimal Power Flow Calculation Considering Large-Scale Photovoltaic Generation Correlation. Front. Energy Res. 8:590418. doi: 10.3389/fenrg.2020.590418
Received: 01 August 2020; Accepted: 06 November 2020;
Published: 26 November 2020.
Edited by:
Behnam Mohammadi-ivatloo, University of Tabriz, IranReviewed by:
Morteza Nazari-Heris, Pennsylvania State University (PSU), United StatesElnaz Davoodi, University of Tabriz, Iran
Copyright ©2020 Li, Li, Lu, Wang and Bian. This is an open-access article distributed under the terms of the Creative Commons Attribution License (CC BY). The use, distribution or reproduction in other forums is permitted, provided the original author(s) and the copyright owner(s) are credited and that the original publication in this journal is cited, in accordance with accepted academic practice. No use, distribution or reproduction is permitted which does not comply with these terms.
*Correspondence: Jing Bian, YmpfampqQG5lZXB1LmVkdS5jbg==
 He Li1
 Jing Bian