 Laura Parra
 Sara Gómez
 Carolina Montoya
 Felipe Henao
94% of researchers rate our articles as excellent or good
Learn more about the work of our research integrity team to safeguard the quality of each article we publish.
Find out more
BRIEF RESEARCH REPORT article
Front. Energy Res., 09 November 2020
Sec. Sustainable Energy Systems
Volume 8 - 2020 | https://doi.org/10.3389/fenrg.2020.575240
Comprehending the complementarities between a country’s renewable power plants can help strategically plan for the future of its power system. Furthermore, complementarity can reduce the system’s vulnerabilities and its dependency on a single energy source. The Colombian power system significantly depends on hydroelectricity, which meets approximately 65% of the country’s electricity demand, making it vulnerable to droughts, particularly those caused by the El Niño–Southern Oscillation. Using either gas or coal power plants during a drought to back up the power system is expensive and polluting. This paper assesses the complementarities of Colombia’s hydro, wind, and solar power plants, with the purpose of identifying the weaknesses and strengths of the system and suggest a way for redressal. Complementarity is assessed via Pearson’s correlation analysis and Beluco et al. (2019) complementarity dimensionless indexes. The results suggest that the Colombian power system lacks complementarity, but it can be enhanced by investing in solar and wind power plants.
Colombia is renowned for its abundant water resources; consequently, its power system was built heavily dependent on water. Approximately 65% of the country’s electricity consumption is derived from hydroelectricity, with the remaining 35% being sourced from fossil fuel-based power plants (primarily gas and coal). Hydropower accounts for 68% of the installed power capacity, distributed through 29 large-scale hydropower plants, which are centrally dispatched, and 115 non-centrally dispatched run-of-the-river hydroelectric plants (XM, 2019a).
Colombia’s high dependence on water for its power system makes it vulnerable to droughts, especially those caused by the El Niño–Southern Oscillation (ENSO). ENSO is one of the significant catalysts influencing Colombia’s hydroclimate, thus having a substantial impact on its power sector (Poveda et al., 2011). El Niño, ENSO’s warm phase, is a natural phenomenon comprising abnormal warming of the sea surface over the eastern and central tropical Pacific, occurring every three to eight years and lasting for approximately 8–10 months (Poveda et al., 2006; Poveda et al., 2011). On average, El Niño reduces precipitation and runoff in Colombia, thus increasing electricity costs and power supply losses (Franco and Dyner, 2018).
In addition, Colombia also has abundant renewable resources, such as solar radiation and winds, particularly in the north, which can be used for electricity production (Henao et al., 2019; Henao and Dyner, 2020), although these have not yet been used to their optimal level. There is a 9.8 MW solar plant in western Colombia, an 18.4 MW wind farm in the north, and two new solar parks with 18 MW capacity. However, these alternative renewable power plants barely encompass 2% of the national demand.
Scholars have urged Colombia to complement its power system with alternative clean energy resources to minimize its vulnerability during dry periods and to decrease its fossil fuel usage (Zapata et al., 2018; Henao et al., 2019; Henao and Dyner, 2020). The complementarity between renewable energy sources has received increased attention since it can aid in the strategic planning for the future expansion of the power systems (Jurasz et al., 2020). However, it has not yet been studied in detail regarding Colombia, with few exceptions (Henao et al., 2020).
This paper assesses the complementarity between Colombia’s existing hydro, wind, and solar power plants. The purpose is to identify which plants are essential, complementary-wise, and identify any requirements to enhance complementarity. We contrast Pearson’s correlation coefficients and the complementary indexes of Beluco et al. (2019). Complementarity is evaluated by comparing pairs of renewable power plants, which include the 35 main tributaries that reach Colombia’s hydropower plants, the Jepirachi wind farm, and Celsia’s Yumbo solar plant.
The remainder of this paper is organized in the following manner: Literature Review briefly reviews the complementarity literature. Material and Methods presents the data and methodology. Results and Discussion demonstrates the results for Colombia and discusses their implications. Finally, Conclusion concludes and offers final remarks.
Complementarity between two renewable energy resources can be understood as the ability of one of the resources to compensate for the other’s deficits, i.e., when the average energy availability of one resource is low, the energy availability of the other resource must be high (Beluco et al., 2008). In this regard, complementarity can occur between two (or more) energy resources of the same or different types, located at the same or different geographic places. The variations in energy availabilities can be due to seasons, differences in orography or location, or the physics-dynamics that make the weather variables to behave oppositely (Risso et al., 2018). Power networks can exploit complementarity by interconnecting energy resources located in different geographic regions that can complement each other. Thus, the literature recognizes the following types of complementarity:
• Temporal: It occurs between two energy resources located in the same geographic region during a specific season or period of the year (Beluco et al., 2008; Risso et al., 2018).
• Spatial: It occurs between energy resources located in different places over a vast region (Risso et al., 2018).
• Spatio-temporal: It takes place between energy sources of the same type over a vast region and during a specific period, or time of the year (Jurasz et al., 2020).
Correlation coefficients, such as Pearson’s, Kendall’s, and Spearman’s, are the most commonly employed tools to assess complementarity (e.g., Cantão et al., 2017; Zhang et al., 2018). For example, Ren et al. (2019) evaluated the complementarity of Chinese power plants combining wind and solar in the same place using Kendall’s correlation coefficient. Han et al. (2019) developed and applied an index to assess complementarity in terms of the fluctuations and ramps of the energy resources. Li et al. (2019) used stochastic optimization to improve the operational performance of a hybrid power plant, using complementarity in their favor. Furthermore, Wang et al. (2018) evaluated a hydro-thermal-wind-photovoltaic plant, demonstrating that the generation of wind and solar generation can be increased together by taking advantage of complementarity.
Other metrics and approaches have also been proposed (see Prasad et al., 2017; Han et al., 2019; Canales et al., 2020a; Jurasz. et al., 2020). For example, absolute median deviation (Mohammadi and Goudarzi, 2018), portfolio models (Odeh and Watts, 2019), graphical representations and percentile ranking (Hoicka and Rowlands, 2011), critical time window (Berger et al., 2020), among others. Beluco et al. (2008) proposed the concept of energetic complementarity to assess the extent to which two energy resources can compensate for each other’s energy availabilities. It combines three different characteristics: temporal-asynchronism, differences in average outputs, and differences in the range of variations. The concept encompasses not only the behavior of the variables over time and space but also the similarities of their average magnitudes and amplitudes of variations. For these reasons, Beluco’s et al. (2008) approach was decided to be employed in this research.
Complementarity has been studied in numerous countries, including Brazil (Rodrigues et al., 2016; Silva et al., 2016), China (Zhang et al., 2018; Han et al., 2019), Poland (Jurasz et al., 2018a; Jurasz and Ciapała, 2017), Australia (Prasad et al., 2017), United States (Solomon et al., 2016), and the Iberian Peninsula (Santos-Alamillos et al., 2015). It has also been studied across countries. Miglietta et al. (2017), for example, evaluated complementarity between solar and wind energy using the Pearson correlation coefficient for the entire European continent. Chattopadhyay et al. (2017) evaluated the storage and backup requirements to supply a reliable energy service across Europe using renewables. Finally, François et al. (2016) demonstrated that integrating run-of-the-river, solar, and wind can increase the penetration rate of renewables regionally in Europe.
Most studies that explore complementarity to find ways to integrate different renewable resources to improve reliability on national power systems use simulation and optimization approaches. They are used to suggest ways to combine renewable resources (Moura and de Almeida 2010; Bezerra Leite Neto, et al., 2020), interconnect neighboring countries (Viviescas et al., 2019), or flatten the output of the renewable resources (Jaramillo et al., 2004). For example, in Poland, Jurasz and Ciapała (2017) developed an optimization model to reduce the variability of solar photovoltaics by combining it with a runoff power plant. And, Jurasz et al. (2018a) and Jurasz et al. (2018b) used simulation, optimization, and artificial neural networks to model the operation of a large-scale hybrid power plant.
The majority of the studies concerning complementarity in Latin America have focused upon Brazil. Risso et al. (2018), for example, used hexagonal-network-cells to quantify spatial complementarity and to map it. De Oliveira Costa Souza Rosa et al. (2017) used Pearson’s correlation coefficients and a linear programming model to optimize the combination of three renewable energies. Borba and Brito (2017) developed a method to calculate the complementarity between at least two energy resources using hourly and daily time series. Cantão et al. (2017) developed hydro-wind correlation maps to record detailed complementarity analysis between two energy resources.
In Colombia, Henao et al. (2020) explored the complementarities between the hydro, solar and wind energy sources at the annual and interannual scales, using reanalysis information and Pearson’s correlation coeficients. Paredes and Ramírez (2017) analyzed the wind/solar complementarity in different parts of the country, wherein water resources were feeding the power system. Pearson’s correlation coefficient was used to estimate complementarity. Canales et al. (2020a) developed a temporal complementarity index that combines Pearson’s correlation coefficient and compromise programming, and applied it in a follow-up paper across Colombia’s territory using wind speed, solar radiation and surface runoff data from 2015 (see Canales et al., 2020b). The studies mentioned above have found evidence of high complementarity potential between solar radiation and runoff, and wind speed and runoff. Those studies, however, did not evaluate the complementarity between the actual renewable power plants that comprise the power system over an extended period. They estimated complementarity using climatic data in regions where actual plants do not exist.
This study assesses the complementarity between the renewable power plants in Colombia using 20 years of monthly data. We apply both Pearson’s correlation coefficient and the dimensionless indexes of Beluco et al. (2019); Beluco et al. (2008). We assess the extent to which two power plants complement each other in terms of their energy output contributions. Our analysis facilitates the identification of crucial renewable assets, complementarity-wise (i.e., power plants that complement the most in relation to the rest of the other plants), and ascertains how to enhance complementarity to reduce the power system’s future vulnerabilities.
The time-series data used for this research consists of 20 years of monthly observations (2000–2019) of water availabilities, expressed in energy terms, of the 35 main tributaries that feed the Colombian hydroelectric power plants. Additionally, the energy availabilities of the Jepirachi wind farm, located in the north, and Celsia’s Yumbo solar plant, located in the west, were also employed. These data can be retrieved from XM’s Portal-Bi database (XM, 2020a). XM is the electricity market operator who offers historical data related to the operation of the national power system free of charge. The water availabilities appear under the Spanish name of “Aportes mensuales” (XM, 2020b), while the energy availabilities of Jepirachi (wind) and Yumbo (solar) can be found under the Spanish name “Generación por recurso” (XM, 2020c).
The names of the 35 tributaries used of the Colombian hydroelectric power system are the following: San Lorenzo, Alto anchicaya, Amoya, Bata, Betania, Bogotá NR, Calima, Carlos Lleras, Cauca Salvajina, Chuza, Concepción, Cucuana, Desv. EEPPM (Nec, Paj, Dol), Dev. Guarino, Dev. Meek, dev. San Marcos, Digua, El Quimbo, Florida II, Grande, Guadalupe, Guatape, Guavio, Magdalena Betania, Miel I, Nare, Other Rivers (Estimated), Porce II, Porce III, Porce2 Cp, Prado, San Carlos, Sinu Urra, Sogamoso and Tenche. Figure 1 illustrates the location of the tributaries.
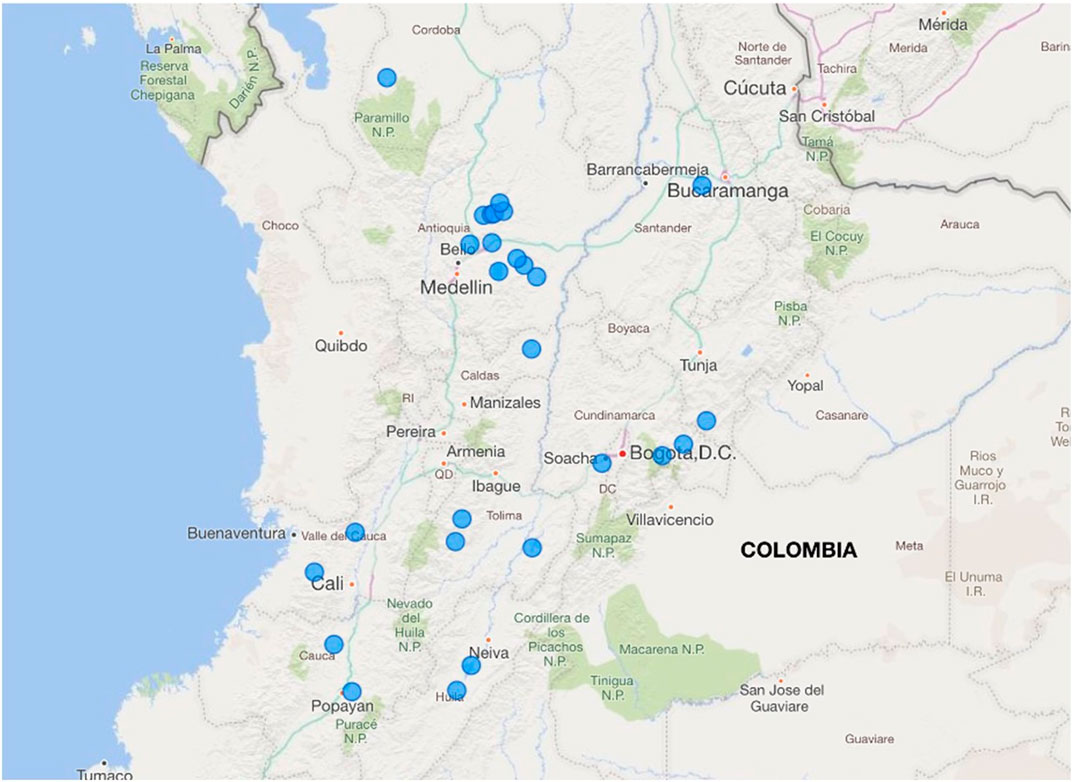
FIGURE 1. Location of the 35 main tributaries that feed the Colombian hydroelectric power system.
Figure 2 depicts the monthly total energy availabilities of the national power system with standard deviation (A), and the average contribution of each power plant (B). The former shows the bimodal cycle of Colombia’s rainy/dry weather (Poveda et al., 2011). The energy availability peaks during May–June, and again in October–November, while the least contributions from power plants occur during January–March. Figure 2B highlights the power plants contributing the most to the national power system: Nare, El Quimbo, Sogamoso, Grande y Porce II.
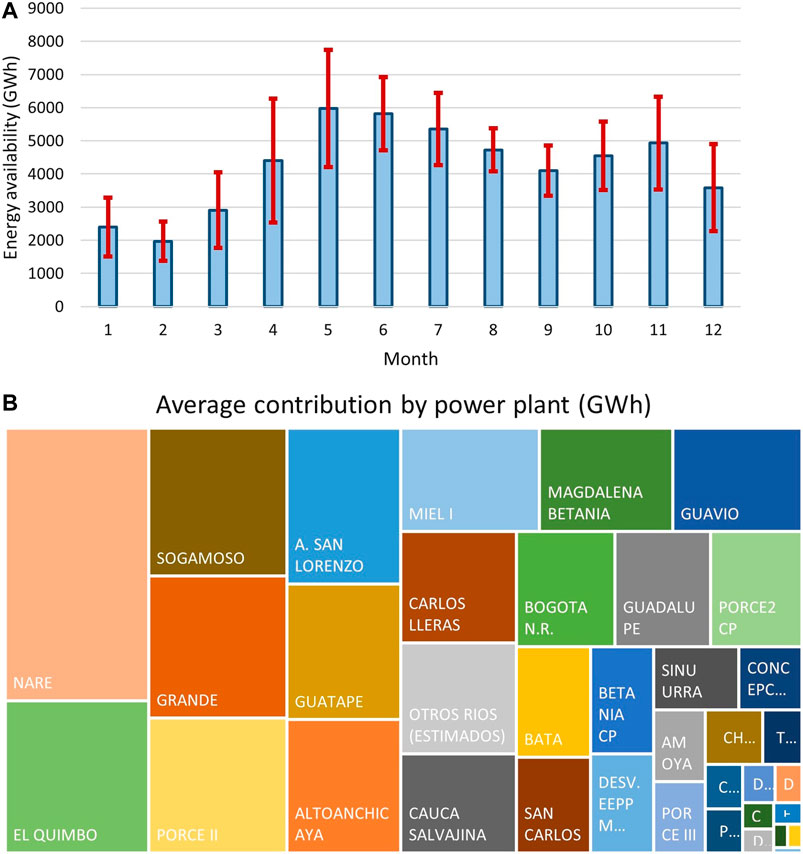
FIGURE 2. (A) monthly total energy availabilities with standard deviation, and (B) energy contribution by power plant.
The complementarity between two energy resources or, in this case, two power plants is calculated in the following manner.
First, Pearson’s correlation coefficient is calculated over the monthly averages emerging from the observations of the two energy variables. The correlation coefficient ranges from −1 to +1, where negative values are interpreted as complementary. Synchronism is assumed when correlation results are positive. Finally, values close to 0 indicate that the two plants are neither complementary nor synchronic.
Second, the energetic complementarity indexes (Beluco et al., 2019) are calculated based on the monthly averages of the data described in Data. Beluco et al. (2019) proposed three complementarity indexes: temporal (Kt), energy (Ke), and amplitude (Ka).
The temporal complementarity index Kt is calculated according to Eq. 1. Where m1 and m2 represent the months where the minimum energy availabilities of the first and second energy resources occur, these values range between 1 and 12. Thus, Kt shows how distant in time, the two minimum values occur. Kt equals one when the two minimums are six months apart, and it equals zero when the two minimums occur in the same month. In terms of complementarity, two minimum values occurring in different months, ideally six months apart, are desired.
The energy complementarity index Ke is estimated according to Eq. 2, where e1 and e2 are the average energy availabilities for the first and second energy resources. Ke equals one when the average values are the same, and it is close to zero when one value is much larger than the other. For complementarity, equal average amounts are desired.
The amplitude complementarity index Ka is calculated according to Eq. 3. Where δ represents the difference between the maximum and minimum energy availabilities to the average value e. In both cases, if the minimum and maximum values are the same, δ equals one, and if this occurs with both energy resources, Ka also equals one. For complementarity, the variation in both resources should be similar.
A complementary index K is calculated by multiplying the time, energy, and amplitude complementarity indexes: K = Kt * Ke * Ka. Here, values close to one indicate that the two power plants complement each other in time, output, and intermittence; whereas, values close to zero indicate that at least in one of these three characteristics, one power plants fail to match the other.
Figure 3 displays the correlation coefficients calculated by comparing pairs of power. The plants appearing along the x and y axes and are listed in alphabetical order. The correlation values are represented on a color scale, where negative values are red (complementarity); positive values are blue; and values close to 0 are white. As observed, blue predominates, meaning that the energy availabilities of most power plants are synchronized or fluctuate similarly. The plants Grande, Bogotá NR, and Nare show a significant coupling with the others, that is, with little complementarity. Note that the solar and wind power plants, appearing at the bottom and on the right-hand side, show a high degree of complementarity with the rest of the power plants (see the red colors along the bottom and right edges in Figure 3).

FIGURE 3. Complementarity between power plant pairs via Pearson’s correlation analysis.
Figure 4 displays the three complementarity indexes, Kt, Ke, and Ka. The renewable power plants are lined along the x and y axes in the same alphabetical order presented in Figure 3, and the diagonal corresponds to the comparison of a power plant with itself. K-values range from 0 to 1, where 0 indicates no complementarity between plants, and one indicates strong complementarity. Here, the K-values close to 0 appear in white and light blue, whereas K-values close to one are in dark blue.
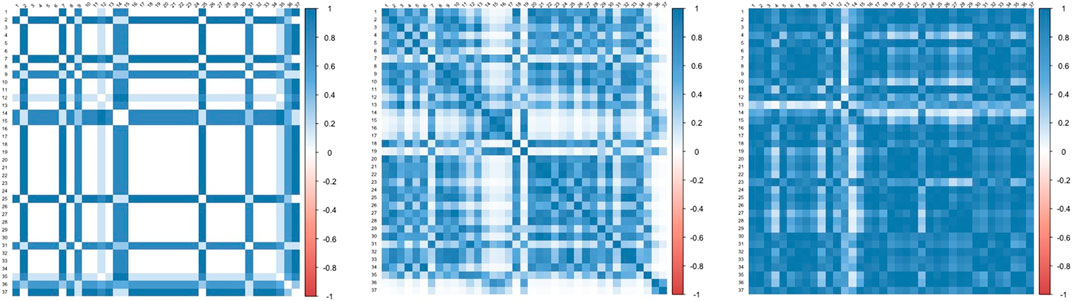
FIGURE 4. The complementarity indexes, Kt(left), Ke(middle), and Ka(right) to Colombia’s renewable power plants.
Figure 4 (left) depicts the results of Kt. As can be observed, white and light blue predominate, suggesting that most of the power plants are synchronic or have little complementarity with the rest of the power plants in terms of time. Only a few blue stripes are shown, indicating that they behave oppositely, including Miel I (a hydro located in the central-west), Calima (a hydro situated in the west), Alto Anchicaya (a hydro situated in the west), Yumbo Solar (a solar farm located in the west), and Jepirachi (a wind farm located in the north). The minimum energy availability of these plants occurs within six months difference from the rest of the plants.
The Ke matrix (Figure 4, middle) shows mixed results, i.e., blue and white. Blue indicates a significant group of plants, particularly hydroelectric plants, sharing similar average energy availabilities. These plants can eventually compensate for the deficits of their counterparts during a drought. The white and light stripes, in the center and on the right-hand side, represent power plants that are significantly bigger (or smaller) than the rest, making it difficult for them to be covered in case of deficits (or to cover plants with deficiencies). Among the smallest plants are Yumbo Solar, Jepirachi, Desv. San Marcos, Florida II, and Desv. Guarino. These plants show low complementarity because their sizes are minimal vis-à-vis the others.
Figure 4 (right), which represents the Ka index, depicts mostly blue, suggesting that most energy resources fluctuate with the same intensity, i.e., their energy availabilities deviate similarly from their average value.
For the K complementary index, values close to one represent full complementarity between power plants, i.e., their minimum values are 6 months apart, they have similar average energy availabilities, and their energy resources fluctuate with the same intensity. Values close to zero mean that the two power plants do not match in at least one of these three factors.
Figure 5 presents a box plot with the final K complementary index of all power plants. The figure shows that the final K index of most power plants is close to zero, indicating no complementarity with the rest. This suggests that the power plants are either synchronic, or if asynchronous, they cannot compensate for the deficits of the others due to their small size. These results demonstrate that the Colombian power system was built without considering the volatility and complementarity of the overall portfolio of energy resources comprising the system.
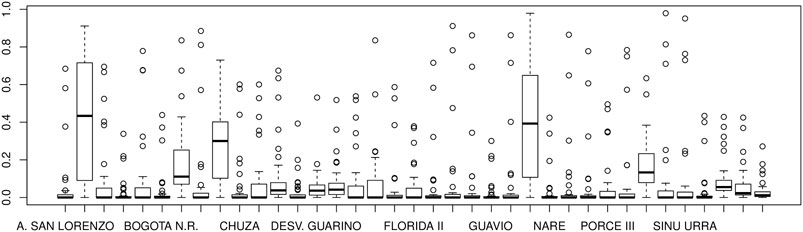
FIGURE 5. Box plot of the complementarity index K = Kt * Ke * Ka.
Only two hydropower plants (number 2 Alto Anchicaya, and number 25 Miel I) have decent middle-range complementarity values. In terms of planning, it is ideal to have several power plants (boxes) close to 1, with little dispersion or variability, in order to reduce the system’s vulnerability via complementarity.
Figure 6 summarizes the results of Pearson’s correlation analysis and the final K index to all pairs of renewable power plants, showing mixed results. The cases appearing in sector (indicated by the red dot) one are those where both methods suggest complementarity. The cases in sector two are those where both methods indicate no complementarity. Moreover, in sectors 3 and 4, the methods contradict each other: one suggesting complementarity and the other not suggesting any complementarity. Next Figure 7 illustrates such cases with specific examples and deconstructs them in detail.
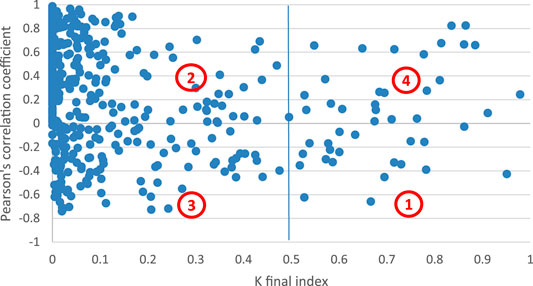
FIGURE 6. The complementarity K index (Beluco et al., 2019) and Pearson’s correlation analysis.
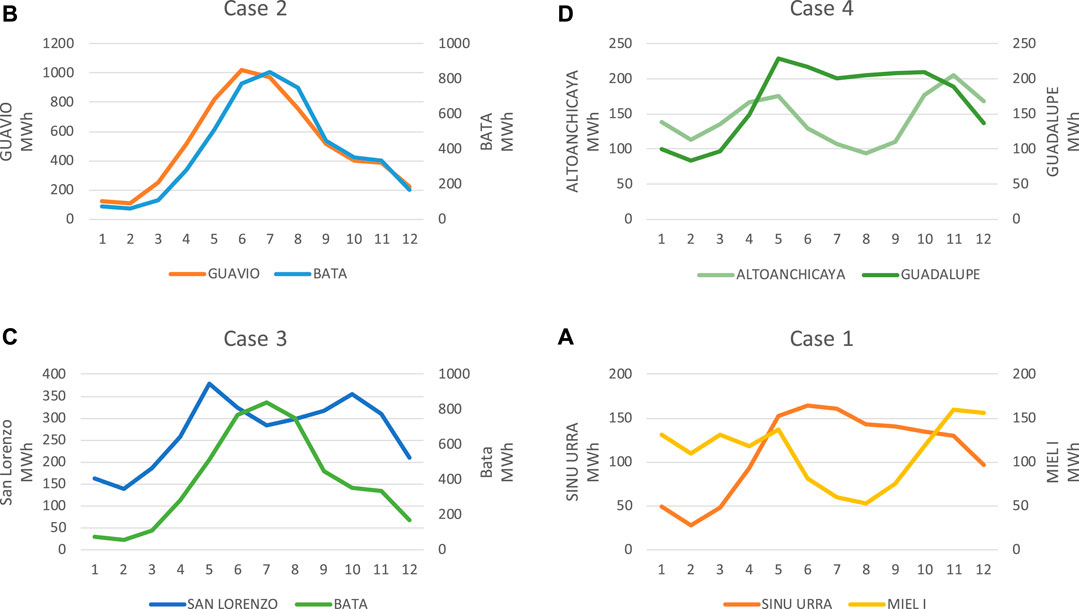
FIGURE 7. Illustrative examples of different degrees of complementarity between pairs of power plants.
Figure 7A illustrates a case in sector one (case 1) by comparing the monthly average energy availabilities of the Sinú Urra and the Miel I power plants. As can be observed, both plants indicate complementarity, particularly from May to October. In this case, Pearson’s correlation coefficient was negative, with a value equal to −0.43, suggesting complementarity. Similarly, the K index, equal to 0.95, suggests complementarity (Kt, equal to one; Ke equal to 0.99; and Ka equal to 0.96) indicate that both plants are entirely complementary in terms of time, average energy availability, and amplitude of variation.
Figure 7B illustrates case 2, showing the Guavio (hydro) and Bata (hydro) plants. Here, both plants behave similarly over time, indicating that they are coupled or synchronous. Pearson’s correlation coefficient was positive and high (0.956), suggesting synchronism between both plants, while the K index was zero (0.0038), indicating no complementarity. Here, complementarity is not achieved because Kt was equal to 0 and because the minimum energy availabilities in both plants occurred in February.
Figure 7C, case 3, is illustrated with San Lorenzo and Bata. Ostensibly, the two plants appear complementary, particularly from May to October, i.e., Pearson’s correlation coefficient was −0.69. However, the Kt index was 0, indicating low complementarity in terms of time, because their minimum values occurred both in February. The, complementarity appears to occur just during the middle of the year and the rest of the time the two plants are synchronized.
Finally, case 4 is illustrated via Alto Anchicaya and Guadalupe (Figure 7D). The K index is 0.92, reflecting an apparent complementarity behavior from May to November. However, Pearson’s correlation indicates otherwise, reporting a value of 0.09. The correlation value approximates zero because both plants synchronize after month 11, i.e., from month 12 to month four of the following year. Therefore, Pearson misses detecting the partial complementarity happening from months 5–11 due to the synchronism occurring from months 12 to four of the next year.
The same degrees of complementarity illustrated in Figure 7 can also be visualized by contrasting the time-series of the power plants’ energy availabilities. Figure 8 compares the time-series of such power plants to illustrate the same four specific case examples discussed above. Case 1 contrasts the time series of Sinu Urra vs. Miel I. This case shows the most evident complementarity of all, depicting two time-series that are asynchronous or in opposite phases (i.e., when one variable increases, the other decreases) (Figure 8A). Case 2 (Figure 8B) is on the opposite side of the spectrum. It shows two power plants (Guavio vs. Bata) that are almost perfectly synchronized (i.e., both variables increase and decrease simultaneously). The other two cases, cases 3 and 4, present partial complementarity characteristics. They have moments where the two variables appear to move in opposite directions (e.g., see case 4 around April–September 2011), and moments where the two variables appear to be synchronized (e.g., see case 4, around October 2003–March 2004). Therefore, rather than being a binary state, complementarity appears to be a continuum where two variables could be either asynchronous or synchronous or have partial complementarity characteristics.
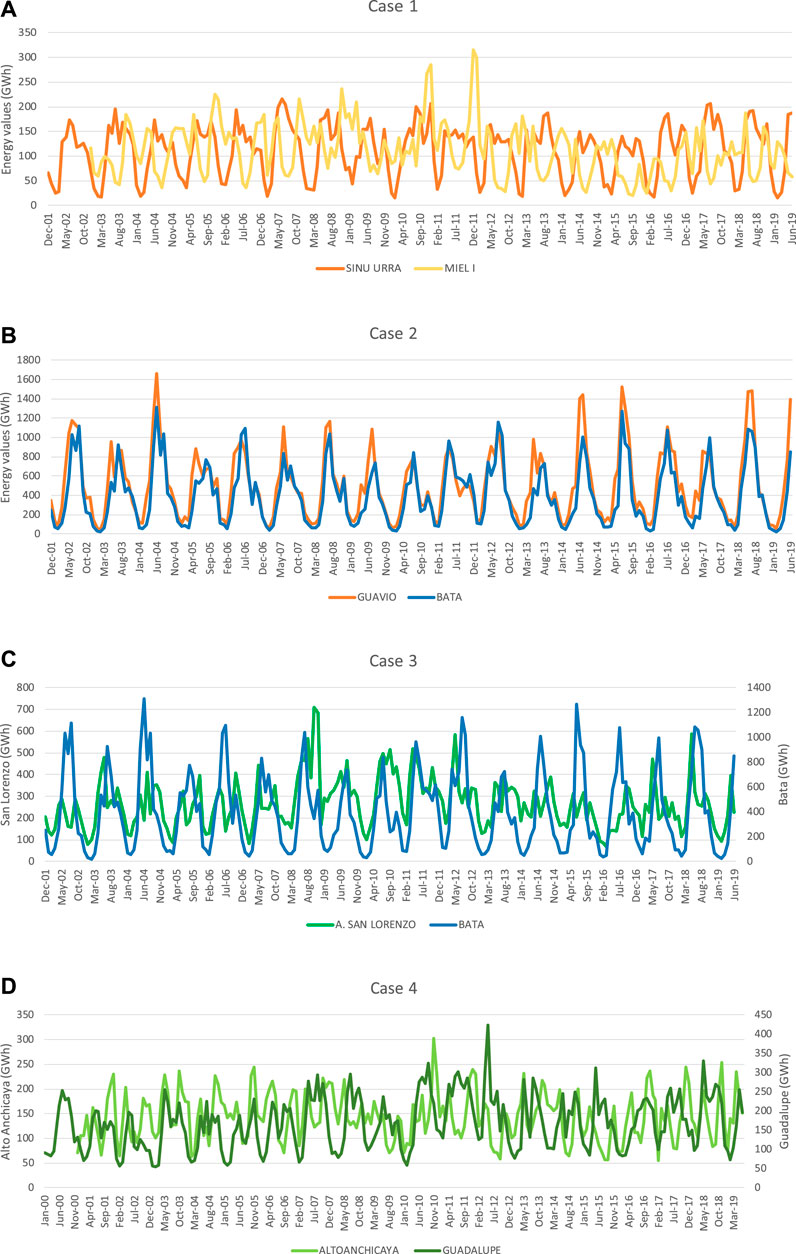
FIGURE 8. Different degrees of complementarity by contrasting the time series of power plants.
As previously mentioned, the El Niño is an interannual climatic phenomenon that reduces runoffs in most of the tributaries that feed the national power system in Colombia (Poveda et al., 2006; Poveda et al., 2011). This occurs regardless of the tributaries’ degree of complementary with others. Figure 9A shows the anomalies caused by the El Niño and La Niña events, from 2000 to 2019, on the time-series of the tributaries in the four cases analyzed above (blue lines). It also depicts the Oceanic Niño Index (ONI) in red, which indicates when an El Niño or La Niña event takes place. When ONI values are above (below) +0.5 (−0.5), over five consecutive overlapping seasons, an El Niño (La Niña) event is taking place (NOAA, 2020). The anomalies to study this phenomenon were calculated following Eq. 4.
Where: xi,m represents the i-th observation of month m, µm is the mean value of month m, σm is the standard deviation of month m, and zi,m represents the standardized anomaly associated with the i-th observation of month m.
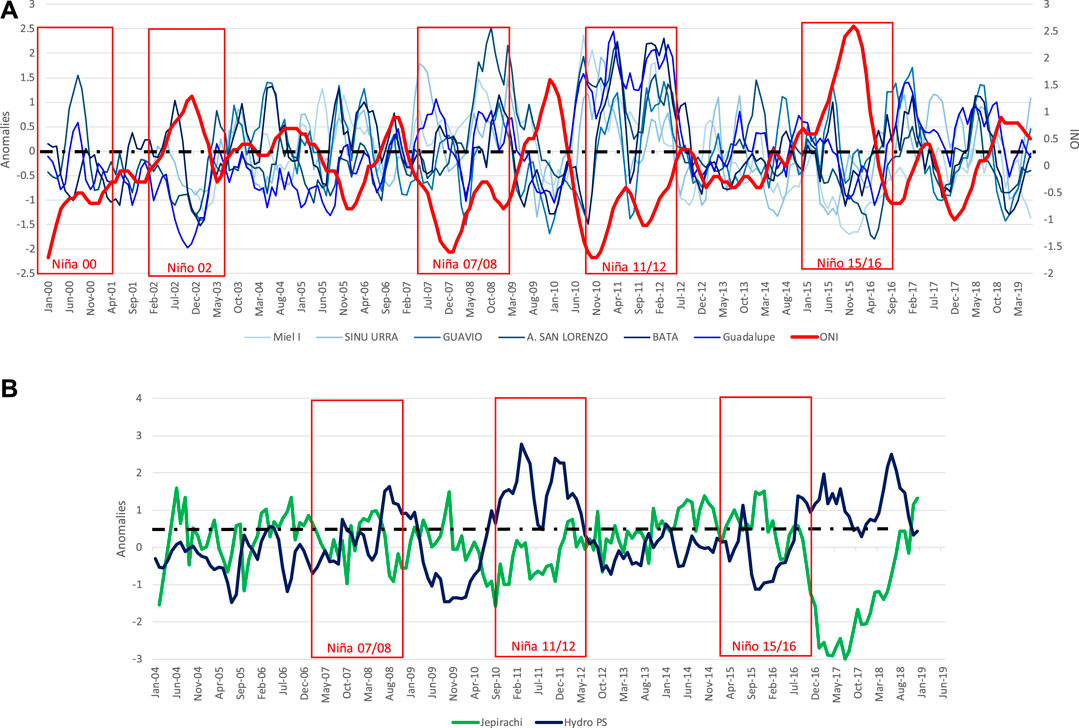
FIGURE 9. (A) Synchronised anomalies of the tributaries that feed a few hydropower plants, in the light of ENSO; (B) Complementarity between the Jepirachi wind farm anomalies and the water inputs anomalies of the national power system in light of ENSO.
Figure 9A shows that the tributaries of the four cases above experienced negative anomalies, below their monthly average levels, during El Niño, and positive anomalies during La Niña. It means that although a pair of tributaries could complement each other on regular times (e.g., see Figure 8A), this feature is likely to be curtailed during ENSO. The same anomalies pattern presented in Figure 9A has been observed in other tributaries and the aggregated water inputs the entire power system. As a result, different scholars have called to complement Colombia’s hydropower sector with alternative energy sources, such as wind and solar, to strengthen the power system to face future ENSO events (Henao et al., 2020). In this regard, Figure 9B compares the Jepirachi wind farm’s anomalies with those of the national power system’s water inputs. As can be seen, the two energy resources behave complementarily during regular times and ENSO events, i.e., when one resource experiences negative anomalies, the other experiences positive anomalies, which is a feature highly desired for the Colombian power sector during El Niño.
In summary, the complementarity between two renewable power plants entails different characteristics beyond the asynchronous temporal behavior of the weather variables that feed those plants. The complementarity methodology of Beluco et al. (2019) considers three aspects of the weather variables: temporal behavior, average output, and amplitude. Pearson’s correlation analysis, which is tantamount to the Kt index, assesses complementarity only in terms of time. It misses the other two characteristics and fails to detect partial temporal complementarities, e.g., case 4 (Figure 7).
Regarding the power plants, the alternative renewables Jepirachi (wind) and Yumbo (solar) have both, for example, shown temporal and amplitude complementarities with most of the hydroelectric plants of the national power system. However, their final K index was low due to significant differences in size (Ke) with the other plants. These results suggest that the alternative renewable sources wind and solar have a high potential to complement Colombia’s hydropower system if used more substantially. Therefore, future capacity generation investments should consider installing new solar and wind power plants in locations nearby Jepirachi and Yumbo, to improve the system’s capabilities to compensate for the deficits of the hydropower plants during El Niño events.
On average, the water inputs that feed the national power system can experience significant reductions, up to 0.8 standard deviations, in power generation capacity, during an El Niño event. This equates approximately 1,000 GWh/month or 20% of the national demand. Hence, based on the average performance of Jepirachi or Yumbo power plants, for example, it can be estimated that roughly an extra 9.5 GW of solar power or 6.4 GW of wind power, or a combination of the two, would be needed to compensate for such El Niño reduction effects in hydropower generation capacity. It is important to note, however, that power capacity expansion modeling requires the development of simulation or optimization models, which goes beyond the scope of this paper, to indicate the exact generation and transmission capacity investments that a system would need into the future (e.g., Henao and Dyner, 2020). These models, which usually consider future electricity demands, fuel prices, technology costs, and other technical elements, rarely include complementarity concepts (e.g., Da Luz and Moura, 2018). In this regard, we argue that energy planning would significantly benefit from complementarity concepts to guide future power capacity expansion choices.
In this paper, the existing complementarity between the renewable power plants (hydro, wind, and solar) in Colombia was assessed. Complementarity was quantified through Pearson’s correlation coefficient and Beluco et al. (2019) complementarity dimensionless indexes. Our study indicates the degree of complementarity within Colombia’s power system. It also highlights the plants that are strategic, complementarity-wise, and others to be installed in the future to enhance complementarity.
The main findings of the study are as follows:
• The Colombian power system evidenced an overall low complementarity behavior between its renewable power plants;
• Most hydro-based power plants present similar temporal and amplitude characteristics, which makes the power system vulnerable to droughts;
• Wind and solar power plants have a high potential to complement Colombia’s hydroelectric system, which suggests that more power capacity is needed to enhance such complementarity;
• Beluco et al. (2019) methodology provides a more holistic view of the complementarity concept than the widely-used Pearson’s correlation coefficient;
• Beluco et al. (2019) method obtain similar results to Pearson’s in terms of the temporal perspective, while offering two additional aspects and detecting partial temporal complementarities.
To conclude, from a practical point of view, this study recommends more ambitious investments in alternative renewables to diversify Colombia’s energy matrix, and consequently reduce its drought vulnerability. Energy planning should start considering complementarity concepts alongside energy cost criteria to guide future power capacity choices. Also, the recent technological advances concerning artificial intelligence and sensor controls, among others, should be used to empower costumers and make the demand more responsive during critical dry seasons. Finally, in terms of methodology, Beluco et al.’s (2019) approach is recommended since it offers a broad perspective toward complementarity. The ideas above provide a vast number of opportunities to undertake future energy-related research, where the complementarity between renewable resources take a more dynamic role in energy planning and decision-making.
Publicly available datasets were analyzed in this study. This data can be found here: http://portalbissrs.xm.com.co/Paginas/Home.aspx.
FH contributed by writing the manuscript and conceptualizing the work; LP contributed by searching at background literature and writing the manuscript. SG contributed by collecting the data and undertaking the empirical estimation. CM contributed by searching at background literature and writing the manuscript.
This work was supported by the University of Icesi (Universidad Icesi) [grant ID: CA0113171].
Frontiers Media SA remains neutral with regard to jurisdictional claims in published maps and institutional affiliations.
The authors declare that the research was conducted in the absence of any commercial or financial relationships that could be construed as a potential conflict of interest.
Beluco, A., de Souza, P. K., and Krenzinger, A. (2008). A dimensionless index evaluating the time complementarity between solar and hydraulic energies. Renew. Energy 33 (10), 2157–2165. doi:10.1016/j.renene.2008.01.019
Beluco, A., Risso, A., and Canales, F. A. (2019). Simplified evaluation of energetic complementarity based on monthly average data. MethodsX 6, 1194–1198. doi:10.1016/j.mex.2019.05.019
Berger, M., Radu, D., Fonteneau, R., Henry, R., Glavic, M., Fettweis, X., et al. (2020). Critical time windows for renewable resource complementarity assessment. Energy 198, 117308. doi:10.1016/j.energy.2020.117308
Bezerra Leite Neto, P., Saavedra, O. R., and Oliveira, D. Q. (2020). The effect of complementarity between solar, wind and tidal energy in isolated hybrid microgrids. Renew. Energy 147, 339–355. doi:10.1016/j.renene.2019.08.134
Borba, E. M., and Brito, R. M. (2017). An index assessing the energetic complementarity in time between more than two energy resources. Energy Power Eng. 09 (09), 505–514. doi:10.4236/epe.2017.99035
Canales, F. A., Jurasz, J., Beluco, A., and Kies, A. (2020a). Assessing temporal complementarity between three variable energy sources through correlation and compromise programming. Energy 192, 116637. doi:10.1016/j.energy.2019.116637
Canales, F. A., Jurasz, J., Kies, A., Beluco, A., Arrieta-Castro, M., and Peralta-Cayón, A. (2020b). Spatial representation of temporal complementarity between three variable energy sources using correlation coefficients and compromise programming. MethodsX 7, 100871. doi:10.1016/j.mex.2020.100871
Cantão, M. P., Bessa, M. R., Bettega, R., Detzel, D. H. M., and Lima, J. M. (2017). Evaluation of hydro-wind complementarity in the Brazilian territory by means of correlation maps. Renew. Energy 101, 1215–1225. doi:10.1016/j.renene.2016.10.012
Chattopadhyay, K., Kies, A., Lorenz, E., von Bremen, L., and Heinemann, D. (2017). The impact of different PV module configurations on storage and additional balancing needs for a fully renewable European power system. Renew. Energy 113, 176–189. doi:10.1016/j.renene.2017.05.069
Da Luz, T., and Moura, P. (2018). Power generation expansion planning with complementarity between renewable sources and regions for 100% renewable energy systems. Int. Trans. Electr. Energ. Syst. 29 (7), e2817. doi:10.1002/2050-7038.2817
De Oliveira Costa Souza Rosa, C., Costa, K. A., da Silva Christo, E., and Bertahone, P. B. (2017). Complementarity of hydro, photovoltaic, and wind power in Rio de Janeiro State. Sustainability 9 (7), 1130. doi:10.3390/su9071130
Franco, C. J., and Dyner, I. (2018). Twilight of a paradigm: towards a new electric model (1st Edn.). Retrieved from: https://books.google.com.co/books?id=CeguyQEACAAJ (in Spanish).
François, B., Hingray, B., Raynaud, D., Borga, M., and Creutin, J. D. (2016). Increasing climate-related-energy penetration by integrating run-of-the river hydropower to wind/solar mix. Renew. Energy 87, 686–696. doi:10.1016/j.renene.2015.10.064
Han, S., Zhang, L.-n., Liu, Y.-q., Zhang, H., Yan, J., Li, L., et al. (2019). Quantitative evaluation method for the complementarity of wind-solar-hydro power and optimization of wind-solar ratio. Appl. Energy 236, 973–984. doi:10.1016/j.apenergy.2018.12.059
Henao, F., and Dyner, I. (2020). Renewables in the optimal expansion of Colombian power considering the Hidroituango crisis. Renew. Energy 158, 612–627. doi:10.1016/j.renene.2020.05.055
Henao, F., Rodriguez, Y., Viteri, J. P., and Dyner, I. (2019). Optimising the insertion of renewables in the Colombian power sector. Renew. Energy 132, 81–92. doi:10.1016/j.renene.2018.07.099
Henao, F., Viteri, J. P., Rodríguez, Y., Gómez, J., and Dyner, I. (2020). Annual and interannual complementarities of renewable energy sources in Colombia. Renew. Sustain. Energy Rev. 134, 110318. doi:10.1016/j.rser.2020.110318
Hoicka, C. E., and Rowlands, I. H. (2011). Solar and wind resource complementarity: advancing options for renewable electricity integration in Ontario, Canada. Renew. Energy 36 (1), 97–107. doi:10.1016/j.renene.2010.06.004
Jaramillo, O. A., Borja, M. A., and Huacuz, J. M. (2004). Using hydropower to complement wind energy: a hybrid system to provide firm power. Renew. Energy 29, 1887–1909. doi:10.1016/j.renene.2004.02.010
Jurasz, J., Beluco, A., and Canales, F. A. (2018a). The impact of complementarity on power supply reliability of small scale hybrid energy systems. Energy 161, 737–743. doi:10.1016/j.energy.2018.07.182
Jurasz, J., Canales, F. A., Kies, A., Guezgouz, M., and Beluco, A. (2020). A review on the complementarity of renewable energy sources: concept, metrics, application and future research directions. Sol. Energy 195, 703–724. doi:10.1016/j.solener.2019.11.087
Jurasz, J., and Ciapała, B. (2017). Integrating photovoltaics into energy systems by using a run-off-river power plant with pondage to smooth energy exchange with the power gird. Appl. Energy 198, 21–35. doi:10.1016/j.apenergy.2017.04.042
Jurasz, J., Dąbek, P. B., Kaźmierczak, B., Kies, A., and Wdowikowski, M. (2018b). Large scale complementary solar and wind energy sources coupled with pumped-storage hydroelectricity for lower Silesia (Poland). Energy 161, 183–192. doi:10.1016/j.energy.2018.07.085
Li, H., Liu, P., Guo, S., Ming, B., Cheng, L., and Yang, Z. (2019). Long-term complementary operation of a large-scale hydro-photovoltaic hybrid power plant using explicit stochastic optimization. Appl. Energy 238, 863–875. doi:10.1016/j.apenergy.2019.01.111
Miglietta, M. M., Huld, T., and Monforti-Ferrario, F. (2017). Local complementarity of wind and solar energy resources over Europe: an assessment study from a meteorological perspective. J. Appl. Meteorol. Climatol. 56 (1), 217–234. doi:10.1175/jamc-d-16-0031.1
Mohammadi, K., and Goudarzi, N. (2018). Study of inter-correlations of solar radiation, wind speed and precipitation under the influence of El Niño Southern Oscillation (ENSO) in California. Renew. Energy 120, 190–200. doi:10.1016/j.renene.2017.12.069
Moura, P. S., and de Almeida, A. T. (2010). Multi-objective optimization of a mixed renewable system with demand-side management. Renew. Sustain. Energy Rev. 14, 1461–1468. doi:10.1016/j.rser.2010.01.004
NOAA (2020). Cold and warm episodes by season by the national weather service national prediction center. Available at: https://origin.cpc.ncep.noaa.gov/products/analysis_monitoring/ensostuff/ONI_v5.php (Accessed September 17, 2020).
Odeh, R. P., and Watts, D. (2019). Impacts of wind and solar spatial diversification on its market value: a case study of the Chilean electricity market. Renew. Sustain. Energy Rev. 111, 442–461. doi:10.1016/j.rser.2019.01.015
Paredes, J. R., and Ramírez, J. J. (2017). Variable renewable energy and its contribution to energy security: complementarity in Colombia. Inter BankAmerican Development, 62. Available at: https://publications.iadb.org/publications/spanish/document/Energías-renovables-variables-y-su-contribución-a-la-seguridad-energética-Complementariedad-en-Colombia.pdf.
Poveda, G., Álvarez, D. M., and Rueda, Ó. A. (2011). Hydro-climatic variability over the Andes of Colombia associated with ENSO: a review of climatic processes and their impact on one of the Earth’s most important biodiversity hotspots. Clim. Dynam. 36 (11–12), 2233–2249. doi:10.1007/s00382-010-0931-y
Poveda, G., Waylen, P. R., and Pulwarty, R. S. (2006). Annual and inter-annual variability of the present climate in northern South America and southern Mesoamerica. Palaeogeogr. Palaeoclimatol. Palaeoecol. 234 (1), 3–27. doi:10.1016/j.palaeo.2005.10.031
Prasad, A. A., Taylor, R. A., and Kay, M. (2017). Assessment of solar and wind resource synergy in Australia. Appl. Energy 190, 354–367. doi:10.1016/j.apenergy.2016.12.135
Ren, G., Wan, J., Liu, J., and Yu, D. (2019). Spatial and temporal assessments of complementarity for renewable energy resources in China. Energy 177, 262–275. doi:10.1016/j.energy.2019.04.023
Risso, A., Beluco, A., and De Cássia Marques Alves, R. (2018). Complementarity roses evaluating spatial complementarity in time between energy resources. Energies 11 (7), 1–14. doi:10.3390/en11071918
Rodrigues, A., Mendonça, F., Trevenzoli, A., Helena, M., and Spyrides, C. (2016). Complementarity of Brazil’s hydro and offshore wind power. Renew. Sustain. Energy Rev. 56, 413–427. doi:10.1016/j.rser.2015.11.045
Santos-Alamillos, F. J., Pozo-Vázquez, D., Ruiz-Arias, J. A., Von Bremen, L., and Tovar-Pescador, J. (2015). Combining wind farms with concentrating solar plants to provide stable renewable power. Renew. Energy 76, 539–550. doi:10.1016/j.renene.2014.11.055
Silva, A. R., Pimenta, F. M., Assireu, A. T., and Spyrides, M. H. C. (2016). Complementarity of Brazil׳s hydro and offshore wind power. Renew. Sustain. Energy Rev. 56, 413–427. doi:10.1016/j.rser.2015.11.045
Solomon, A. A., Kammen, D. M., and Callaway, D. (2016). Investigating the impact of wind-solar complementarities on energy storage requirement and the corresponding supply reliability criteria. Appl. Energy 168, 130–145. doi:10.1016/j.apenergy.2016.01.070
Viviescas, C., Lima, L., Diuana, F. A., Vasquez, E., Ludovique, C., Silva, G. N., et al. (2019). Contribution of variable renewable energy to increase energy security in Latin America: complementarity and climate change impacts on wind and solar resources. Renew. Sustain. Energy Rev. 113, 109232. doi:10.1016/j.rser.2019.06.039
Wang, X., Chang, J., Meng, X., and Wang, Y. (2018). Short-term hydro-thermal-wind-photovoltaic complementary operation of interconnected power systems. Appl. Energy 229, 945–962. doi:10.1016/j.apenergy.2018.08.034
XM (2020a). XM portal Bi información inteligente. Available at: http://portalbissrs.xm.com.co/Paginas/Home.aspx (Accessed February 22, 2020).
XM (2020b). Aportes energía SIN. XM portal Bi información inteligente. Available at: http://portalbissrs.xm.com.co/hdrlg/Paginas/Historicos/Historicos.aspx?RootFolder=%2Fhdrlg%2FHistricos%2FAportes&FolderCTID=0x012000F14275A56AFB4B4C9224B396F21D2E93&View=%7B206DDC46%2D5571%2D4E1C%2DB79F%2DBA1F39DAA38C%7D (Accessed February 22, 2020).
XM (2020c). Generación por recurso. XM Portal Bi información inteligente. Available at: http://portalbissrs.xm.com.co/oferta/Paginas/Historicos/Historicos.aspx?RootFolder=%2Foferta%2FHistricos%2FGeneraci%C3%B3n&FolderCTID=0x012000B3FC86CB37661147B52CAE93637C1249&View=%7B946210C0%2D4071%2D4173%2D964C%2DED5BCCE4E66C%7D (Accessed February 22, 2020).
Zapata, S., Castaneda, M., Jimenez, M., Julian Aristizabal, A., Franco, C. J., and Dyner, I. (2018). Long-term effects of 100% renewable generation on the Colombian power market. Sustain Energy Technol Assessments 30, 183–191. doi:10.1016/j.seta.2018.10.008
Keywords: complementarity, Colombia, renewable power plants, hydropower, wind power, solar power, El Niño–Southern Oscillation
Citation: Parra L, Gómez S, Montoya C and Henao F (2020) Assessing the Complementarities of Colombia’s Renewable Power Plants. Front. Energy Res. 8:575240. doi: 10.3389/fenrg.2020.575240
Received: 22 June 2020; Accepted: 29 September 2020;
Published: 09 November 2020.
Edited by:
Joni Jupesta, SMART Research Institute (SMARTRI), IndonesiaReviewed by:
Alexandre Beluco, Federal University of Rio Grande do Sul, BrazilCopyright © 2020 Henao, Parra, Gomez and Montoya . This is an open-access article distributed under the terms of the Creative Commons Attribution License (CC BY). The use, distribution or reproduction in other forums is permitted, provided the original author(s) and the copyright owner(s) are credited and that the original publication in this journal is cited, in accordance with accepted academic practice. No use, distribution or reproduction is permitted which does not comply with these terms.
*Correspondence: Felipe Henao, amZoZW5hb0BpY2VzaS5lZHUuY28=
Disclaimer: All claims expressed in this article are solely those of the authors and do not necessarily represent those of their affiliated organizations, or those of the publisher, the editors and the reviewers. Any product that may be evaluated in this article or claim that may be made by its manufacturer is not guaranteed or endorsed by the publisher.
Research integrity at Frontiers
Learn more about the work of our research integrity team to safeguard the quality of each article we publish.