 Karl-Kiên Cao
 Thomas Pregger
 Jannik Haas1
 Hendrik Lens
94% of researchers rate our articles as excellent or good
Learn more about the work of our research integrity team to safeguard the quality of each article we publish.
Find out more
ORIGINAL RESEARCH article
Front. Energy Res. , 09 February 2021
Sec. Sustainable Energy Systems
Volume 8 - 2020 | https://doi.org/10.3389/fenrg.2020.541495
Future energy supply systems must become more flexible than they are today to accommodate the significant contributions expected from intermittent renewable power sources. Although numerous studies on planning flexibility options have emerged over the last few years, the uncertainties related to model-based studies have left the literature lacking a proper understanding of the investment strategy needed to ensure robust power grid expansion. To address this issue, we focus herein on two important aspects of these uncertainties: the first is the relevance of various social preferences for the use of certain technologies, and the second is how the available approaches affect the flexibility options for power transmission in energy system models. To address these uncertainties, we analyze a host of scenarios. We use an energy system optimization model to plan the transition of Europe’s energy system. In addition to interacting with the heating and transport sectors, the model integrates power flows in three different ways: as a transport model, as a direct current power flow model, and as a linearized alternating current power flow model based on profiles of power transfer distribution factors. The results show that deploying transmission systems contribute significantly to system adequacy. If investments in new power transmission infrastructure are restricted—for example, because of social opposition—additional power generation and storage technologies are an alternative option to reach the necessary level of adequacy at 2% greater system costs. The share of power transmission in total system costs remains widely stable around 1.5%, even if cost assumptions or the approaches for modeling power flows are varied. Thus, the results indicate the importance of promoting investments in infrastructure projects that support pan-European power transmission. However, a wide range of possibilities exists to put this strategy into practice.
Decarbonizing energy systems requires structural changes in the energy sector. Coping with high shares of renewable power generation requires flexibility, which can be provided by flexible demand and generation, energy storage, and/or transmission grids (to be referred to as “flexibility options” or “load-balancing technologies”). In addition, the power sector must be coupled to the other energy sectors to integrate renewable energy sources into heating and transport and to provide access to flexibility options, such as heat storage or power-to-gas applications. Model-based analysis of long-term energy scenarios is a well-developed and widely used approach to investigate the complex interactions of energy technologies, including flexibility options, with the purpose of advising policymakers and stakeholders. The major challenges of such modeling approaches include uncertainties stemming from assumptions about future developments (e.g., cost inputs) or from modeling techniques with different levels of abstraction.
Addressing these uncertainties calls for extensive analyses, with the appropriate models executed numerous times. However, the need for manageable computing times clearly restricts such approaches or the use of models that are excessively complex. This is one reason why interactions between spatial and temporal load-balancing technologies are not easily investigated, especially when a wide perspective is required, as is the case of the European energy system. Here, the identification and planning of pan-European energy infrastructure projects are performed by the European Network of Transmission System Operators for Electricity and for Gas (ENTSO-E and ENTSO-G, respectively) and their members in the context of the Ten-Year Network Development Plan (TYNDP). Since 2018, the TYNDP has contained a joint scenario development plan to assess the investment needs of gas and power transmission system operators. Its latest version also provides long-term scenarios that comply with the greenhouse gas (GHG) mitigation targets of the Paris Agreement (ENTSO-E and ENTSO-G, 2020). One core element of the TYNDP is the identification of projects of common interest that will be adopted by the European Commission and the EU member states. Although the underlying cost-benefit analysis aims to avoid social and environmental impact (ENTSO-E, 2018), the realization of such projects of common interest already faces substantial challenges today (ACER, 2019). Given that avoiding such residual impact is not always possible makes it even more important to gain more knowledge about alternative flexibility options for infrastructure and their associated costs.
Identifying flexibility requirements has been the objective of numerous studies, especially over the last decade. For example, the review of Haas et al., (2017) categorized the advances in planning energy storage technologies. They found, for example, that most studies considered less than three technologies for load balancing, and that sector coupling has been treated only incipiently. An overview of more general flexibility options is given by Zerrahn and Schill (2017), who concluded that requirements, in particular for energy storage, depend on a variety of parameter assumptions and model features.
Previous model-based scenarios identified the importance of grid expansion for the long-term transformation of the European energy system. Steinke et al. (2013) stressed the role of transmission to reduce the demand on backup generation capacity in 100% renewable energy supplies. The analyses of Schlachtberger et al. (2017) emphasized the contribution of bottleneck-free power transmission to the affordability of the energy system. Nevertheless, the findings of Marinakis et al. (2018) indicated that power transmission not only competes with energy storage but is also complementary. Cebulla et al. (2018) compared modeling results for over 500 energy scenarios and showed that electricity storage should reduce system costs, especially for systems with a high share of photovoltaics (PV), and that grid expansion is particularly important when wind power generation dominates. However, assumptions about future cost developments, differences in technology representation, and abstractions for model building (e.g., Gils et al., 2019) generally render these analyses debatable. Few investigations, however, consider investments both for additional power transmission capacities and to provide flexibility from power generation, demand response, and sector coupling. For Europe, one reason for this lack is due to transmission system planning in deregulated markets. In such a context, legalities have prevented alternative technologies such as energy storage from being considered in the grid planning process (Anuta et al., 2014).
Gaining more knowledge about the interaction and interchangeability of flexibility options and the associated system costs is not only relevant from the perspective of established technologies but also in light of new technologies. Besides intensified sector coupling, two factors exist that may strongly influence future infrastructure needs in the European electricity system: 1) the possibility of importing large quantities of electricity from North Africa and 2) the generation of hydrogen (H2) or other synthetic fuels from renewable electricity. Both cases may require an expansion of transmission grids to different extents. If carefully planned, such infrastructure could offer a high degree of flexibility and thus reduce the need to install other load-balancing technologies within Europe. Such interactions have already been investigated; for example, Trieb et al. (2012) and Benasla et al. (2019) discussed the potential of electricity imports generated by concentrated solar power (CSP) plants in North Africa. Michalski et al. (2017) focused in particular on stronger coupling of the power and gas sector with hydrogen generation to reduce the expense of the energy transition. However, such options need to be examined much more closely, considering their interactions and, in particular, their grid integration. In addition, public acceptance plays an important role in all transformation pathways, with concrete implications on the future energy system. Considerable acceptance problems already exist with the planned implementation of the large transmission lines, for example, from Germany’s wind-rich areas in the north to the demand centers in the south (Neukirch, 2016). In addition, inefficient planning and authorization procedures are frequently cited as causes for significant delays in the realization of energy infrastructure projects. Despite the identification and the application of measures for overcoming these obstacles (e.g., more transparent and participative planning procedures), their effectiveness remains uncertain (Schneider and Battaglini, 2013). Accordingly, energy scenarios also need to consider the delayed realization of infrastructure projects or to provide alternatives to unpopular technologies. On the modeling side, this can be translated, for example, into assumptions of the use of more expensive but more acceptable underground cables instead of overhead transmission lines for grid expansion measures (Sharpton et al., 2020). In this sense, solar power imports or a hydrogen economy also offer opportunities to overcome barriers from planning the energy transition by substituting conventional grid expansion with new and perhaps better accepted technologies (Bertsch et al., 2016). However, an assessment still lacks the restrictions mentioned for grid expansion and their impact on overall energy system planning.
In the context of expansion planning tools, techniques vary widely to model power flows in a high-voltage alternating current (HVAC) transmission network. In general, the most accurate modeling approach is AC power flow, which is typically used for power flow analysis, where infrastructure is fully modeled with high spatial resolution from the perspective of the overall energy system (Singh et al., 2014). To cope with the associated computational cost, the temporal dimension is usually reduced to snapshots (see Quintero et al. (2014), who treat worst-case scenarios). Energy system optimization models (ESOMs), on the other hand, seek to represent a full planning year for the entire energy system. The computational burden of solving the related nonlinear equations renders AC power flow impracticable for overall system planning (Zhang et al., 2012). Existing ESOMs and their case studies in Europe have used AC power flow equations that are usually simplified to linear direct current (DC) power flow equations (Leuthold et al., 2008) or have even used economic transport models (Schmid and Knopf, 2015) despite the significantly greater complexity of power transmission systems (Schaber et al., 2012).
To better account for power transmission when designing future energy systems, two general approaches have emerged. One approach is integrated modeling (Hörsch et al., 2018) which is characterized by increased spatial resolutions in ESOMs. This implies explicitly modeling nodes and transmission lines in the HVAC grid. Schönfelder et al. (2012) provided a detailed compilation of the associated modeling constraints to consider. The other general approach involves model coupling, which involves the iteration of a power flow simulation and an ESOM (Hagspiel et al., 2014). However, these studies focus on electricity transmission and oversimplify or neglect additional sectors (such as heat or fuels). To conclude, except for a few isolated efforts, power flow modeling approaches within large-scale ESOMs are limited to transport and DC power flow models, whereas the usefulness of these particular approaches is not fully understood.
The literature reveals gaps in ESOMs that address how to assess investments in power transmission infrastructure when planning future energy systems. In particular, a more careful examination is called for given the existence of many competing flexibility options, the conceivable but not yet implemented technological concepts, the major uncertainties in societal preferences of energy technologies, and the serious simplifications used in transmission modeling. This is where the present study makes its main contribution; we consider flexibility options that are currently under discussion (i.e., grid and storage expansion, controlled charging of (plug-in) electric vehicles, and demand side management) and, given this context, reevaluate the role of power transmission in the transition toward a low-carbon energy system in Europe. Concretely, our contribution consists of answering the following research questions:
1. What is the role of power transmission for the energy transition in Europe in terms of total system costs and its contribution to system adequacy under different scenarios?
2. How do different societal preferences affect future supply strategies, including electricity imports from solar power plants in Africa, and how does the large-scale implementation of hydrogen technologies affect the necessity of investing in power transmission?
3. How do different approaches to considering power transmission in energy system planning influence modeling results and derivable policy recommendations?
The questions above are relevant because power transmission is a key technology in the transformation toward low-carbon energy systems, albeit one that we discuss in the context of a host of conceivable load-balancing measures. To assess the contribution of power transmission and its expansion for the decarbonization of the European energy system, model-based analyses are required to explore a wide range of scenarios.
The following details the methodology of this analysis of model-based scenarios. The outcome is presented in Results, which is structured into subsections each referring to one of the three research questions. Contribution of Power Transmission and Other Flexibility Options to System Cost and Adequacy presents the contribution of power transmission to an affordable and adequate system, Power Transmission in Future Energy Systems as a Function of Technological Preferences emphasizes societal uncertainties, and Implications of Power Flow Modeling Approaches for System Configuration and Operation investigates how the methodology affects the model results. Finally, Discussion discusses the results and Conclusions and Outlook provides the conclusions together with an outlook on future research.
To find answers to our research questions, we rely on established methods from energy systems analysis. More precisely, to plan energy systems, we use an advanced ESOM called the “Renewable Energy Mix for a sustainable energy supply” (REMix). Today’s applications range from country-specific cross-sectoral energy system analyses (Gils et al., 2017b) to multi-regional power-system analyses of high spatial resolution (Cao et al., 2018). The modeling approach and the essential functionalities of the model are described in Gils et al. (2017a). Figure 1 overviews our modeling approach, which is described in the following subsections (each of these subsections is given in parentheses next to the box captions in the figure). An extended overview of our methodological approach including all types of input and output data is available in Supplementary Figure S1 of the Supplementary Material. Furthermore, Supplementary Table S1 provides a filled version of the Energy Scenario Study Transparency Checklist (Cao, 2016) which serves as alternative table of contents of this article.
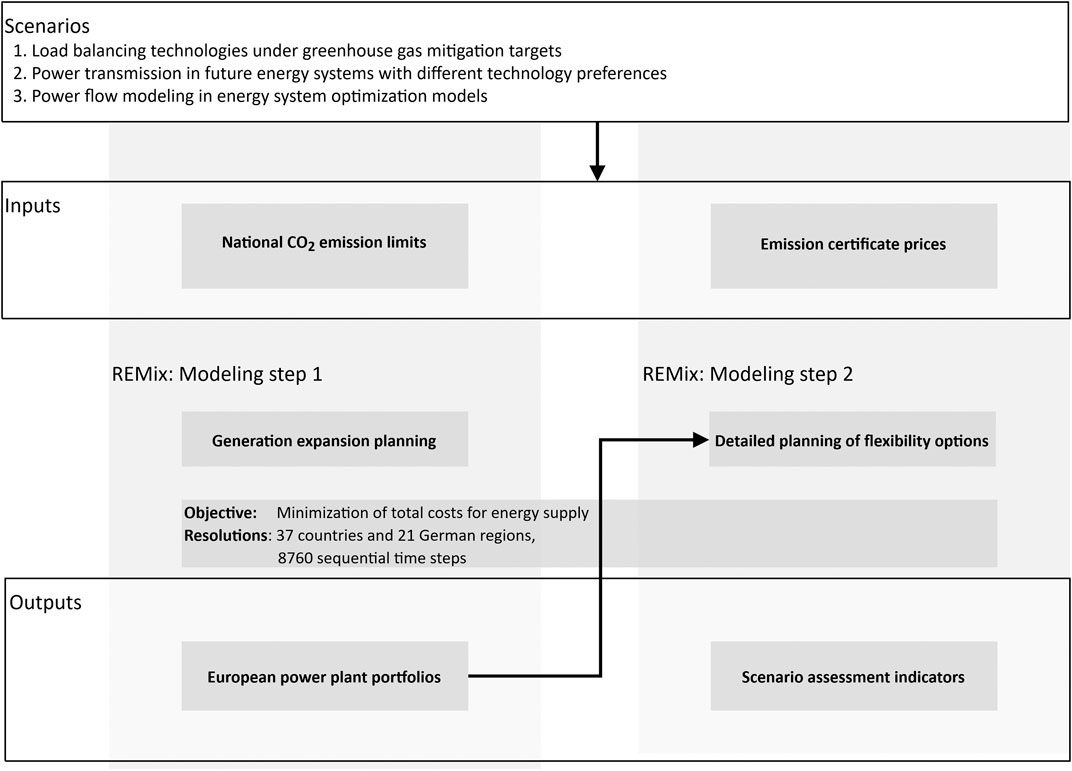
FIGURE 1. Overview of methods, including inputs, scenarios, and outputs. Our modeling approach has two steps: step one performs a classical expansion plan and step two a detailed planning of numerous flexibility options.
This work improves the ESOM REMix by integrating a more accurate representation of the power transmission system with respect to power flow modeling, related constraints, and investment costs. Subsequently, this model is applied systematically to analyze to what extent power transmission competes with or complements other flexibility options. Modeling Approach (REMix) provides further details on the model use for our analysis.
In terms of scope, we focus spatially on Europe and technologically on the power system, including the demand for heating and energy for individual transport (including power-to-gas applications) as sector coupling. Scope and Inputs elaborates on further details.
To reevaluate the role of transmission systems as one of many flexibility options in low-carbon energy systems, we define three sets of scenarios to answer our research questions. In general, these are characterized by different demand and supply structures that affect the transmission infrastructure. The first set of scenarios refers to different emission targets and the sensitivity to the generation mix. To treat uncertainties associated with modeling and parameter assumptions for power transmission, we vary both model inputs and modeling techniques. Therefore, the second set of scenarios defines narratives of technology acceptance and the availability of large infrastructure (including generation, storage, and transmission infrastructure) that affect the need for spatial load balancing. Finally, the third set of scenarios corresponds to different approaches for modeling power flows in energy system optimization models. Scenarios details these three scenario sets.
Based on a cost minimization, REMix determines the optimal system configuration and how the energy system is to be operated to satisfy demand. REMix is setup to model a whole year over sequential hourly time steps (i.e., 8760 steps). The main outputs refer to quantified investments in technologies from a given set and dispatch time series. The technologies considered include fossil and renewable power generators, load-balancing options (i.e., energy storage, demand side management, power-to-gas, and power-to-heat), electricity transmission, as well as hydrogen generation, storage and reconversion to electricity including transport via gas transmission infrastructure. Supplementary Table S4 of the Supplementary Material gives an exhaustive list of technologies considered in our study.
As indicated in Figure 1, we perform a two-level optimization: in the first level, we plan the investments in generation (in a simplified manner), transmission, and (one kind of) storage systems starting from an initial European power plant portfolio that considers current generation capacities in addition to a phase-out of coal. Only the resulting power generation mix is passed on as input to the second level, which in turn decides on details of the different flexibility technologies. Note that this differs from a bilevel optimization, in which one problem is nested within another (Fan and Cheng, 2009). We opted for this two-level approach to be able, in each scenario, to benchmark the resulting flexibility options against each other rather than compete with expansions from all types of generation technologies. The final outputs for the scenarios considered are described by several key indicators, including total system costs, investments in each of the flexibility technologies, backup capacities, emissions, and capacity factors.
The first modeling step is to find intentionally stressed European power plant portfolios to serve as a baseline (i.e., starting point) for many scenarios of this study. This rationale is inspired by how, in real power markets, the core of the system already exists. From the given baseline, changes are evaluated in response to the emergence of new flexibility options, changes in societal acceptance, and improvement of energy models.
Sector coupling is modeled as an inflexible electricity demand time series of the transport and heat sectors, while the operation of combined heat and power plants are determined by must-run factors that stem from preliminary analyses in which these factors negligibly affect the resulting system configuration. The stressed system results from running the optimization for different time series of historical weather years from 2006 to 2012 (seven model runs) and picking the year with the smallest generation capacities (i.e., lowest adequacy). With this intentionally undersized system, we run the second modeling step.
The modeling is restricted by a series of boundary conditions, so that the results appear plausible from today’s perspective. One constraint relates to the overall emissions of energy-related carbon dioxide (CO2) from power generation applied to each country while accounting for current discussions on burden-sharing and equity principles. The appropriate emission caps are set to meet either a 55% or 85% CO2 reduction target. Another constraint distributes the power generation capacities across Europe by setting country-specific self-sufficiency thresholds of 80% in terms of annual demand. As an additional adequacy constraint, 80% of the annual peak load is enforced as firm capacities per country. The use of 80% for both the self-sufficiency ratio and the firm capacity is based on judgment of experts deduced in an internal workshop from preliminary model runs with thresholds of 0%, 50%, 80%, and 100%.
The second modeling step focuses on the deployment of a broad spectrum of flexibility options to balance power generation with demand. This means that the prescribed generation capacities are fixed (using the values from the first level). However, investments into additional gas turbines as backup capacity remain possible (this can be interpreted as an indicator of the security of supply). As energy storage systems, we consider pumped hydro, adiabatic compressed air, and lithium-ion and vanadium redox flow battery systems. Demand side management of industrial consumers and controlled charging of electric vehicles enter as further flexibility options in the second level.
Compared with modeling step 1, sector coupling is now modeled in much more detail. Using the modeling concepts from Gils (2015), we cover heat demand by conventional technologies (gas burners or district heating networks) or electrical technologies (electric boilers and heat pumps). The model determines the capacity of these technologies, including their heat storage.
Some scenarios allow for expansion planning for hydrogen generation and storage (Table 1). Large electrolyzers produce hydrogen to be stored in salt caverns and later either used directly as fuel for transportation or indirectly by reconversion to electricity. Direct use is allowed in fuel stations within a radius of 100 km of the caverns. We assume that gas stations further away would have their own small electrolyzers for on-site hydrogen production and storage in tanks. Reconversion to electricity is enabled by cofiring hydrogen to (renewable) methane in all open and combined cycle gas turbines in the vicinity of the caverns (Noack et al., 2014).
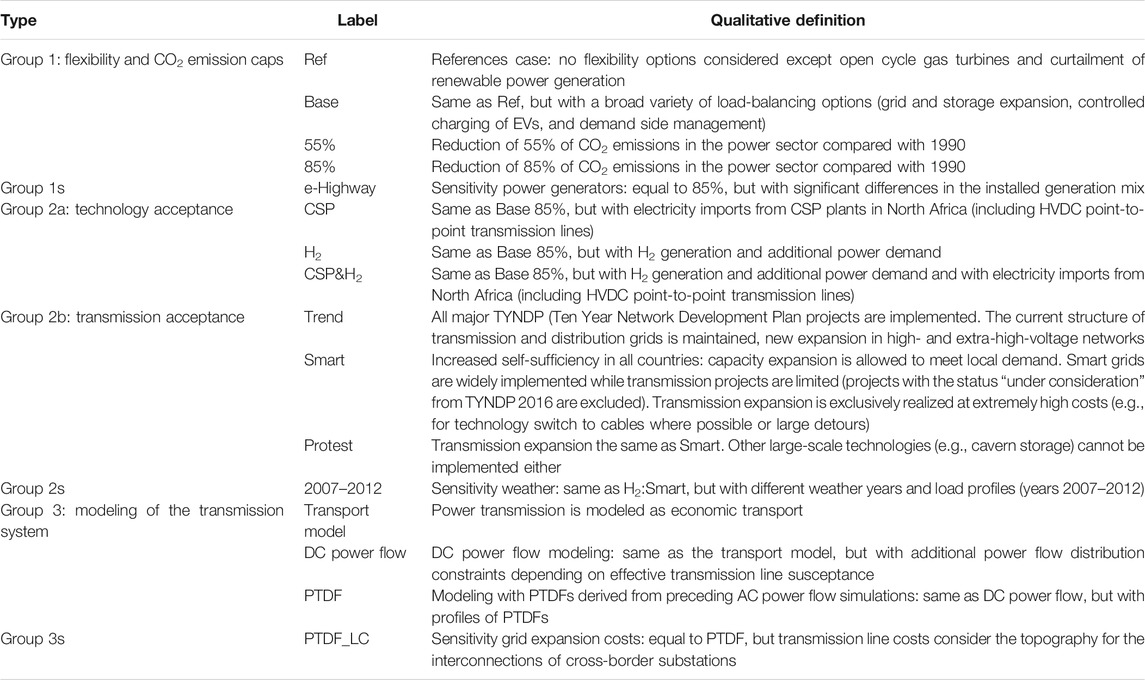
TABLE 1. Qualitative specification of scenarios and model parameterization.
The scope of our analysis is the energy system of Europe (ENTSO-E members, without Turkey, Iceland, and Cyprus). Figure 2 illustrates the spatial resolution and the representation of the power transmission grid. The higher spatial resolution for Germany is due to the history of model development and the availability of data for model parameterization. In the analysis carried out here (with a focus on the whole of Europe), this enables a more precise consideration of the power flows in the central part of Europe. Note that candidate lines (e.g., for importing solar energy from Africa) are not depicted. The power system is fully considered, whereas the heat and transport sectors are modeled as explained in Level 2: Detailed Planning of Flexibility Options.
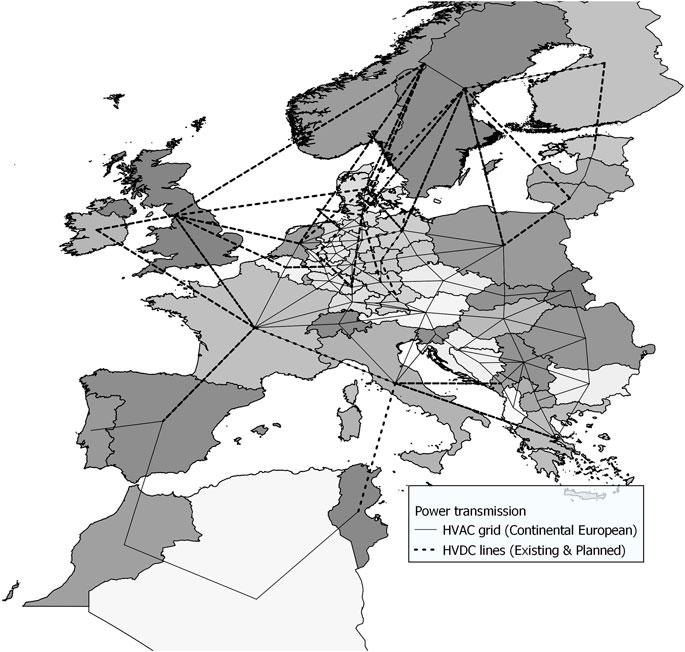
FIGURE 2. Geographical scope, abstraction of transmission grid, and spatial resolution within Europe.
The resulting systems from REMix are evaluated in terms of the energy supply trilemma—affordability, system security, and sustainability—based on a set of defined indicators. The first aspect of the trilemma, affordability, is given by the objective function of the applied model. The second aspect, system security, is assessed from the perspective of adequacy, which is a common indicator for long-term planning (ENTSO-E, 2018). In this sense, adequacy refers to the existence of facilities within the system that ensure load balancing with respect to operational constraints (Billinton and Allan, 1988). When using an ESOM with a power balance constraint applied to each hour of the year, system adequacy is intrinsically ensured either by building a cheap power generation facility (power-related adequacy) or by producing very expensive electricity from an artificial (slack) generator (energy-related adequacy). The latter is the common approach in ESOMs if only a given power plant portfolio should be operated (without the possibility to expand generation capacity) but could lead to inappropriate high markups on system costs and would complicate a cost-based comparison of scenarios. Therefore, we measure system adequacy as the capability of flexibility options to avoid the installation of gas turbines. Finally, the third aspect, sustainability, is evaluated in terms of energy-related CO2 emissions.
The main inputs to REMix include five large groups: technology data, weather data, energy demand, emission budgets, and other technical assumptions. These are summarized in the following.
Technology inputs include conversion efficiencies, investment, and operation cost projections, as well as the installed capacities and related phase-outs (i.e., limited lifetime).
The costs and conversion efficiencies of fossil-fired power plants are based on the work of (Gils, 2015) and have been validated by earlier studies (Scholz et al., 2014; Scholz et al., 2017). Updated technoeconomic data on energy storage are taken from Cebulla et al. (2017), whereas costs for expansion and maintenance of transmission lines are taken from Feix et al. (2012) and Seidl and Heuke (2014). New technologies in the current study involve electrolyzers, hydrogen storage tanks, and hydrogen caverns as initially used by Michalski et al. (2017). The corresponding costs were estimated by Noack et al. (2014) and can be consulted in Cao et al. (2019). Supplementary Table S2 of the Supplementary Material lists all assumptions both on specific investments and on operation and maintenance costs.
For thermal power plants, we use the installed capacities given by Platts (2015) and assume technology-specific life-times for their phase-out. Political plans for phase-out of coal and nuclear power are additionally superimposed (in the model, no new coal plants can be built and nuclear power can only be built in countries that already have nuclear power plants). For existing renewable technologies, we use the capacities from ENTSO-E (2015b). In terms of grid expansion, we prescribe all or only a selection of projects of the Ten-Year Network Development Plan 2016 (ENTSO-E, 2015a), depending on the grid scenario (Scenario Group 2: Roles of Power Transmission in Future Energy Systems).
The weather input data are based on resource potentials processed as described by Scholz (2012) but using weather datasets for Europe and North Africa from 2006 until 2012. The calculation of potential power generation from PV, CSP, and wind relies on technology data collected from the year 2010 (e.g., performance curves of wind energy converters). Hydropower plants are modeled as feed-in time series (i.e., run-of-river and reservoirs) based on data from the year 2010. The potential analysis also considers land availabilities for building new power generation capacities and aggregates the data to a spatial resolution that corresponds to that shown in Figure 2. The resulting values of both feed-in time series and maximal installable renewable power generation are taken as input for the energy system planning with REMix.
Unless otherwise indicated, the optimization is executed with weather inputs from 2006, which was a year with average capacity factors (relative to other available years).
The projection of the annual electricity demand relies primarily on data published in the e-Highway 2050 study (Bruninx et al., 2014). Existing conventional consumers are based on the scenario “Small and Local” which assumes low economic and population growth in Europe. This results, according to the Vision 4 scenario of ENTSO-E (2016a), in a long-term decline from around 3,200 TWh in 2014 to 2,700 TWh in 2050, after an intermediate increase to 3,480 TWh in 2030. Future energy systems will additionally be impacted by new electricity consumers. Assumptions on the overall demand for heat and for electricity for heat pumps and electric heaters are based on the study of Scholz et al. (2014). The annual energy demand from electric vehicles is taken from the e-Highway scenario “100% RES” with the exception of Germany, which is modeled by scenario C of Nitsch et al. (2012). For all countries, hydrogen demand for transport is determined by using a methodology similar to that used for Germany (see also Pregger et al. 2013). As a result, the additional electricity consumption in 2050 for heat is assumed to be 185 TWh and for electric vehicles a maximum of 529 TWh for all of Europe. For a scenario with hydrogen use, the electricity consumption for electric vehicles is 263 TWh, and the complementary electricity consumption for hydrogen in transport is about 570 TWh. The country-specific values for the annual energy demand used as model input are provided with the Supplementary Table S6.
The final inputs for REMix are hourly time series of electricity, heat, and hydrogen consumption. These time series are determined by multiplying sector-specific energy demands with predefined load profiles taken from or derived similarly as in the studies by ENTSO-E (2016a); Pregger et al. (2012); Gils (2015); and Michalski et al. (2017).
Mitigating CO2 emission in REMix can be modeled either by setting an upper bound for emissions according to a predefined annual budget or by using penalty costs (e.g., for emission allowances). Although we use the first variant in level 1, we apply the latter in level 2 to observe an additional indicator for comparing scenarios.
To ensure that each country contributes to achieving the European GHG mitigation targets, we define country-specific CO2 budgets that are determined based on annual energy balances from 2010 (IEA, 2014) to 2050 and fuel-specific CO2 emission factors (Intergovernmental Panel on Climate Change, 2006). Based on a reduction target of 90% in the German power sector and by assuming equal per capita emissions in Europe in 2050, a total reduction between 55% and 85% (compared with 1990) seems achievable and is imposed in the model across all EU-28 countries. The resulting CO2 budgets are presented in Table 2. For North African countries, a maximum in emissions is set as upper bound (167% and 116% relative to 1990). Please refer to the Supplementary Material, Table S7 for obtaining the country-specific values of the emission caps.
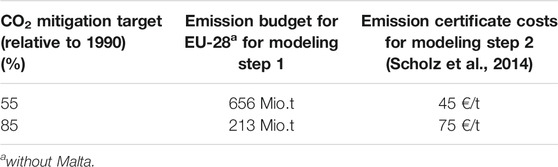
TABLE 2. Cumulated CO2 emission budgets for power generation and certificate costs.
From the results of modeling step 1, we can derive emission certificate prices that would lead to similar emissions. These are based on the marginal values of the corresponding decision variables. As in modeling step 1, these prices are country-specific; we assume comparable average values according to Scholz et al. (2014), as shown in the right column of Table 2.
One of the goals of this work is to use a more detailed transmission grid model in the ESOM REMix. The highest level of detail is reached with AC power flow models that fully model active and reactive power flows for each line. However, given their nonlinear characteristics, the AC power flow equations cannot be used in the context of optimization, as in an ESOM. Linearization of the trigonometric functions involved and assuming constant voltage amplitudes of 1 p. u. at each node lead to the linear “DC power flow” equations (Stott and Alsac, 1974). The DC power flow approximation corresponds to a linearization around a constant, artificial operating point, which may result in relevant errors if the real operating point differs significantly. Moreover, it requires either a representation of all nodes in the grid or when considering aggregated regions, the definition of equivalent and virtual lines between regions. For ESOMs, the former usually does not match the spatial resolution of the rest of the model, whereas the latter is nontrivial and may cause additional inaccuracy. To overcome these shortcomings and to provide an interface between the simplified AC grid representation in REMix and feasible grid operating points, a numerical linearization of a full AC power flow model can be performed. While the structure of the resulting linear equations is like those of DC power flow, the equations correspond to a linearization around a realistic and feasible AC power flow solution. Thus, a smaller error due to the linearization can be expected than for the DC power flow equations. Moreover, by evaluating the change in the sum of power flows between regions, the aggregation to a coarser spatial resolution is straightforward. For each operation point (i.e., AC power flow solution) considered, the linearization yields a so-called “power transfer distribution factor” (PTDF) matrix that is representative of the given and similar grid operating points. One of these PTDF matrices is assigned to each of the 8,760 time steps in REMix. In the following, we explain in detail the procedure for conducting such a unidirectional coupling of AC power flow simulations to an ESOM.
Consider a high spatial resolution AC power flow model, i.e., with
where
A linearized power flow model then aggregates the
Note that this linear relationship between aggregated flows in flow gates
In the context of the coupling between REMix and the model presented herein of the transmission system, we use the procedure described above to determine six characteristic PTDF matrices based on a full AC transmission system model at six different operating points. To determine characteristic operating points, publicly available time series data were obtained from the Open Power System Data platform (Open Power System Data, 2017), which is based on data from European TSOs. These time series cover such things as electrical load, feed-in from wind, and solar power per country. From the time series of 2015, six representative combinations of load and wind feed-in were selected: low, medium, and high load combined with low and high wind feed-in. For each of these time instances, a suitable AC power flow model was set up and used to compute six different PTDF matrices
In addition to power flow in an existing AC transmission grid, REMix also considers AC grid expansion to increase the interconnection capacity between regions. This can be considered as a flexibility option to balance load and demand in competition with other flexibility options within regions. Note that high-voltage direct current (HVDC) connections are also considered in REMix but treated differently because the power flow over these can be controlled independently.
To consider AC grid expansion, it is necessary to estimate the related cost. We consider both capacity expansion of connections and the construction of new connections. To add capacity to existing connections, we use cost assumptions from Feix et al. (2015) and Dena (2010). For new connections, a common assumption is to assume a fixed cost per unit length and capacity. However, a further decisive factor is the type of terrain to overcome. Accounting for this factor leads to different specific costs for each interconnection. To determine the total expansion costs, an altitude model was developed covering the complete area of the transmission system model determined by satellite data from the Shuttle Radar Topography Mission (Deutsches Zentrum fuer Luft-und Raumfahrt e. V. (DLR), 2016). To obtain a sufficiently precise categorization of the terrain type between regions, the topography data are classified into four clusters. Based on a meta-study on (estimated) costs for grid expansion projects, specific costs for each terrain type have been derived. Finally, the grid expansion measures are factorized with a terrain-dependent detour factor because the length of a line exceeds the linear distance between both ends. For each pair of neighboring regions, two transmission grid substations are selected that are suitable for interconnection. The direct line between the geo-coordinates of these substations is then used to determine the distance for each terrain type, thereby allowing the total cost of a new interconnection to be computed. Supplementary Table S3 of the Supplementary Material provides the resulting costs for a standard overhead line type (562-AL1/49-ST1A) with a maximum capacity of about 5.5 GW.
To answer the three research questions, we define three scenario groups. The first group seeks the transmission system investments within a multitude of other flexibility options under the assumption of different CO2 caps. The second group focuses on the societal acceptance of different energy technologies, also including transmission. Finally, the third group consists of different ways of modeling power flows in the grid. Table 1 provides a qualitative overview of the key assumptions applied to each element of the scenario groups. The scenarios are based on consistent assumptions and thus are easily comparable. They have the following in common: they couple the heat and power sectors (i.e., boilers and heat pumps), they allow curtailment of renewable electricity generation, and they use capacity expansion of open cycle gas turbines to provide backup capacity. Table 3 lists the scenarios examined and the corresponding quantifiable differences, which are explained in the following.
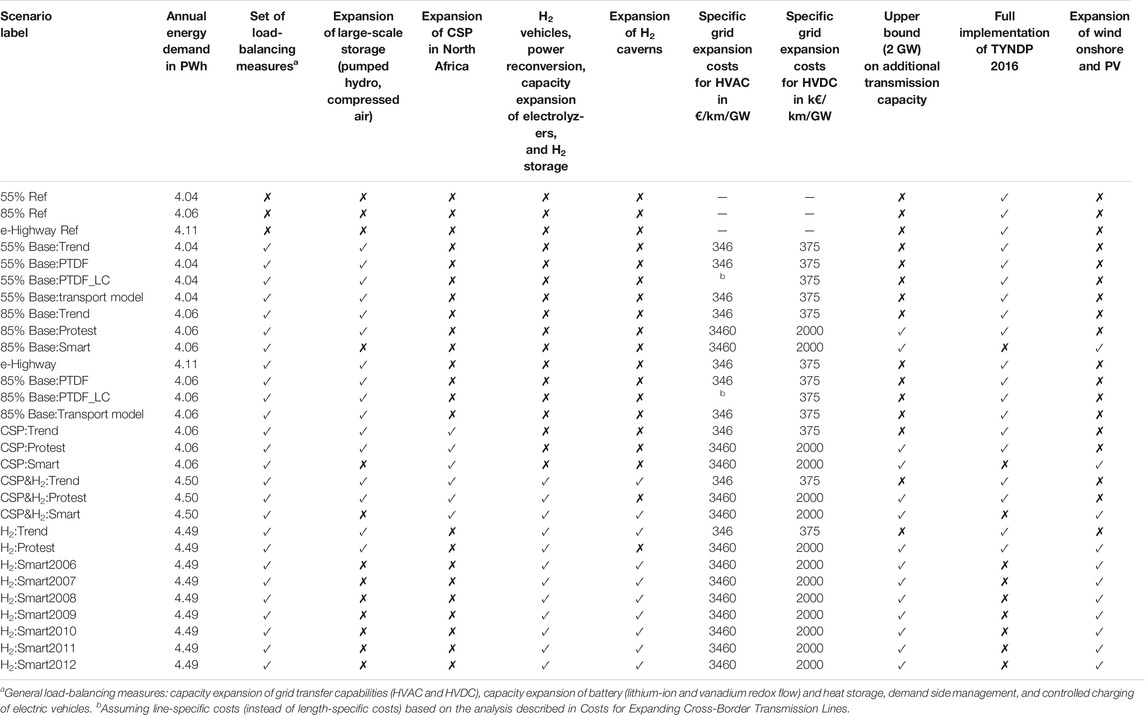
TABLE 3. Specification of scenarios and model parameterization.
To clarify the role of power transmission in the context of competing flexibility technologies, we define a “Base” scenario for each of the two GHG mitigation targets determined in Emission Budgets and Emission Costs. In addition, an equivalent scenario “Ref” is set up to gain the maximum demand on backup generation capacity for each GHG emission target. This backup demand is reduced by deploying load-balancing technologies. In other words, this scenario (in which system adequacy is achieved solely by gas turbines) is designed as benchmark to be compared with all other scenarios. The scenario e-Highway probes the sensitivity with respect to the distribution and composition of the European power plant portfolio. In contrast with all other scenarios, the installed capacities used as a starting point in modeling step 1 stem from the scenario “Small and Local” of the e-Highway 2050 project (Vafeas et al., 2014).
The second group of scenarios captures narratives on the technological preferences of large-scale energy projects, including CSP, H2, and transmission. These narratives are all characterized by the generation mix determined in level 1. The first narrative (CSP) allows power imports from CSP plants in Africa according to the concept presented by Trieb et al. (2012). It extends the Base 85% scenario by optimizing CSP capacities in Morocco, Tunisia, and Algeria including candidate HVDC transmission lines to Europe. The second narrative (H2) allows hydrogen technologies (electrolyzers and hydrogen storage) to be widely deployed. Note that the well-to-wheel efficiency of synthetic fuels is worse than that of plug-in electric vehicles, which increases the electricity demand significantly for hydrogen use. Scenarios denoted as CSP&H2 combine both solar power imports and hydrogen infrastructures.
In terms of preferences for transmission systems, we define three grid scenarios: Trend, Protest, and Smart that each makes different assumptions about the permissible capacity expansion and on the type of lines to be deployed (overhead or underground; Tables 1 and 3). The Protest scenario is extreme in the sense that it assumes that any large-scale technology is to be avoided. Finally, to account for different weather years, we defined an additional set of scenarios that vary the renewable power generation and demand profiles. These are labeled by the year of the underlying empirical data.
To investigate how different power flow modeling approaches affect the final recommendations for transmission investments and for the mix of load-balancing technologies, we define four scenarios. The first scenario is Transport model and relies on an economic transport model. Here, power flow in the grid, resulting from surpluses and deficits of nodal power injections, is restricted only by the transfer capabilities of the transmission lines. The second scenario, DC power flow, adds voltage angles to the model to restrict the distribution of power flow according to the physical parameters of the transmission lines (distance-dependent line susceptance). The third scenario, PTDF, denotes a linearized power flow computation approach for which the PTDFs are determined in the preceding AC power flow simulations of the fully resolved transmission network. Based on the PTDF matrices of the six grid situations analyzed (see Power Transfer Distribution Factors), we determine hourly PTDF profiles as additional input for REMix. The fourth and final scenario, PTDF_LC, uses the same constraints as the third scenario but computes more specific costs for all cross-border transmission lines (as described in Costs for Expanding Cross-Border Transmission Lines) instead of using coarse distance-estimates based on the aggregated model.
The first three scenarios result in the equations given in Table 4. For the sake of clarity, we simplified the notation (e.g., planning year or transmission technology sets are neglected) compared with that implemented in REMix.
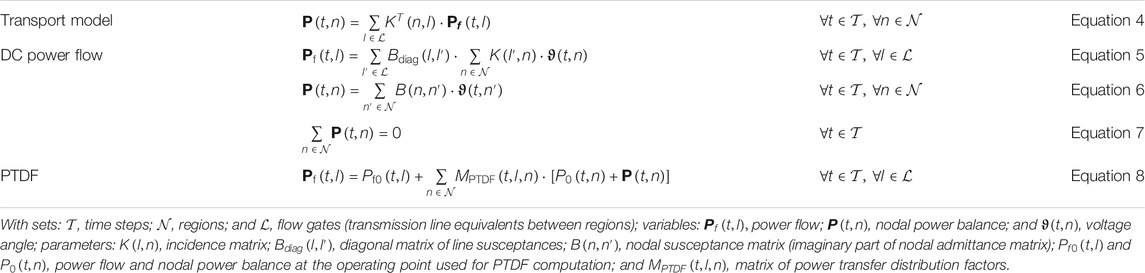
TABLE 4. Implementation of power flow approaches in REMix: transport model, DC power flow, and PTDF.
This section is divided into three parts. The first part presents the contribution to cost efficiency and system adequacy of power transmission under CO2 emission constraints and in the context of other load-balancing technologies. The second part details this contribution with a special focus on a broader set of scenarios. The third part shows how different power flow modeling approaches affect the final investment recommendations of transmission infrastructure. Note that the data tables for all figures in this section are available in the Supplementary Material.
Before getting into these subsections, we provide the necessary background to understand the main trends that will be laid out. Recall that we optimized in two steps in which the power generation capacity of the first step serves as the basis for the second step, which plans the flexibility options in more detail. Figure 3 shows these mixes of power generation (found in the first step) for the different narrative scenarios. Scenarios 55% Ref, 85% Ref, and e-Highway Ref do not appear in Figure 3 because their capacities are identical to the corresponding Base scenarios.
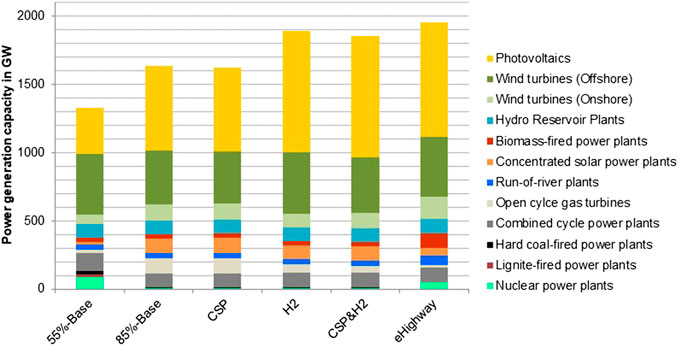
FIGURE 3. Power generation mixes for several European narrative scenarios.
Figure 3 clarifies several aspects of the capacities. The first is that the installed capacities in the 85% scenarios significantly exceed those in the 55% scenario (at least 1600 vs. 1500 GW). Next, the capacities in the H2 scenarios are up to 13% greater than those of Base or CSP scenarios, given the correspondingly higher energy demand. Finally, the e-Highway scenario has even larger capacities, which is a direct result of the prescribed power plant portfolio being even larger than in the other scenarios where the majority of power generation capacities are optimized. For further insights into the outcome of modeling step 1, Table S5 of the Supplementary Material presents the country-specific power generation mixes.
We now analyze how power transmission contributes to system adequacy and system costs in a context where a host of other flexibility options are available. Two types of scenarios are distinguished: the reference cases (where additional flexibility is only provided by backup capacities) and scenarios where almost all conceivable technologies for load balancing are available (the simplest of those being “Base”). Note that, in the following, we refer to the qualitative and quantitative differences between the scenario sets listed in Tables 1 and 3, respectively.
Recall that we measure system adequacy as the reduction in backup capacity (which here is gas turbine capacity). In other words, the lower the gas turbine capacity is compared with a Reference scenario, the higher is the contribution to system adequacy of all flexibility options. For system costs, we measure the difference in relative system costs between a given scenario and its corresponding reference. (Total) system costs are composed of all costs for the supply of fossil fuels, emission allowances, variable and fixed costs for operation and maintenance, and annuities of both model exogenously and model endogenously installed capacities.
Figure 4 plots the system cost difference vs. the backup capacity for all scenarios whose generation mix differs from the obtained in modeling step 1. (Please refer to Supplementary Table S8 to inspect the corresponding numerical values.) The scenario 85% Ref has, per design, the highest backup capacity. These 242 GW also serve as a benchmark for the scenarios that accept different energy supply strategies (scenario set 2a). This means that solar imports from CSP plants and/or hydrogen economy are considered in addition to flexibility options.
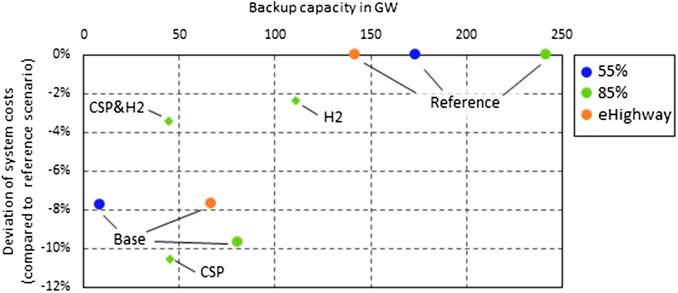
FIGURE 4. Energy costs reduction (relative to a corresponding reference case without expansion of flexibility options) and system adequacy for different European energy scenarios.
The 85% Base scenario has a backup capacity of 161 GW, which implies that the flexibility options contribute 81 GW to system adequacy. Such contributions also occur in all other scenario pairs: 75 GW in 55% Ref vs. 55% Base and 165 GW in e-Highway Ref vs. e-Highway Base. These results lead to the conclusion that the presence of flexibility options improves system adequacy.
Almost 10% separates the cost scenario 85% Ref from 85% Base. Compared with their Base scenarios, the 55% scenario and e-Highway see a reduction in system cost of 7.7% and 7.8%, respectively. Such high numbers confirm the relevance of sector coupling and of directing modeling efforts toward a better understanding of the role of sector coupling in future energy systems.
Although the assumed hydrogen infrastructure provides the system with significant flexibility, resulting in low backup capacities, scenario H2 has a relatively small cost reduction, less than 2.5%. This effect can be traced back to the higher annual electricity demand of a hydrogen-consuming transport sector. Both scenarios that consider solar power imports from North Africa (CSP and CSP&H2) show a strong substitution of backup capacities. This is due to their ability to provide additional power generation capacity. Scenario CSP achieves the lowest system costs of 348 Bn. €.
Note that e-Highway scenarios have the best system adequacy but significantly higher system costs (511 Bn. €). This relates to the prescription of a power plant portfolio that is simply more expensive than that resulting from our cost minimization (modeling step 1). Something similar happens for the 55% scenarios (Ref and Base) where the annuities from the existing (fossil-based) park are suboptimal in contrast with the alternative of investing in optimally sited renewable power generators, as occurring in other scenarios.
Next, we consider in more detail how to provide the flexibility that reduces system cost and increases system adequacy. In particular, we want to discover how power transmission contributes to these effects. Therefore, Figure 5 plots the investments into power transmission vs. the investments made for energy storage. (The underlying numerical values of Figure 5 are provided with the Supplementary Material, Table S9.) In order to obtain more evidence, we also extend the scenarios analyzed above (Figure 4) by varying the acceptance of power transmission and weather conditions (Table 1, scenario sets 2b and 2s, respectively). Note that, in terms of transmission acceptance, scenarios labeled Trend in Figure 5 are equivalent to those shown in Figure 4.
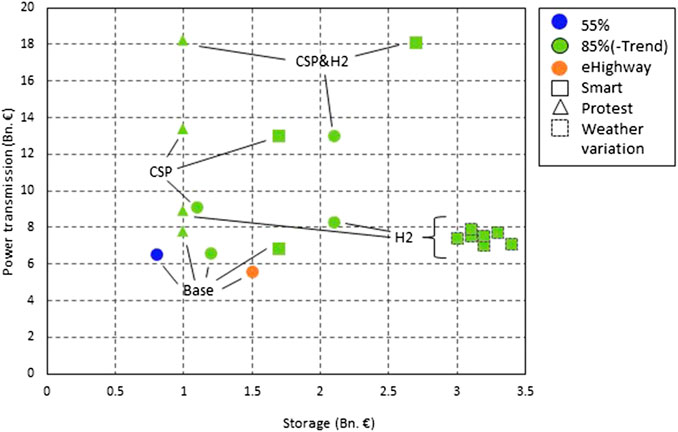
FIGURE 5. Investments (annuities) required for expanding power transmission plotted vs. storage cost in Bn. €. Storage in CSP plants is neglected.
It is striking that the ratio of storage to transmission investment always exceeds unity, which indicates a clear preference for grid expansion. The minimum ratio is approximately two and occurs in scenarios with limited and more expensive grids (Smart and Protest). The highest ratio of 18 occurs in CSP&H2:Protest with grid investments of 18.2 Bn. €. Here, two factors combine: first, the massive solar power imports from Africa require the corresponding lengthy HVDC transmission lines and second, large storage facilities are inadmissible in Protest scenarios which limit storage investments and thus favor transmission.
The smallest grid investments occur in scenarios that consider neither solar imports nor a hydrogen system; this is the case for e-Highway, which has the smallest value of 5.6 Bn. €. However, recalling Figure 4, this scenario presents the highest system costs. Here, a more extensive power generation park provides the flexibility. The lowest investments in storage occur in protest scenarios (all of about 1 Bn. €), where only heat storage is deployed (e.g., those installed with combined heat and power plants).
In general, storage requirements depend on the need to match renewable generation with demand (fluctuations of the residual load), both of which depend strongly on weather. To further underpin the statement that grid investments dominate storage investments, we subject the scenarios with the largest storage investments (H2:Smart) to different weather years. The results are given in Figure 5 by the markers with the dashed outline and consistently show grid to storage ratios around two, with absolute investments between 3 and 3.5 Bn. €.
In short, the many available flexibility options (including sector coupling and transmission) contribute strongly (from about 80 GW to 160 GW) to system adequacy in all scenarios. In terms of cost, flexibility options achieve a significant reduction of 10%. Both findings underline the relevance of the flexibility options for working toward highly renewable systems. Finally, even in the context of numerous flexibility options, investments in transmission are significantly greater (at least by a factor of two) than in storage.
This section shows how different scenarios of technological preferences affect the resulting investment recommendations. We first focus on scenarios with solar imports and hydrogen generation (scenario set 2a), followed by scenarios of grid acceptance (scenario set 2b). The following indicators are used to assess the scenarios:
• Normalized capacity factor (labeled by CF%) of gas turbines, combined cycle gas turbines (CCGT) and pumped hydro
• Installed power capacity (labeled by GW) of new gas turbines, lithium-ion (Li) batteries, and CSP
• Installed energy storage capacity (labeled by GWh) of hydrogen caverns and pumped hydrostorage
• Curtailment of wind turbines and PV energy relative to the annual potential (labeled by %)
• Cumulated grid expansion (labeled by TW km) of HVAC and HVDC transmission lines
• CO2 emissions (labeled by Mio. t) from power and heat sector (note that, CO2 emissions from the transport sector are not considered in the applied modeling approach and thus are not explicitly provided)
• Total installed wind turbine and PV capacity (labeled by GW). Recall that, in contrast with all other outputs, the wind turbine and PV capacities are fixed results from modeling step 1 and can only be increased in the scenario Smart.
Figure 6 plots these indicators in a radar (or spider) diagram. Scenarios with preferences for CSP imports and hydrogen generation are plotted on the left and compared with Base (Figure 6A), and those related to grid preferences (Trend, Smart and Protest) are plotted on the right (Figure 6B). Note that these grid scenarios were computed for all CSP&H2 scenarios, but the results are remarkably similar. For this reason, the grid scenarios are only shown for CSP&H2. We start by analyzing the implications of each technology, for the scenarios under consideration, and then derive the implications for transmission.
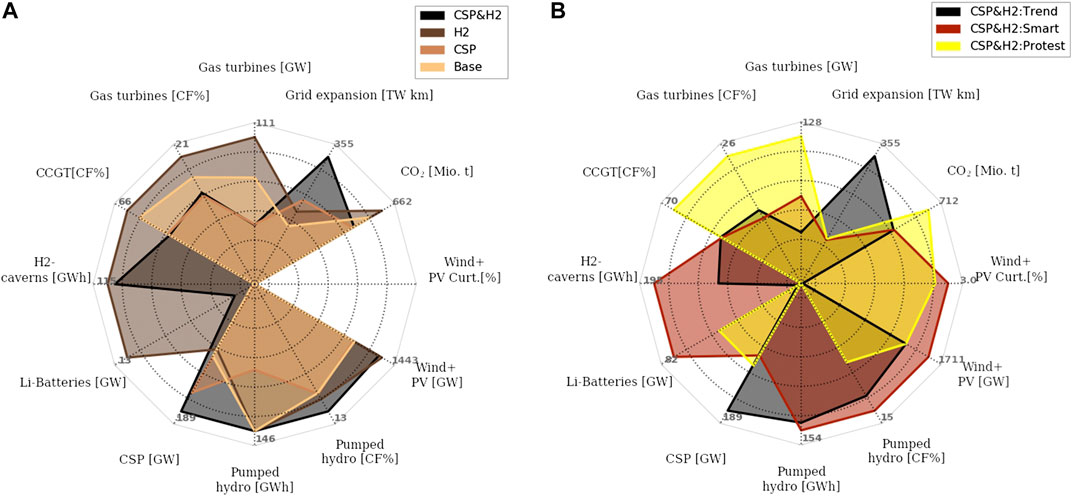
FIGURE 6. Key indicators for technology scenarios (left) and grid scenarios (right) for 85% CO2 reduction targets.
In terms of storage, vanadium redox flow batteries and adiabatic compressed air storage do not produce investments in any of the scenarios, which is why they are absent in Figure 6. By definition, only H2 scenarios can deploy hydrogen caverns. The 175 GWh obtained across Europe is of the same order of magnitude as the 146 GWh of pumped hydroplants. Lithium-ion batteries only occur in scenarios with hydrogen infrastructure; their absence in other scenarios might relate to the availability of other short-term, low-cost flexibility options (e.g., controlled charging of electric vehicles or demand side management). Nevertheless, in the H2 scenario, investments into lithium-ion batteries are also surprising: instead of the expected hydrogen storage tanks, lithium-ion batteries appear as an attractive short-term option to complement the long-term hydrogen technologies.
Clearly, the most significant investments into CSP plants happen in the CSP and CSP&H2 scenarios. Here, electricity from CSP plants is imported from North Africa. However, CSP is also present in the other scenarios (H2 and Base) where it serves to cover local electricity demand in Southern Europe and North Africa (as a result of modeling step 1).
For CO2 emissions, H2 scenarios produce higher emissions reaching 662 Mio. t. This effect is due to the additional electricity demand from hydrogen technologies, which cannot be fully covered by emission-free power generation under the assumptions of the scenario. Instead, hydrogen is produced from “gray electricity,” a significant fraction of which comes from gas power plants. In contrast with the H2 scenario, solar power imports reduce emissions by 15% and 22% for scenarios CSP&H2 and CSP, respectively.
The required grid investments are the lowest in the base case and gradually grow in the CSP and CSP&H2 scenarios. The H2 scenario triggers 15% more transmission infrastructure to connect the spatially distributed caverns across Europe. In the CSP scenario, the 30% higher demand of transmission is due to enabling solar power import from North Africa. Finally, the massive deployment of H2 and CSP combines both balancing requirements, peaking at 80% of more transmission systems than for the base case.
For grid preference scenarios, the right panel of Figure 6 shows that three alternative configurations exist for load balancing:
1. Trend (black). Unrestricted grid expansion allows for full integration of power generation from wind and PV, whereas the need for gas power plants and cavern storage is relatively low. Lithium-ion batteries and curtailment are absent, and the CO2 emissions remain in the desired range.
2. Smart (yellow). Restrictions on grid expansion are compensated by a broad spectrum of additional measures—more capacities from wind turbines, PV, caverns, lithium-ion batteries, and pumped hydroplants across all scenarios. Curtailed renewable energy is high (3%). CO2 emissions are similar to those in Trend but at 1.5%–2.5% higher total system costs (Supplementary Table S15 of the Supplementary Material).
3. Protest (red). Restrictions on grid expansion and the exclusion of large-scale storage lead to more gas power plants. Consequently, emissions miss the −85% target.
These characteristic relations of the different indicators occur not only for the CSP&H2 scenario but also for the grid acceptance scenarios (Trend, Smart, and Protest) if combined with the other narratives (Base, CSP, or H2). For this reason, the corresponding plots are not reported.
To summarize this subsection, the results indicate that transmission expansion is a significant constituent of all scenarios. If new transmission is implemented at significantly higher specific costs (Smart), less transmission is deployed. This is compensated by the installation of alternative flexibility options—especially all types of storage—leading to higher costs and curtailments. If other large-scale projects, including caverns, are also avoided (Protest), the amount of transmission remains constant, with the flexibility provided only by gas technologies. Massively deploying CSP plants for imports and including a hydrogen economy call for larger transmission systems. If the system evolves toward the latter, higher system costs and additional CO2 emissions (for renewable shares below 100%) are to be expected. For combined solar import and hydrogen futures, those emissions can be reduced, at the cost of a peak in the demand for grid expansion.
This subsection evaluates how three different approaches for power flow modeling (transport model, DC power flow, and PTDF) affect the investment decisions and system operation of a spatially aggregated ESOM. In addition, a fourth scenario (PTDF_LC) tests how widely differing cost estimates affect the expansion of grid transfer capabilities (as described in Costs for Expanding Cross-Border Transmission Lines).
Figure 7 shows the resulting key indicators (as presented in Power Transmission in Future Energy Systems as a Function of Technological Preferences) for the different grid modeling approaches (using 85% Base as the underlying scenario). In the Supplementary Material, Table S12 provides the corresponding numerical values. It is striking that, except for investments in grid expansion and pumped hydro, all curves have almost the same shape. Grid investments change by around 5% when using constant length-specific investment costs (as in transport model, DC power flow, and PTDF), whereas the impact on the other indicators is negligible (deviations below 1%). These findings also hold in scenarios with a 55% reduction target (not shown here). Although grid investment is expected to be affected, it is surprising that the other indicators are relatively unaffected.
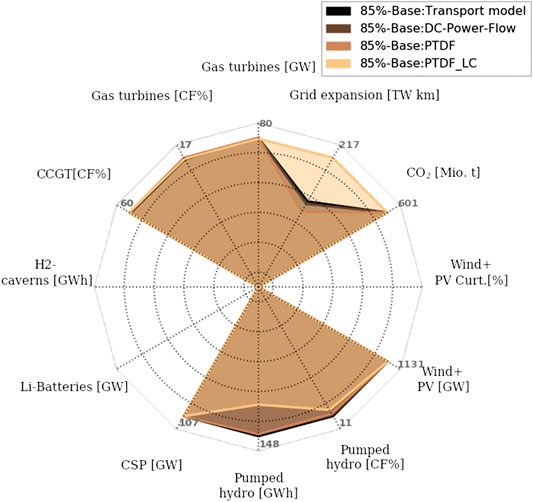
FIGURE 7. Key indicators comparing 85% Base scenarios using different approaches for modeling power flows.
The most significant differences occur for PTDF_LC. Recall that we switch here from simple length-specific to line-specific investment costs. For most of the candidate transmission lines, this decreases the costs, which explains the additional grid expansion. This is because only the costs of upgrading the transmission link between the two nearest substations of cross-border transmission lines are taken into account, whereas any follow-up costs for upgrading feeder lines are completely ignored. Conversely, for length-specific costs (applied to all other scenarios as shown in Figure 7), this aspect is approximated by estimating the length of modeled transmission lines as the distances between regional centers.
Remarkably, the significant grid expansion in PTDF_LC displaces only 30 GWh of pumped hydropower plants in Spain (note that the location cannot be read from the figure).
Based on the observations above, most system-wide indicators are not affected by the way power flows are modeled. In addition, Figure 8 provides additional insight into the spatial distribution of grid expansion. (Please refer to Supplementary Tables S13 and S14 at the Supplementary Material to inspect the corresponding numerical outputs.) It details the grid investments for the majority of analyzed scenarios (horizontal axis) and countries (vertical axis). The marker size is proportional to the ratio of grid investments to system costs for the different scenario sets. The left group of scenarios focuses on different grid modeling, whereas the right group focuses on scenarios involving technology preferences (scenario sets 2a and 2b).
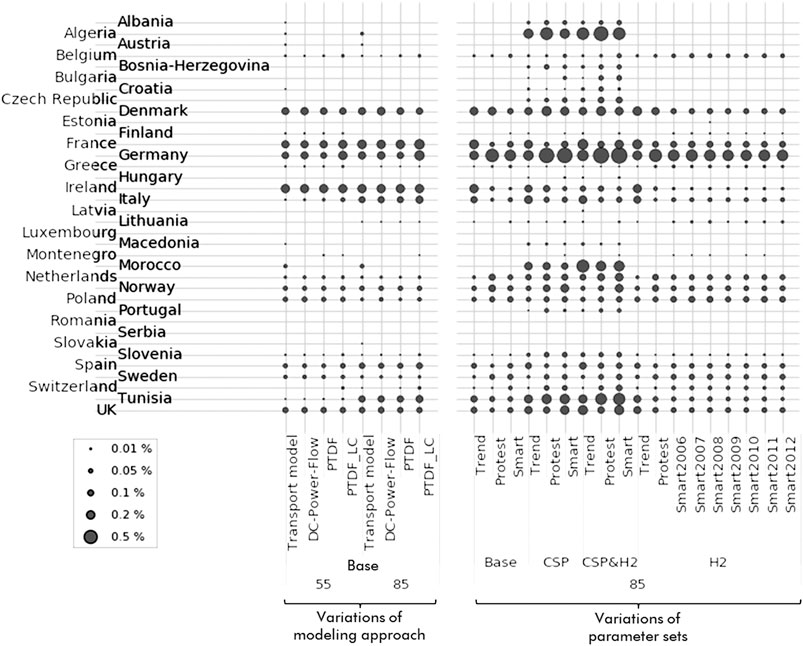
FIGURE 8. Investments into transmission infrastructures relative to total system costs across all scenarios and countries considered.
The left group of Figure 8 shows that grid investments are virtually constant for all power flow models (transport model, DC power flow, PTDF) and cost assumptions (PTDF_LC). Only small differences appear when using the transport model compared with the more complex (and restrictive) counterparts. This confirms what we found earlier: the approach for modeling power flows only slightly affects the final recommendations derivable from a spatially aggregated ESOM. This holds for both -55% and -85% emission targets.
These deviations are even more insignificant when compared with the scenarios on the right side of Figure 8, which show that the technology scenarios have a larger impact. Here, differences in regional grid investments occur because of solar power imports since these are directly related to new HVDC lines for point-to-point power transmission lines from North Africa to Europe. Furthermore, variations in weather input data from 2006 to 2012 (H2:Smart) make no differences in grid investments. In average, the share of grid investments for all European countries is 1.5% (standard deviation: 0.4%) of total system costs. In other words, the grid investments are fairly robust against variations in renewable power generation over several annual periods.
To summarize, the results indicate that the three different methods of determining the distribution of power flows (transport model, DC power flow, PTDF) result in negligible differences in most of the key indicators evaluated. However, investment in power transmission does change if line-specific costs are used as opposed to length-specific costs. In contrast, technology preference scenarios have a much greater impact on the spatial distribution of transmission investments.
New transmission infrastructure significantly contributes to system adequacy which is measured as the reduction of required backup capacity. Transmission investments at least double storage investments. Nevertheless, storage is still needed in all scenarios, which confirms the complementarity of these two technologies. However, even when using other flexibility options (including sector coupling), investing in transmission is more cost-efficient for all scenarios evaluated. These findings are in line with Brown et al. (2018), who also concluded that electricity transmission is a robust measure of cost-efficient energy supply across many scenarios. The present results are also consistent with those of former REMix applications which—although based on an even coarser spatial resolution—identified overall grid expansion needs between 60 and 331 TW km (Gils et al., 2017a) and a certain interchangeability of power transmission and energy storage (Cebulla et al., 2017). This dualism becomes clear when considering, for example, the balancing needs of daily PV power production. Surpluses can be either temporally shifted to serve later for local load coverage or fostered by the wide horizontal extent of the European energy system, spatially shifted to another time zone because they better match remote power consumption patterns. This smoothing effect, which becomes more prominent with the size of well-interconnected regions, is also reported by Huber et al. (2014), who showed that scenarios with high shares of wind energy particularly benefit from strong pan-European cooperation supported by sufficient power transmission infrastructure. Nevertheless, in practice, this faces non-economic challenges such as legal, political, or social barriers that make it difficult to reach the cost-optimal solution (Caldés et al., 2018).
This study contributes to a better understanding of some of the barriers mentioned before by incorporating possible restrictions on grid expansion in the scenarios (in particular, scenario sets 2a and 2b in Table 1). If grid expansion is restricted or rather unattractive in terms of technology costs, the demand for both additional power generators and alternative load-balancing technologies grows substantially. Without prominent grid expansion (Smart scenarios), load-balancing capabilities are mainly provided by a combination of additional renewable power generation and short-term (lithium-ion batteries), mid-term (pumped hydroplants), and long-term (salt caverns) storage facilities. On average, this leads to an increase of 2% in system costs (when comparing Trend vs. Smart, Supplementary Material). This rather moderate increase—note that varying weather years could lead to cost differences greater than 4%—appears plausible in view of the study of Schmid and Knopf (2015), who reported 2% and 3.5% difference in system costs when comparing model results with and without grid expansion. Schmid and Knopf justified this with a flat optimum of the underlying cost minimization. Although relative cost savings of 1% translate into absolute differences of several billions of euros, in a European context, striving for less grid expansion could be an option if it comes with beneficial effects (e.g., on the residual impacts; Introduction). To further analyze such system configurations, Neumann and Brown (2020) used an approach called “Modeling to Generate Alternatives.” Within defined deviations from the cost minimum, the total power generation capacity of different technologies is taken as the objective value for a subsequent energy system optimization. The authors find that a multitude of technological alternatives appears already for small cost deviations. Thus, minimizing grid expansion in this manner and additionally evaluating non-technoeconomic indicators present an opportunity for methodological improvements in future research on technological preferences.
This is especially interesting for further investigating the impacts of disruptive energy supply strategies. According to the present results, a successful deployment of CSP systems dedicated to solar imports from North Africa calls for larger transmission systems but reduces the need for flexibility in the European power system. Significant grid expansion is also observed when building large hydrogen infrastructures. These are associated with high additional electricity demand, higher system costs, and additional CO2 emissions. The challenge becomes far greater if a much stricter CO2 mitigation target than used herein (−85%) is to be achieved because concepts for carbon-free long-term energy storage or road transport and air traffic often rely on so-called green hydrogen. However, as stated by Sgobbi et al. (2016), the presence of hydrogen in the energy scenarios does not automatically lead to decarbonization. According to our results, one option for achieving this is to combine solar imports with a hydrogen economy.
As shown in the section Power Transmission in Future Energy Systems as a Function of Technological Preferences, replacing gas-fired backup generation by implementing a broad spectrum of flexibility options contributes significantly to GHG mitigation. Moreover, this means that the dependency on natural gas imports can be reduced. In this sense, renewable power imports and green hydrogen also play an important role. In Contribution of Power Transmission and Other Flexibility Options to System Cost and Adequacy, we see replacing natural gas with hydrogen from domestic resources is not the most affordable solution. Just like scenarios that consider imports of green hydrogen (which, however, are beyond the scope of this study), solar power imports offer the opportunity to diversify import dependencies. Despite their remarkably high technology-specific investment needs for power transmission and the associated implications and challenges in terms of a multitude of presumably involved stakeholders, scenarios that rely on solar power imports from CSP plants make a positive impact on system adequacy. Current TYNDP 2020 scenarios, however, remain dominated by gas imports from Russia and Norway and (decarbonized) liquid natural gas (ENTSO-E and ENTSO-G, 2020). Accordingly, we recommend to more seriously consider in scenario construction energy imports from geographical regions that are rich in renewable energy resources.
When using different approaches for power flow modeling within our energy system optimization model (i.e., transport model, DC power flow, or power transfer distribution factors gathered from the preceding AC power flow simulations), the interconnected regions mostly represent countries. For this, the resulting investments in transmission infrastructure are fairly robust. The corresponding mix of load-balancing technologies also changes only minimally. In consequence, how the power flow distribution is modeled does not matter, at least for the geographical scope (Europe) and the spatial resolution (one node per country) under consideration. This result particularly counters the hypothesis of Schmid and Knopf (2015), who hypothesize that the difference between power flow modeling with PTDFs and a capacity-constrained transport model is the cause for large differences in cost savings from grid expansion. According to our results, this is not the case. However, the method for selecting representative snapshots from the real grid operations applied herein offers starting points to relativize our results. In this context, the question arises of whether our observations remain if we take into account extraordinary grid operation points, for instance, when operation limits can be temporally exceeded.
The present study emphasizes the societal preferences in impacts on shaping low-carbon energy systems. This is considered in our model-based scenario analysis by full or partial implementation of grid expansion measures according to the TYNDP 2016, technology cost increases due to a switch to underground cables and various restrictions on the availability of large-scale infrastructures (e.g. cavern storage). However, societal risks and other obstacles also bar the way of a successful implementation of the energy transition, and these are ignored by the model choice. According to Battaglini et al. (2012), these are, for example, inconsistent and uncertain regulatory and legal frameworks or competing national interests and uncoordinated planning processes. Conversely, the use of an ESOM already implies perfect information and control from the perspective of the so-called social planner. Furthermore, the chosen method of the static target system planning based on individual scenario years is extremely limited in its ability to capture the effects of delayed project implementations. The use of a multiyear model would help to consider such delays when planning the system. Conceivable approaches for this would be stochastic or robust optimization (Sauma et al., 2015).
Another limitation of using a spatially aggregated ESOM, such as REMix, is that transmission bottlenecks cannot be fully captured. This averages the variability from renewables, leading to an underestimation of the real balancing needs. Compared with models dedicated to power flow analysis, the spatial resolution is low in the ESOM applied for the present study. In other words, the present approach is significantly more abstract, which affects the distribution of power flows, and thus, the capability of capturing the real demand for exchanging power surpluses and deficits. To overcome this issue, planning tools with increasing spatial resolutions are being developed (Hörsch et al., 2018), but with the associated drawback of requiring tremendous amounts of geo-referenced data inputs and a large computational effort. While the trend to publishing more openly available datasets offers a solution to the former challenge, recent efforts on the development of open-source solvers for high performance computers (e.g., PIPS-IPM++ (Breuer et al., 2018)) are a promising solution for the latter.
This study examined the role of power transmission in the future energy system of Europe. To do this, we conducted a multiscenario analysis using an advanced energy system optimization model (REMix). Table 5 summarizes the main research questions, key results, and corresponding policy implications.
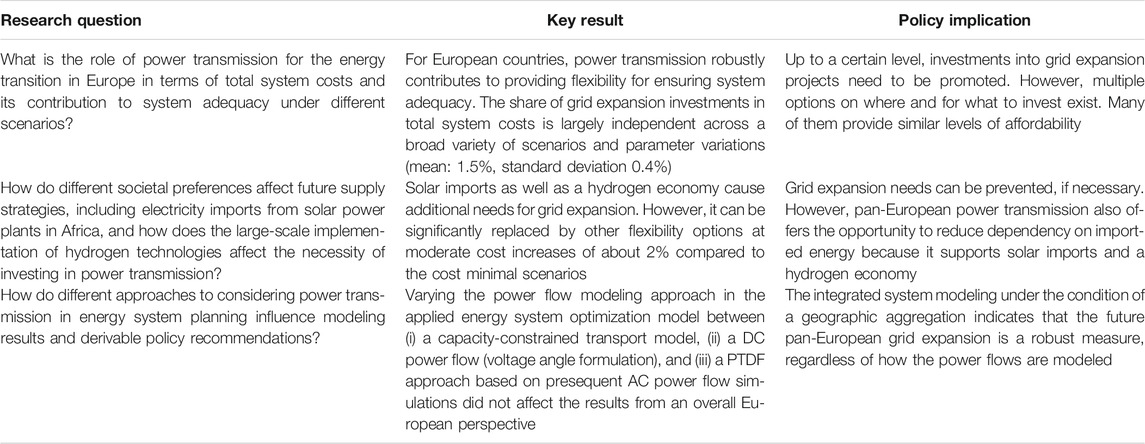
TABLE 5. Research questions, key results, and policy implications of this study.
In this sense, we first investigated the contribution of a wide range of flexibility options, including in particular new transmission lines, for securing load coverage in low-carbon energy systems. The results indicate that the possibility of investing in flexibility options ensures a constant level of system adequacy at reasonable costs. However, a dominant share of the investments must be spent on grid expansion measures.
Second, we evaluated societal preferences for future energy systems, paying a special attention to the identified grid expansion needs, thereby obtaining a set of indicators that describe the overall system performance. In the different scenarios, we considered delayed realizations of infrastructure projects and the corresponding cost increases in addition to disruptive energy supply strategies (hydrogen economy and solar power imports). The results showed that, despite reducing grid expansion at the local level, a hydrogen economy combined with solar imports result in additional investment requirements for pan-European power transmission. Nevertheless, grid expansion could always be reduced to a certain threshold by combining additional electricity generation and storage, albeit with negative effects on system costs and GHG reduction.
Third, we assessed three available approaches to model power flows in linear optimization models. Varying the appropriate constraints and data inputs in our energy system optimization model resulted in essentially negligible changes in the overall system performance. However, this may be due to the still-existing model simplifications, such as insufficient spatial resolution. For this reason, we recommend future research to model applications that allow the investigation of sector-coupled energy systems, while also considering restrictions and costs resulting from infrastructure project implementations on the local level. Other obvious directions for future research include the evaluation of scenarios with more stringent GHG mitigation targets and sustainability indicators that consider more than just emissions. Another crucial question to answer is where to prevent or promote grid expansion measures. Nevertheless, the present results clearly indicate the usefulness of investments into pan-European power transmission infrastructure, whether it be a few expensive power transmission infrastructure projects or numerous more affordable ones.
Almost all datasets generated for this study are included in the article/Supplementary Material. Further datasets will be made available by the authors, without undue reservation, to any qualified researcher.
TP was responsible for the conceptualization, funding acquisition and project administration. K-KC contributed to the conceptualization and design, model application, and software development, conducted the formal analysis and visualization. JH contributed to the formal analysis. K-KC and TP prepared the model input data and were responsible for data curation. HL was responsible for the AC grid modeling and PTDF methodology. K-KC, TP, JH, and HL wrote the original draft. All authors contributed to manuscript revision, read and approved the submitted version.
This research is part of the project INTEEVER—Analysis of infrastructural options to integrate renewable energies in Germany and Europe considering security of supply. It was funded by the German Federal Ministry for Economic Affairs and Energy under grant numbers FKZ 03ET4020 A and FKZ 03ET4020B.
Frontiers Media SA remains neutral with regard to jurisdictional claims in published maps and institutional affiliations.
The authors declare that the research was conducted in the absence of any commercial or financial relationships that could be construed as a potential conflict of interest.
We thank our colleague Hans Christian Gils for contributing to the development and initial implementation of the REMix model used for modeling step 1. We also thank Tobias Naegler for his fruitful feedback and Yvonne Scholz for model maintenance during the parental leave of K-KC. Special thanks go to Manuel Wetzel for his all-time readiness to comment on preliminary results and visualization strategies. We also appreciate the support of Benjamin Schober who implemented the computation of the PTDF matrices. Furthermore, we would like to thank our project partners from Fraunhofer Institute for Energy Economics and Energy System Technology (IEE), Business Field Grid Planning and Operation, for their helpful comments. Finally, the authors gratefully acknowledge the Gauss Center for Supercomputing e.V. (www.gauss-centre.eu) for providing computing time through the John von Neumann Institute for Computing (NIC) on the GCS Supercomputers JURECA and JUWELS at Jülich Supercomputing Center (JSC).
The Supplementary Material for this article can be found online at: https://www.frontiersin.org/articles/10.3389/fenrg.2020.541495/full#supplementary-material.
ACER (2019). Consolidated report on the progress of electricity and gas projects of common interest. Available at: https://www.acer.europa.eu/Official_documents/Acts_of_the_Agency/Publication/CONSOLIDATED%20REPORT%20ON%20THE%20PROGRESS%20OF%20ELECTRICITY%20AND%20GAS%20%20PROJECTS%20OF%20COMMON%20INTEREST%20-%202019.pdf (Aceessed July 09 2020).
Anuta, O. H., Taylor, P., Jones, D., McEntee, T., and Wade, N. (2014). An international review of the implications of regulatory and electricity market structures on the emergence of grid scale electricity storage. Renew. Sustain. Energy Rev. 38, 489–508. doi:10.1016/j.rser.2014.06.006
Battaglini, A., Komendantova, N., Brtnik, P., and Patt, A. (2012). Perception of barriers for expansion of electricity grids in the European Union. Energy Pol. 47, 254–259. doi:10.1016/j.enpol.2012.04.065
Benasla, M., Hess, D., Allaoui, T., Brahami, M., and Denaï, M. (2019). The transition towards a sustainable energy system in Europe: what role can North Africatextquotesingles solar resources play? Energy Strategy Rev. 24, 1–13. doi:10.1016/j.esr.2019.01.007
Bertsch, V., Hall, M., Weinhardt, C., and Fichtner, W. (2016). Public acceptance and preferences related to renewable energy and grid expansion policy: empirical insights for Germany. Energy. 114, 465–477. doi:10.1016/j.energy.2016.08.022
Billinton, R., and Allan, R. N. (1988). Reliability assessment of large electric power systems. Berlin, Germany: Springer Science + Business Media. doi:10.1007/978-1-4613-1689-3
Breuer, T., Bussieck, M., Cao, K.-K., Cebulla, F., Fiand, F., Gils, H. C., et al. (2018). “Optimizing large-scale linear energy system problems with block diagonal structure by using parallel interior-point methods,” in Operations research proceedings 2017. Editors N. Kliewer, J. F. Ehmke, and R. Borndörfer (Manhattan, NY: Springer International Publishing). doi:10.1007/978-3-319-89920-6
Brown, T., Schlachtberger, D., Kies, A., Schramm, S., and Greiner, M. (2018). Synergies of sector coupling and transmission reinforcement in a cost-optimised, highly renewable European energy system. Energy. 160, 720–739. doi:10.1016/j.energy.2018.06.222
Bruninx, K., Orlic, D., Couckuyt, D., Grisey, N., Betraoui, B., Franck, N. T., et al. (2014). E-highway2050: D2. 1 Data sets of scenarios for 2050. Available at: http://www.e-highway2050.eu/fileadmin/documents/Results/e-Highway_database_per_country-08022016.xlsx. (Accessed November 28, 2016).
Caldés, N., Río, P. del., Lechón, Y., and Gerbeti, A. (2018). Renewable energy cooperation in Europe: what next? Drivers and barriers to the use of cooperation mechanisms. Energies. 12, 70. doi:10.3390/en12010070
Cao, K.-K., Cebulla, F., Gómez Vilchez, J. J., Mousavi, B., and Prehofer, S. (2016). Raising awareness in model-based energy scenario studies –a transparency checklist. Ener. Sustain. Soc. 6, 28. doi:10.1186/s13705-016-0090-z
Cao, K.-K., Metzdorf, J., and Birbalta, S. (2018). Incorporating power transmission bottlenecks into aggregated energy system models. Sustainability. 10, e1916. doi:10.3390/su10061916
Cao, K.-K., Pregger, T., Scholz, Y., Gils, H. C., Nienhaus, K., Deissenroth, M., et al. (2019). Analysis of infrastructural options to integrate renewable energies in Germany and Europe considering security of supply (INTEEVER). Berlin. Germany: Federal Ministry for Economic Affairs and Energy.
Cebulla, F., Haas, J., Eichman, J., Nowak, W., and Mancarella, P. (2018). How much electrical energy storage do we need? A synthesis for the U.S., Europe, and Germany. J. Clean. Prod. 181, 449–459. doi:10.1016/j.jclepro.2018.01.144
Cebulla, F., Naegler, T., and Pohl, M. (2017). Electrical energy storage in highly renewable European energy systems: capacity requirements, spatial distribution, and storage dispatch. Journal of Energy Storage. 14, 211–223. doi:10.1016/j.est.2017.10.004
Dena (2010). dena-Netzstudie II. Integration erneuerbarer Energien in die deutsche Stromversorgung im Zeitraum 2015–2020 mit Ausblick 2025. Berlin, Germany: Deutsche Energieagentur.
Deutsches Zentrum fuer Luft- und Raumfahrt, e. V. (2016). EOC’s EOWEB Portal. Available at: https://eoweb.dlr.de/egp/. (Accessed November 9, 2016).
ENTSO-E (2016a). Historical data (until December 2015), Consumption data: hourly load values 2006–2015. Available at: https://docstore.entsoe.eu/Documents/Publications/Statistics/Monthly-hourly-load-values_2006-2015.xlsx. (Accessed August 6, 2016).
ENTSO-E (2016b). Ten-year network development plan 2016 executive report. Available at: https://tyndp.entsoe.eu/2016/exec-report/ (Accessed December 12, 2018).
ENTSO-E (2018). 2nd ENTSO-E guideline for cost benefit analysis of grid development projects. Available at: https://tyndp.entsoe.eu/Documents/TYNDP%20documents/Cost%20Benefit%20Analysis/2018-10-11-tyndp-cba-20.pdf. (Accessed October 16, 2019).
ENTSO-E, and ENTSO-G (2020). TYNDP 2020 scenario report. Available at: https://www.entsos-tyndp2020-scenarios.eu/wp-content/uploads/2020/06/TYNDP_2020_Joint_ScenarioReport_final.pdf. (Accessed October 1, 2020).
ENTSO-E (2015a). Project list TYNDP2016 assessments: reference capacities. Available at: https://www.entsoe.eu/_layouts/15/WopiFrame.aspx?sourcedoc=/Documents/TYNDP%20documents/TYNDP%202016/rgips/Project%20list%20TYNDP2016%20assessments.xlsx&action=default .(Accessed June 29, 2018).
ENTSO-E (2015b). TYNDP 2016 market modelling data. Available at: https://www.entsoe.eu/Documents/TYNDP%20documents/TYNDP%202016/rgips/TYNDP2016%20market%20modelling%20data.xlsx. (Accessed June 14, 2016).
Fan, H., and Cheng, H. (2009). Transmission network expansion planning with security constraints based on bi-level linear programming. Eur. Trans. Electr. Power. 19, 388–399. doi:10.1002/etep.224
Feix, O., Obermann, R., Strecker, M., and Brötel, A. (2012). Netzentwicklungsplan strom 2012: zweiter überarbeiteter entwurf der Übertragungsnetzbetreiber.
Feix, O., Wiede, T., Strecker, M., and König, R. (2015). Netzentwicklungsplan strom 2025: erster entwurf der Übertragungsnetzbetreiber. 50 Hertz transmission GmbH, amprion GmbH, TenneT TSO. GmbH. Available at: http://www.netzentwicklungsplan.de/netzentwicklungsplan-2025-version-2015-erster-entwurf. (Accessed December 22, 2015).
Gils, H. C. (2015). “Balancing of intermittent renewable power generation by demand response and thermal energy storage.” in Energy Systems Conference, London, UK, June 2015. doi:10.18419/opus-6888
Gils, H. C., Pregger, T., Flachsbarth, F., Jentsch, M., and Dierstein, C. (2019). Comparison of spatially and temporally resolved energy system models with a focus on Germanytextquotesingles future power supply. Appl. Energy. 255, 113889. doi:10.1016/j.apenergy.2019.113889
Gils, H. C., Scholz, Y., Pregger, T., Tena, D. L. de., and Heide, D. (2017a). Integrated modelling of variable renewable energy-based power supply in Europe. Energy. 123, 173–188. doi:10.1016/j.energy.2017.01.115
Gils, H. C., Simon, S., and Soria, R. (2017b). 100% renewable energy supply for Brazil—the role of sector coupling and regional development. Energies. 10, 1859. doi:10.3390/en10111859
Haas, J., Cebulla, F., Cao, K.-K., Nowak, W., Palma-Behnke, R., Rahmann, C., et al. (2017). Challenges and trends of energy storage expansion planning for flexibility provision in low-carbon power systems—a review. Renew. Sustain. Energy Rev. 80, 603–619. doi:10.1016/j.rser.2017.05.201
Hagspiel, S., Jaegemann, C., Lindenberger, D., Brown, T., Cherevatskiy, S., and Troester, E. (2014). Cost-optimal power system extension under flow-based market coupling. Energy. 66, 654–666. doi:10.1016/j.energy.2014.01.025
Hörsch, J., Hofmann, F., Schlachtberger, D., and Brown, T. (2018). PyPSA-Eur: an open optimisation model of the European transmission system. Energy Strategy Rev. 22, 207–215. doi:10.1016/j.esr.2018.08.012
Huber, M., Dimkova, D., and Hamacher, T. (2014). Integration of wind and solar power in Europe: assessment of flexibility requirements. Energy. 69, 236–246. doi:10.1016/j.energy.2014.02.109
IEA, (2014). Energy balances of OECD countries. Paris, France: International Energy Agency (IEA). 2014 Edn.
Intergovernmental Panel on Climate Change (2006). 2006 IPCC guidelines for national greenhouse gas inventories. Available at: http://www.ipcc-nggip.iges.or.jp/EFDB/find_ef_s1.php. (Accessed October 7, 2016).
Leuthold, F., Weigt, H., and Von Hirschhausen, C. (2008). ELMOD-a model of the European electricity market.
Marinakis, A., Evrenosoglu, C. Y., Oudalov, A., Knezovic, K., and Belinchon, P. (2018). “Role of transmission expansion and energy storage in the context of scenarios with high shares of variable renewables,” 15th international Conference on the European energy market (EEM). Lodz, Poland, June 2018, (IEEE). doi:10.1109/eem.2018.8469767
Michalski, J., Bünger, U., Crotogino, F., Donadei, S., Schneider, G.-S., Pregger, T., et al. (2017). Hydrogen generation by electrolysis and storage in salt caverns: potentials, economics and systems aspects with regard to the German energy transition. Int. J. Hydrogen Energy. 42, 13427–13443 doi:10.1016/j.ijhydene.2017.02.102
Neukirch, M. (2016). Protests against German electricity grid extension as a new social movement? A journey into the areas of conflict. Energy, Sustainability and Society. 6, 4. doi:10.1186/s13705-016-0069-9
Neumann, F., and Brown, T. (2020). The near-optimal feasible space of a renewable power system model. Electr. Power Syst. Res. 190, 106690. doi:10.1016/j.epsr.2020.106690
Nitsch, J., Pregger, T., Naegler, T., Heide, D., Trieb, F., Scholz, Y., et al. (2012). Langfristszenarien und Strategien für den Ausbau der erneuerbaren Energien in Deutschland bei Berücksichtigung der Entwicklung in Europa und global. Bundesministerium für Umwelt. Rohtak, Haryana: Naturschutz und Reaktorsicherheit (BMU).
Noack, C., Burggraf, F., Hosseiny, S. S., Lettenmeier, P., Kolb, S., Belz, S., et al. (2014). Studie über die Planung einer Demonstrationsanlage zur Wasserstoff-Kraftstoffgewinnung durch Elektrolyse mit Zwischenspeicherung in Salzkavernen unter Druck. Berlin, Germany: Bundesministerium für Wirtschaft und Energie (BMWi).
Open Power System Data (2017). Data package time series. Available at: https://data.open-power-system-data.org/time_series/2017-07-09. Version 2017-07-09https://data.open-power-system-data.org/time_series/2017-07-09.
Pregger, T., Luca de Tena, D., O’Sullivan, M., Roloff, N., Schmid, S., Propfe, B., et al. (2012). Perspektiven von Elektro-/Hybridfahrzeugen in einem Versorgungssystem mit hohem Anteil dezentraler und erneuerbarer Energiequellen. Available at: http://elib.dlr.de/77130/. (Accessed August 6, 2016).
Pregger, T., Nitsch, J., and Naegler, T. (2013). Long-term scenarios and strategies for the deployment of renewable energies in Germany. Energy Policy. 59, 350–360. doi:10.1016/j.enpol.2013.03.049
Quintero, J., Zhang, H., Chakhchoukh, Y., Vittal, V., and Heydt, G. T. (2014). Next generation transmission expansion planning framework: models, tools, and educational opportunities. IEEE Trans. Power Syst. 29, 1911–1918. doi:10.1109/TPWRS.2014.2317590
Sauma, E., Traub, F., and Vera, J. (2015). A Robust optimization approach to assess the effect of delays in the connection-to-the-grid time of new generation power plants over transmission expansion planning. Ann. Oper. Res. 229, 703–741. doi:10.1007/s10479-015-1833-5
Schaber, K., Steinke, F., and Hamacher, T. (2012). Transmission grid extensions for the integration of variable renewable energies in Europe: who benefits where? Energy Pol. 43, 123–135. doi:10.1016/j.enpol.2011.12.040
Schlachtberger, D. P., Brown, T., Schramm, S., and Greiner, M. (2017). The benefits of cooperation in a highly renewable European electricity network. Energy. 134, 469–481. doi:10.1016/j.energy.2017.06.004
Schmid, E., and Knopf, B. (2015). Quantifying the long-term economic benefits of European electricity system integration. Energy Pol. 87, 260–269. doi:10.1016/j.enpol.2015.09.026
Schneider, T., and Battaglini, A. (2013). Efficiency and public acceptance of European grid expansion projects: lessons learned across Europe. Renewable Energy Law and Policy Review. 4, 42–51.
Scholz, Y. (2012). Renewable energy based electricity supply at low costs: development of the REMix model and application for Europe., Stuttgart, Germany: University of Stuttgart, 12, 181 doi:10.18419/opus-2015
Scholz, Y., Gils, H. C., and Pietzcker, R. C. (2017). Application of a high-detail energy system model to derive power sector characteristics at high wind and solar shares. Energy Econ. 64, 568–582. doi:10.1016/j.eneco.2016.06.021
Scholz, Y., Gils, H. C., Pregger, T., Heide, D., Cebulla, F., Cao, K.-K., et al. (2014). Möglichkeiten und Grenzen des Lastausgleichs durch Energiespeicher, verschiebbare Lasten und stromgeführte KWK bei hohem Anteil fluktuierender erneuerbarer Stromerzeugung. Available at: http://elib.dlr.de/93240/. (Accessed June 18, 2016).
Schönfelder, M., Eßer-Frey, A., Schick, M., Fichtner, W., Heuveline, V., and Leibfried, T. (2012). New developments in modeling network constraints in techno-economic energy system expansion planning models. Z. Energiewirtschaft. 36, 27–35. doi:10.1007/s12398-011-0067-8
Seidl, H., and Heuke, R. (2014). Technologieübersicht. Das deutsche Höchstspannungsnetz: technologien und Rahmenbedingungen. Berlin, Germany: Deutsche Energie-Agentur GmbH.
Sgobbi, A., Nijs, W., Miglio, R. D., Chiodi, A., Gargiulo, M., and Thiel, C. (2016). How far away is hydrogen? Its role in the medium and long-term decarbonisation of the European energy system. Int. J. Hydrogen Energy. 41, 19–35. doi:10.1016/j.ijhydene.2015.09.004
Sharpton, T., Lawrence, T., and Hall, M. (2020). Drivers and barriers to public acceptance of future energy sources and grid expansion in the United States. Renew. Sustain. Energy Rev. 126, 109826. doi:10.1016/j.rser.2020.109826
Singh, A., Willi, D., Chokani, N., and Abhari, R. S. (2014). Optimal power flow analysis of a Switzerlands transmission system for long-term capacity planning. Renew. Sustain. Energy Rev. 34, 596–607. doi:10.1016/j.rser.2014.03.044
Steinke, F., Wolfrum, P., and Hoffmann, C. (2013). Grid vs. storage in a 100% renewable Europe. Renew. Energy. 50, 826–832. doi:10.1016/j.renene.2012.07.044
Stott, B., and Alsac, O. (1974). Fast decoupled load flow. IEEE Trans. Power Syst. PAS. 93, 859–869. doi:10.1109/TPAS.1974.293985
Trieb, F., Schillings, C., Pregger, T., and O’Sullivan, M. (2012). Solar electricity imports from the Middle East and North Africa to Europe. Energy Pol. 42, 341–353. doi:10.1016/j.enpol.2011.11.091
Vafeas, A., Pagano, T., and Peirano, E. (2014). E-HIGHWAY 2050: modular development plan of the pan-European transmission system 2050 - technology assessment from 2030 to 2050. Available at: http://www.e-highway2050.eu/fileadmin/documents/Results/D3_1_Technology_assessment_from_2030_to_2050.pdf .(Accessed June 10, 2016).
Zerrahn, A., and Schill, W.-P. (2017). Long-run power storage requirements for high shares of renewables: review and a new model. Renew. Sustain. Energy Rev. 79, 1518–1534. doi:10.1016/j.rser.2016.11.098
Keywords: European energy scenarios, DC power flow, decarbonization, system adequacy, energy system optimization modeling, green hydrogen, solar power imports
Citation: Cao K-K, Pregger T, Haas J and Lens H (2021) To Prevent or Promote Grid Expansion? Analyzing the Future Role of Power Transmission in the European Energy System. Front. Energy Res. 8:541495. doi: 10.3389/fenrg.2020.541495
Received: 09 March 2020; Accepted: 30 November 2020;
Published: 09 February 2021.
Edited by:
Sgouris Sgouridis, Masdar Institute of Science and Technology, United Arab EmiratesReviewed by:
Nadejda Komendantova, International Institute for Applied Systems Analysis (IIASA), AustriaCopyright © 2021 Cao, Pregger, Haas and Lens. This is an open-access article distributed under the terms of the Creative Commons Attribution License (CC BY). The use, distribution or reproduction in other forums is permitted, provided the original author(s) and the copyright owner(s) are credited and that the original publication in this journal is cited, in accordance with accepted academic practice. No use, distribution or reproduction is permitted which does not comply with these terms.
*Correspondence: Karl-Kiên Cao, a2FybC1raWVuLmNhb0BkbHIuZGU=
Disclaimer: All claims expressed in this article are solely those of the authors and do not necessarily represent those of their affiliated organizations, or those of the publisher, the editors and the reviewers. Any product that may be evaluated in this article or claim that may be made by its manufacturer is not guaranteed or endorsed by the publisher.
Research integrity at Frontiers
Learn more about the work of our research integrity team to safeguard the quality of each article we publish.