 Lin Tao Tian
 Haifeng Gu*
- Nuclear Safety and Simulation Technology Key Laboratory of National Defense Disciplines, Harbin Engineering University, Harbin, China
Against the background of the natural deposition of erosols in containment under severe accident conditions, a relevant experimental facility was designed and constructed to study the decay constant of the natural deposition of erosols. TiO2 was used as the erosol medium, and the decay constant of erosols was studied. The results show that when erosol concentration is < 15,000/cm3, the decay constant of erosols increases with the increase of the particle size. However, when it is ≥ 15,000/cm3, because the agglomeration of small particles into larger particles accelerates the deposition of particles with smaller size, the decay constant of erosols decreases first and then increases with the increase of the particle size. In addition, the effect of electrostatic on the decay constant of the natural deposition of erosols was studied. When the electrostatic effect is present, the decay constant of erosols increases significantly. Finally, the natural deposition characteristics of erosols were obtained.
Introduction
During the course of a severe accident at a nuclear power plant (NPP), like a loss-of-coolant accident (LOCA), a large amount of radioactive fission product is released into containment in the form of gases, vapors, and erosols. Erosol is the main carrier of radioactive fission products. A large amount of radioactive erosols pose a huge threat to the external environment. Erosols are suspended solid or liquid particles which are very small and highly dispersed in gas. The behavior of erosols in containment mainly includes collision, agglomeration, condensation/evaporation, sedimentation, and so on. This complicated behavior makes it difficult to study the natural deposition behavior characteristics of erosols. In a traditional NPP, the containment spray system can remove most of the erosol suspended in the containment space by spray droplets. However, in the third generation of an advanced pressurized-water reactor (AP) series NPP, the spray system was removed and a passive containment cooling system (PCCS) was used to remove erosol (Fu et al., 2017). Simultaneously, in the event of station blackout (SBO), the nuclear power plant loses off-site power and this can lead to a severe accident (Li et al., 2014). If that happens, the concentration and distribution of erosols in containment are mainly dependent on natural deposition. Therefore, it is necessary to study the natural deposition characteristics of erosols in containment.
Four different mechanisms affect the natural deposition of erosols in containment; gravitational sedimentation, Brownian diffusion, diffusiophoresis, and thermophoresis (Powers and Washington/SNL, 2017). Gravitational sedimentation is related to the particle size of the erosol. The velocity of sedimentation of erosols increases with increasing particle size. Brownian diffusion mainly refers to the random motion of particles. The smaller the size of the erosol particle, the more obvious the Brownian diffusion effect is. Thermophoresis is caused by the temperature difference between the space and the wall in containment. The temperature difference causes the erosol particle to move from a high temperature zone to a low temperature zone. Diffusiophoresis is caused by the concentration gradient between the space and the wall in containment. The concentration gradient causes the erosol particle to move from a high concentration zone to a low concentration zone.
Some research has tackled the natural deposition of erosols in containment. The European Joint Center studied the effects of four mechanisms on the natural deposition of erosols with the help of GRACE (Snepvangers and Van De Vate, 1987). The effect of various mechanisms on the natural deposition of erosols have been obtained. The results showed that the thermophoresis increased with the increase of the temperature difference between the gas and the wall surface. However, polydisperse erosols have been used to analyze the entire erosol spectrum without considering the deposition of different particle sizes. Later, the Atomic Energy Institute (China) conducted similar experiments, the experimental results showed that diffusiophoresis increased with the increase of the vapor condensation rate on the wall. At the same time, the experimental containers of the experiments were relatively small. A. Kontautas (Kontautas and Urbonaviˇcius, 2009) studied the effects of erosol density and solubility on its natural deposition rate using a PHBEU facility. The result showed that the influence of the particle density on the deposition rate was not significant if the erodynamic mass median diameter was kept constant. A. Dehbi (Dehbi, 2004) used CFD particle tracking to predict erosol decay and deposition. The simulation results showed that 80–90% of the particle deposition occurred in the bottom section of containment, which was also consistent with experiments findings. J. M. Makynen (Yang and Jokiniemi, 1997) studied the effects of humidity on the natural deposition of erosols using an AHMED facility. Experiments were carried out by selecting erosols of different densities and different solubility. It was found that humidity had an effect on the natural deposition of erosols of different densities, and the natural deposition of hygroscopic erosols was more sensitive to humidity. In most studies, the agglomeration between particles and the effect of electrostatic interaction on the natural deposition of erosols were not considered. In other areas of research, Longbo Liu (Qiu et al., 2017) studied the effect of chamber erosol concentration on its natural settling. The results showed that when the erosol concentration was high and 104/cm3, the agglomeration between the erosols must be considered. Alvin C. K. Lai (Lai, 2006), in the background of an electrostatic precipitator, used the effect of an applied electric field to study the natural deposition of erosols. Their experiments showed that the presence of static electricity can affect the natural deposition of erosols. In general, there are relatively few studies on the natural deposition behavior characteristics of erosols in containment. Further research is necessary for the natural deposition of erosols in containment.
In the natural deposition process, erosol particles are deposited with an exponential decay law, so we usually use the decay constant to measure the natural deposition decay rate of erosol particles. As shown in this equation,
In the formula, C(t) is the number concentration of erosol particles in the container at time t, t is the deposition time, and λ is the natural erosol deposition decay constant.
In this study, the method of ion neutralization (Baskaran and Zhu, 2017) was used to remove static electricity from erosol particles. The effect of static electricity on the natural deposition of erosol was studied. At the same time, the natural deposition of erosols at different concentrations was studied. Finally, the natural deposition characteristics of erosols were obtained without static electricity and agglomeration.
Experimental Facility and Method
Experimental Facility
The experimental facility (Figure 1) mainly included: a main experimental vessel, an erosol injection system, a sampling measurement system, a static electricity removal system, a spray system, and a sewage treatment system.
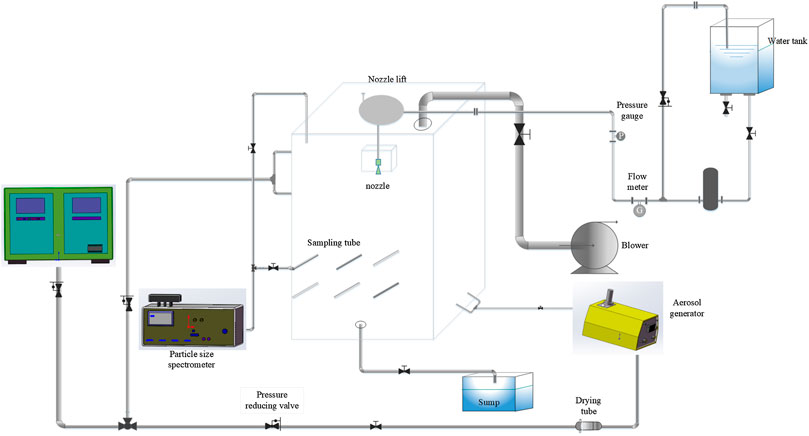
FIGURE 1. Experimental facility.
The main experimental vessel presented consisted of a closed cuboid vessel (1.5 m3 volume, 1.5 m high, and 1 m length and width) made of plexiglass, which was transparent in order to visually observe the internal environment in the vessel in real time (Corno et al., 2017). The erosol was injected at the bottom of the vessel. An extraction system on the top of the vessel allowed us to discharge the erosol that had not been removed during the experimental process.
The erosols chosen in this experiment were polydisperse TiO2 particles, which are safe and convenient to use, and its properties such as powder density, hygroscopicity, and count median diameter (CMD) are similar to those produced in a NPP. Erosol injection was performed using a Topas SAG 410 erosol generator. The generator used a special conveyance to distribute the erosol and we adjusted the erosol injection by controlling the speed of the conveyer belt and the pressure of the carrier gas. In addition, a drying tube was installed on the gas supply line of the erosol generator for drying the air and against the agglomeration of the erosol.
Erosol concentration and particle size distribution in the vessel was measured in real time using the WELAS granulometer that allowed for good repeatability of the initial test conditions (Marchand et al., 2006). In this experiment, the erosol particle size in the experimental data was not the actual particle size, but the optical particle size measured by the WELAS granulometer. The ten stainless steel sampling lines with a diameter of 6 mm were distributed at different positions in the vessel. The TiO2 erosol selected for this experiment was measured for its size distribution which is shown in Figure 2. The erosol was distributed between 0.3 and 10 μm with a CMD of 0.67 μm.
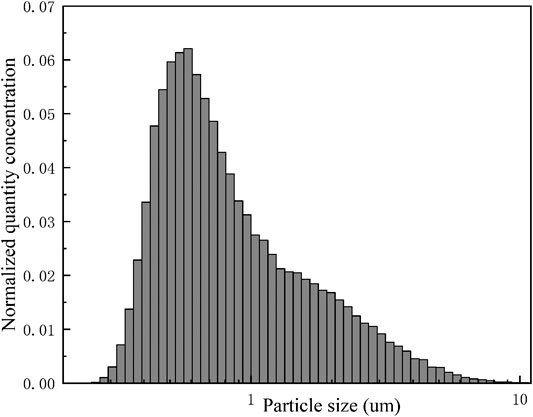
FIGURE 2. Erosol particle size distribution.
During the erosol sampling measurement, the measure range of WELAS was between 0 and 8,000/cm3, the actual concentration was much more than this order of magnitude in this experiment. Therefore, a high concentration of erosol was measured by dilution with a diluter. The diluter selected was the 3302 A erosol diluter produced by TSI, and its dilution factor can be 1–100 times. The dilution factor for this experiment was 25 times. A corresponding experiment was performed to verify the effect of the diluter on the sampling measurements. The measurement results are shown in Figure 3. The dilution factor of the multiple experimental diluter was maintained at 23–26 times. It can be seen that the use of the diluter had essentially no effect on the measurement of the experimental data.

FIGURE 3. Effect of the diluter on the measurement of experimental data.
Removal of Static Electricity
Particles will generate static electricity during injection due to collisions and friction. In most studies of the natural deposition of erosols, the effects of electrostatic interaction on erosol deposition were not considered. In order to not only study the effect of the presence of static electricity on the natural deposition of erosols, and to also measure the effects of gravity sedimentation and Brownian diffusion on the natural deposition of erosols without static electricity, ion neutralization was used to eliminate static electricity from the erosol particles in this experiment. The principle of operation was to use positive and negative ions to neutralize the charge carried by the erosol particles. When the surface of the erosol particle was negatively charged, it attracted a positive charge in the gas stream. When the charge of the erosol particle was positive, it attracted a negative charge in the gas stream. Thereby, the static electricity of the erosol particles was neutralized, and the purpose of eliminating static electricity was achieved.
In order to verify the effect of ion neutralization, relevant experiments were carried out. A plexiglass and a stainless steel sheet were placed horizontally in the vessel. The effect of neutralization on static removal was compared. When the ion neutralization was not used, during erosol injecting, the two plates placed in the vessel were observed afterward for a period of time. It was found that both the top and the bottom of the two plates deposited a large amount of erosol particles. The erosols deposited on the top surface of the plate were mainly caused by gravity sedimentation and Brownian diffusion, while the erosols on the bottom surface were mainly caused by electrostatic action and Brownian diffusion. The same experiment was performed using ion neutralization, it was found that the bottom surfaces of the two plates contained only a few erosol particles. The erosol on the top surface of the plate was mainly due to gravity sedimentation and the Brownian diffusion of erosol particles, those on the bottom were mainly caused by Brownian diffusion. Based on this, it was judged that the use of ion neutralization completely eliminated static electricity carried by the erosol. At the same time, the effect of ion neutralization time on static electricity removal was verified. The results showed that the ion neutralization method had no effect on the removal of static electricity, and that the static electricity on the surface of the particles was quickly removed (removal time was approximately 3 min).
Experimental Procedure
The inside of the vessel was cleaned before the start of the experiment to ensure that the erosol in the vessel was close to the air background level. The TiO2 erosol was then injected. In the injection process, depending on the purpose of the experiment, whether or not to remove the electrostatic was selected. After the erosol was injected, the measuring instrument WELAS was opened for erosol sampling. After the experiment was completed, data analysis was performed. In this experiment, the effects of electrostatic interaction and erosol concentration on the natural deposition of erosol were studied by setting different experimental conditions. At the same time, the effects of gravity sedimentation and Brownian diffusion on the natural deposition of erosols were studied after the removal of other disturbances. The whole experiment was carried out under a normal temperature and pressure. Considering the hydrophobicity of the TiO2 erosol, this experiment did not consider the influence of humidity on the natural deposition of erosols.
Experimental Error Analysis
In this sort of experiment, a certain error usually occurs during the erosol sampling and measurement process. During the test, a 6 mm stainless steel tube was used for sampling, and the sampling tube was not bent. According to relevant experiments, the deposition of erosol particles on the inner wall of the sampling tube was less than 10%, resulting in sampling loss. At the same time, the data measurement error of the WELAS particle size spectrometer was within 5%.
Experimental Results and Analysis
Effect of Static Electricity on the Natural Deposition Characteristics of Aerosols
First, the experiment was carried out in the presence of static electricity. After the start of the experiment, WELAS was used for real-time sampling measurements on the erosol size distribution in the vessel. It was found that the initial erosol particle size distribution changed greatly in a short period of time (approximately 5 min), as shown in Figure 4. It can be clearly seen that the proportion of erosols with a particle size smaller than 1 μm decreased, while erosols larger than 1 μm increased. This is mainly due to the interparticle agglomeration. Due to the presence of static electricity, smaller particles polymerized to form larger particles, resulting in a rapid right shift of the entire erosol particle size distribution after the start of the experiment. The same experiment was performed with static removal, as seen in Figure 5. It was found that the particle size distribution no longer changed significantly. During the period after the start of the experiment, the entire erosol size distribution remained essentially unchanged.
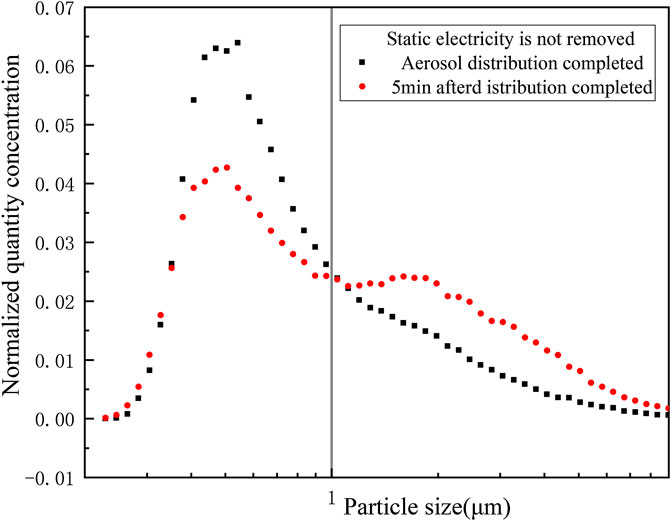
FIGURE 4. Electrostatic effect on erosol distribution. Presence of electrostatic.
FIGURE 5. Electrostatic effect on erosol distribution. Electrostatic removed.
In addition to affecting the size distribution of erosol, the presence of electrostatic interaction also resulted in erosols being more easily deposited on the wall surface of the vessel. In Figure 6, when the electrostatic was removed, the decay constant of all of the particles decreased. This was mainly due to the presence of static electricity, which caused the electrostatically charged particles to be more easily absorbed on the wall surface of the vessel. It can be seen through these experiments that particles smaller than 2 μm were deposited more on the wall surface due to electrostaticity. When the particles size was larger than 2 μm, the electrostatic absorption was no longer significant. The presence of static electricity increased the deposition decay constant of particles between 0.3 and −4 μm by 10–35%.
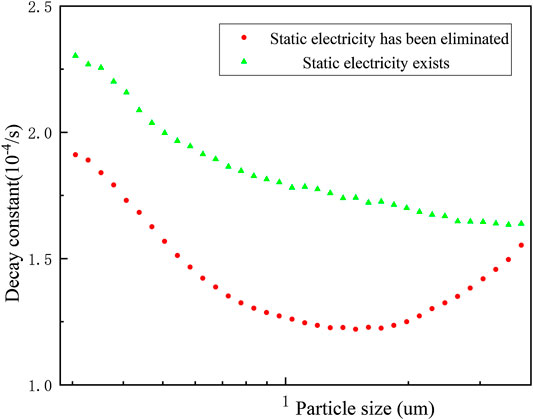
FIGURE 6. Effect of static electricity on the decay constant of the natural deposition of erosols with different particle sizes.
Characteristics of the Natural Deposition of Aerosols in Different Concentrations
The WELAS was used throughout the experiment to observe the particle size distribution of the erosol in the vessel in real time. Experiments were performed at different initial erosol concentrations. The results of the corresponding natural deposition experiments at small concentrations are shown in Figure 7. After the experiment, 1.5×10⁴/cm3 erosol particles were distributed into the vessel. It was found that the count median diameter (CMD) of the erosol gradually decreased as the experiment progressed. The erosol particle size range was determined by the gravity sedimentation control zone. Therefore, according to the calculation formula of gravity sedimentation, it was known that as the erosol particle size increased, the deposition rate would increase. With the increase of the concentration of erosol in the vessel to some extent, it was found that the CMD of the erosol first increased and then decreased with time, as shown in Figure 8, The maximum CMD values was obtained at approximately 15,000 s. It was discovered that the change in CMD trend was mainly due to the agglomeration between particles. Due to the presence of agglomeration, the smaller erosol particles became larger, so that the removal rate of the smaller particles was faster than the larger particles, meaning that the CMD of the erosol increased. When the concentration of the erosol was deposited at a certain value, since the concentration of erosol in the vessel became smaller, the distance between the particles increased, so that the agglomeration between the particles was weakened. At this time, it was consistent with the experimental results when the concentration was small, and the CMD gradually became smaller as the experiment progressed. After multiple experiments, it was found that the erosol agglomeration concentration boundary was 1.5×10⁴/cm3. When the concentration of the erosol was less than 1.5×10⁴/cm3, the CMD gradually became smaller with deposition. When the concentration was greater than 1.5×10⁴/cm3, the CMD first increased and then decreased, and the highest point of increase, that also corresponded to erosol concentration, was 1.5×10⁴/cm3.
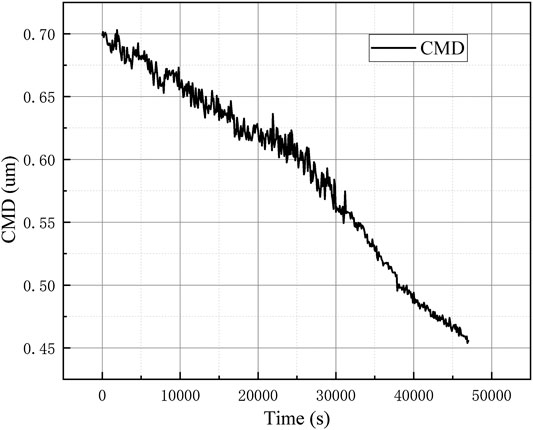
FIGURE 7. CMD changes with time. CMD changes with time at lower concentrations.
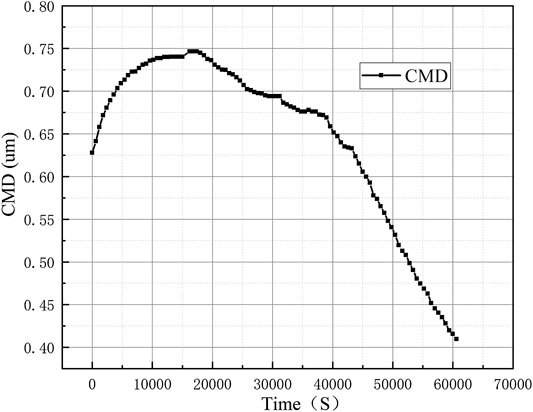
FIGURE 8. CMD changes with time. CMD changes with time at higher concentrations.
The experimentally obtained data were exponentially fitted to obtain the natural deposition decay constants of erosols of various particle sizes at different concentrations. It can be seen from Figure 9, when the erosol concentration number was 1.5×10⁵/cm3, as the erosol particle size became larger, the decay constant of the erosol decreased first and then increased. When the erosol concentration number was less than 1.5×10⁴/cm3, the decay constant increased with the increasing particle size. When the erosol concentration number was greater than 1.5×10⁴/cm3, there was agglomeration between the particles. It can be seen that the smaller the particle size, the more obvious the agglomeration was. As the particle size increased, the agglomeration became weaker. When the particle size was large to some extent, there was no longer any agglomeration between the particles. At this time, the natural deposition of the erosol particles was dominated by gravity sedimentation. As a result, the decay constants decreased first and then increased as the particle size of the erosol particle increased. This corresponded to the changing trend of CMD. At the same time, the effect of electrostatic action on the decay constant of each particle size was compared. In Figure 10, it was found that the concentration of erosol in the vessel was 1.47×10⁴/cm3 and the presence of electrostatic interaction had little effect on the decay constant of the erosol. At high concentrations, the decay constant of each particle size was significantly increased. At the same time, the erosol particle size corresponding to the lowest decay constant was significantly increased. This was mainly because the presence of static electricity enhanced the agglomeration between the particles. The agglomeration of the erosol in the vessel included the agglomeration resulting from the collision between the particles and the agglomeration resulting from the electrostatic interaction. When static electricity was present on the surface of the particles, it was affected by both electrostatic agglomeration and collision agglomeration. Moreover, the particle size range of the electrostatic agglomeration was wider, resulting in a right shift of the particle diameter corresponding to the lowest decay constant.
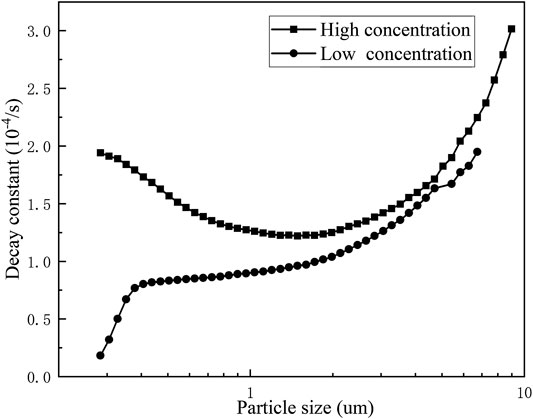
FIGURE 9. Variation of decay constant with particle size. Electrostatic removal.
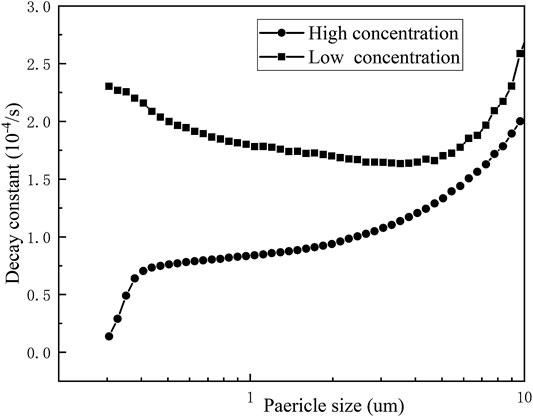
FIGURE 10. Variation of decay constant with particle size. Presence of electrostatic.
Characteristics of the Natural Deposition of Aerosols
It can be seen from the above related experiments that the electrostatic effect and the agglomeration between the particles had a certain affect on the natural deposition of the erosol. Therefore, a corresponding natural deposition experiment was carried out in the case where the erosol concentration was lower than 1.5×10⁴/cm3 and static electricity was removed. The erosol particle size distribution at different times and the natural deposition removed rate of erosols with different particles sizes was studied. The experiment lasted approximately 13 h. The change of the entire erosol particle size distribution with times was obtained, as shown in Figure 11. At that time, the natural deposition of erosol particles was only affected by gravity settling and Brownian diffusion. As time went by, the concentration number of all erosol particles decreased. After 45,600 s of natural deposition, the erosol removal rate of all particle sizes was above 80%. For erosols with a particle size greater than 0.4 μm, the removal rate was above 90%, and for erosols larger than 0.47 μm, the removal rate was above 96%. After the experiment, the erosol in the vessel was at the same level as the air background.
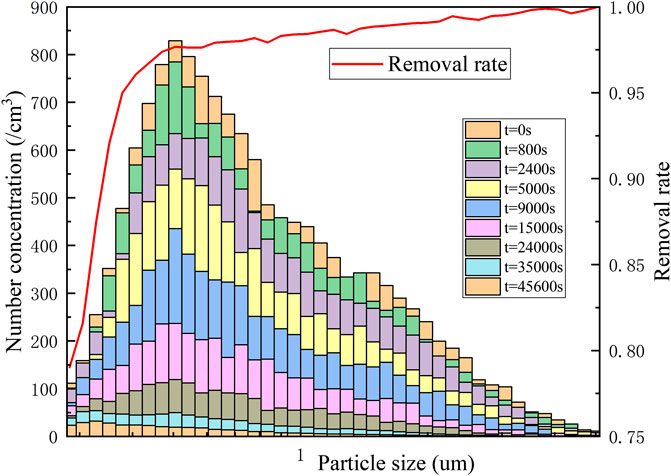
FIGURE 11. Particle size distribution and removal rate of different particle sizes at different times.
The concentration number of erosols with different particle sizes were obtained by an experiment. As shown in Figure 12, the quantitative concentration change of erosols with several particle sizes between 0.3 and 1.5 μm were obtained, and the change of real-time CMD was obtained. It can be clearly seen from Figure 9 that as the particle size of the erosol increased, the natural deposition rate also increased accordingly. And the change of CMD also corresponded to the above. As the experiment progressed, CMD became smaller from 0.93 to 0.43 μm. It showed that when the erosol particle size was larger than 0.4 μm, the natural deposition mainly depended on gravity sedimentation, and the effect of Brownian diffusion was obviously smaller.
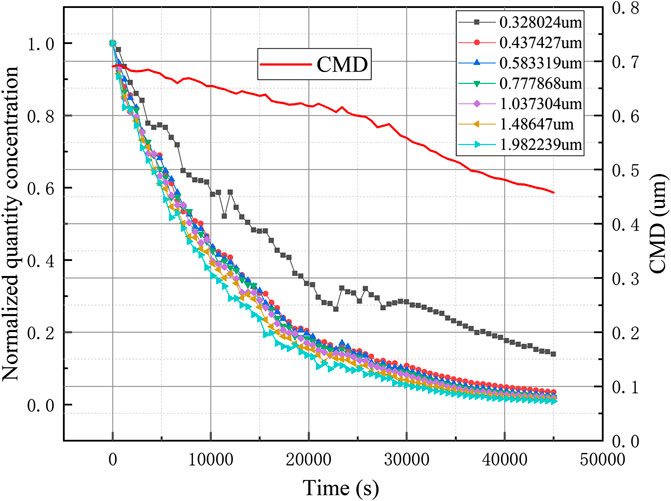
FIGURE 12. Erosol concentration and particle CMD with time.
At the same time, the variation of the mass concentration and quantity concentration of the erosol in the vessel with time was obtained, as shown in Figure 13. It can be seen from the figure that the erosol mass concentration and quantity concentration gradually decreased with time and decreased with an exponential decay law. By fitting the curve, the decay constant of the mass concentration was 1.13×10⁻⁴/s and the decay constant of the quantity concentration was 8.05*10−5/s.
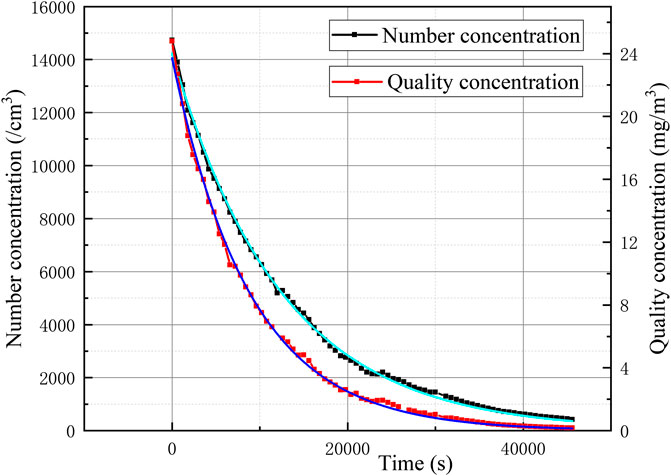
FIGURE 13. Variations in mass concentrations over time.
Conclusion
The presence of static electricity had a certain impact on the natural deposition of erosols: 1) the agglomeration of small particles at high concentration due to electrostatic and particle collision led to erosol particle size distribution shift after injection; 2) the presence of static electricity accelerated the natural deposition of the erosol, increasing the decay constant of erosols (0.3–4 μm) by 10%–35%.
When the concentration of the erosol was ≥1.5×10⁴/cm3, the agglomeration between the particles caused the decay constant to increase first and then decrease with the increase of particle size. When the concentration of the erosol was <1.5×10⁴/cm3, there was no longer any agglomeration between the particles, and the decay constant of the erosol increased with the increase of the particle size. In addition, the presence of static electricity enhanced the agglomeration between particles.
The deposition of the erosol was naturally measured after the static electricity was removed and the concentration was less than 1.5×10⁴/cm3. At this time, the erosol mainly relied on gravity sedimentation and Brownian diffusion. It was found that after approximately 45,600 s, the removal rate of the erosols (0.3–10 μm) was above 80%. After approximately 45,600 s, the erosol concentration inside the container substantially settled back to the air background level. The overall mass concentration was small in terms of the exponential decay law, and its mass decay constant was 1.13×10⁻⁴/s.
Data Availability Statement
The datasets generated for this study are available on request to the corresponding author.
Author Contributions
All authors listed have made a substantial, direct, and intellectual contribution to the work and approved it for publication.
Conflict of Interest
The authors declare that the research was conducted in the absence of any commercial or financial relationships that could be construed as a potential conflict of interest.
Abbreviations
NPP, nuclear power plant; LOCA, loss-of-coolant accident; AP, advanced pressurized-water reactor; PCCS, passive containment cooling system.
References
Dehbi, A. (2004). “Tracking aerosols in large volumes with the help of CFD[C],” in 12th international conference on nuclear engineering, Arlington,Virginia USA, April 25–29, 2004 (New York, NY: American Society of Mechanical Engineers), 853–860.
Kontautas, A., and Urbonavičius, E. (2009). Analysis of aerosol deposition in PHEBUS containment during FPT-1 experiment. Nucl. Eng. Des. 239, 1267–1274. doi:10.1016/j.nucengdes.2009.03.012
Powers, D. A., and Washington/SNL, K. E. (2017). A simplified model of aerosol removal by natural processes in reactor containments. Tai yuan, China: Radiation Protection, 45–48.
Corno, A. D., Morandi, S., Parozzi, F., Araneo, L., and Casella, F. (2017). Experiments on aerosol removal by high-pressure water spray. Nucl. Eng. Des. 311, 28–34. doi:10.1016/j.nucengdes.2016.06.043
Fu, Y., Geng, J., and Sun, D. (2017). AP1000 aerosol natural removal analysis in the containment for AP1000 nuclear power point [J]. Atomic Energy Sci. Technol. 51 (4), 700–705. doi:10.7538/yzk.2017.51.04.0700
Yang, J. M., and Jokiniemi, J. K. (1997). AHMED experiments on hygroscopic and inert aerosol behaviour in LWR containment conditions: experimental results. Nucl. Eng. Des. 178, 45–59. doi:10.1016/S0029-5493(97)00174-X
Lai, A. C. K. (2006). Investigation of electrostatic forces on particle deposition in a test chamber. Indoor Built Environ. 15, 179–186. doi:10.1177/1420326x06063219
Snepvangers, L. J. M., and Van De Vate, F. (1987). Diffusiophoresis of fission product aerosol in an lwr containment after core meltdown. nuclear science and technology. Official Publications of the European Communities, 39.
Qiu, L., Zhang, Z., Wu, Y., Yang, W., Wu, S., and Zhang, L. (2017). Decay of high-concentration aerosol in a chamber. Aerosol Sci. Eng. 1, 155–159. doi:10.1007/s41810-017-0015-z
Marchand, D., Porcheron, E., Lemaitre, P., and Gréhan, G. (2006). Characterization of the washout of aerosols by spraying water for thermal hydraulic conditions representative of a severe accident in nuclear reactor containment[J]. EMBO J. 20 (17), 4923–4934.
Keywords: aerosol, natural deposition, polymerization, electrostatic effect, severe accident
Citation: Tian LT, Gu H, Yu H and Chen J (2020) Experimental Study on the Natural Deposition Characteristics of Erosols in Containment. Front. Energy Res. 8:527598. doi: 10.3389/fenrg.2020.527598
Received: 17 January 2020; Accepted: 10 November 2020;
Published: 14 December 2020.
Edited by:
Shripad T. Revankar, Purdue University, United StatesReviewed by:
Ivo Kljenak, Institut Jožef Stefan (IJS), SloveniaMingjun Wang, Xi’an Jiaotong University, China
Yen-Shu Chen, Institute of Nuclear Energy Research (INER), Taiwan
Copyright © 2020 Tian, Gu, Yu and Chen. This is an open-access article distributed under the terms of the Creative Commons Attribution License (CC BY). The use, distribution or reproduction in other forums is permitted, provided the original author(s) and the copyright owner(s) are credited and that the original publication in this journal is cited, in accordance with accepted academic practice. No use, distribution or reproduction is permitted which does not comply with these terms.
*Correspondence: Haifeng Gu, Z3VoYWlmZW5nQGhyYmV1LmVkdS5jbg==