 Yufeng Lv
 Minfu Zhao
 Kaiwen Du
- China Institute of Atomic Energy, Beijing, China
The investigation of critical flow model for supercritical pressure condition is relatively rare. Based on isentropic flow and thermal equilibrium assumptions, a model is derived to calculate discharge flow rate and critical pressure. Considering the influence of friction and local resistance, a correction coefficient is added which can be calculated from CFX analysis software. The model avoids the calculation of quality and is applicable to wide range which covering the subcooled water, two-phase mixture, steam critical flow under subcritical pressure and supercritical pressure. Reasonable agreement is shown between model predicted results and experiment data, illustrating the accuracy of the proposed model.
Introduction
During a postulated loss of coolant accident of a pressurized water reactor, the critical flow occurs at the break. An accurate estimation of the critical flow rate is very important for the evaluation of reactor safety, because the critical flowrate controls heat transfer in the core and the rate of system depressurization, thus has a significant effect on the accident consequence. The loss of coolant accident is particularly of a concern for the supercritical water cooled reactor reactor safety, because the coolant inventory in supercritical water cooled reactor is much smaller than that in the current pressurized water reactor for same power output, and thus the transient response of the reactor would be dominated by the discharge flow rate more strongly.
Under subcritical pressures, various theoretical models to predict discharge flowrates have been advanced, such as homogeneous equilibrium model (HEM) (Starkman et al., 1964), hydrodynamic non-homogenous model (Fauske, 1962; Moody, 1965), and thermal non-equilibrium model (Henry and Fauske, 1971; Richter, 1983). Still more elaborate mechanistic models have been recently developed which can account for both thermal and hydrodynamic non-equilibrium between phases (Richter, 1983; Dobran, 1987). Although still poorly understood, mechanistic models that attempt to follow the nucleation and growth of the vapor bubbles require specification of initial conditions at the onset of flashing. Abdollahian (1982) did comprehensive and excellent reviews on the existing models. Many researchers adopt HEM model or modified HEM model to predict the critical flow rate under supercritical pressure. Guillaume Mignot et al. (2008) found that the HEM model predicts higher than United Kingdom Atomic Energy Authority experimental data due to the isentropic flow assumption. Chen et al. (2012) considered the local resistance effect and proposed a modified HEM which showed good agreement in the region of near and beyond pseudo-critical temperature. For the inlet temperature well below the pseudo-critical point, Bernoulli equation gave an upper envelope of the test data. He suggested that from the reactor safety point of view the combination of the HEM with Bernoulli equation gave a conservative estimation for the break discharge flow rate. But there exists discontinuity at the intersection of the two models.
In the present study, we focus on conducting a more general critical flow model which can be applicable for inlet temperature well below the pseudo-critical point and temperature beyond the pseudo-critical point under supercritical pressure. First, the hydrodynamic non-homogeneous and thermal non-equilibrium have been proved having little effect on critical flow rate and a model is put forward based on isentropic flow and thermal equilibrium assumptions. Then considering the local resistance and friction, an empirical coefficient C which can be obtained through the Computational Fluid Dynamics (CFD) simulation is added to the model. The model accuracy is validated by supercritical water blowdown test data conducted by the United Kingdom Atomic Energy Authority and China Institute of Atomic Energy (CIAE).
Thermal and Hydrodynamic Non-Equilibrium Effect
Usually slip ratio is introduced to account for the two phase relative motion effect, which is defined as the ratio of gas velocity to liquid velocity. Fauske (1962) led the field in developing a model which allows for hydrodynamic effects. For critical flow, the slip ratio at the critical location is given by
The HEM model, Fauske model and Moody model are adopted to calculate the critical mass flux for saturated water flowing in nozzles under different stagnation pressures (0.1–20 MPa). The nozzle outlet pressure (critical pressure) is calculated accordingly for different models. The value of outlet pressure may be different for each model, but the main principle is the mass flux reaches a maximum value at the critical pressure. The comparison for different models is shown in Figure 1 and Table 1. It can be seen that, at lower pressure, the slip ratio has great effect on critical mass flux; but at higher pressure, the slip ratio effect decreases. For example, when stagnation pressure is 22 MPa, the mass flux calculated by Moody model is 52,700 kg m−2 s−1 and the mass flux calculated by HEM model is 45,892kg m−2 s−1, the deviation is only 12.9%. Therefore, it is concluded that under supercritical pressures, the hydrodynamic effect is small and can be neglected.
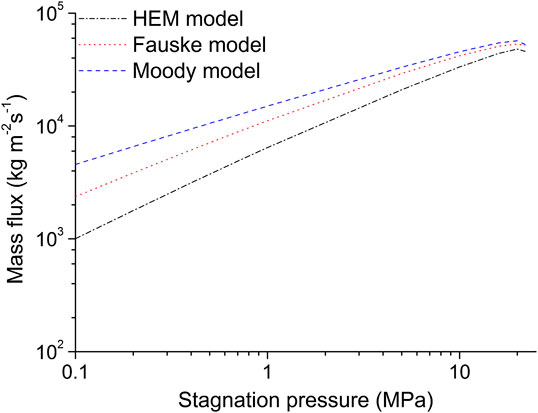
FIGURE 1. Variation of mass flux with stagnation pressure for saturated water.
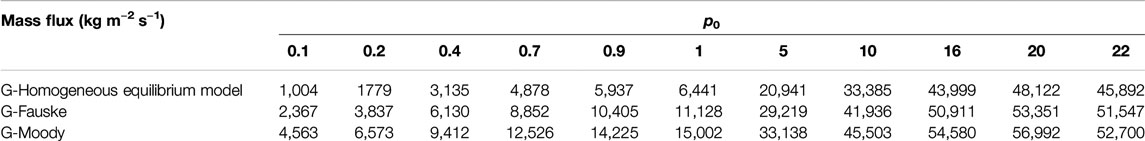
TABLE 1. Comparison of critical mass flux with homogeneous equilibrium model, Fauske model and Moody model.
Thermal non-equilibrium decreases as pressure increasing, and in the region of supercritical pressure the thermal equilibrium is dominant (Chen et al., 2008; Chen et al., 2009). This trend is reasonable, because higher pressure corresponds to higher vapor density and thermal conductivity and smaller droplet, associated with more efficient interfacial heat exchange. Same finding was achieved in the similar experiments of supercritical water (Lee and Swinnerton, 1983) and CO2 (Mignot et al., 2008).
The Present Model
Model Derivation
Based on the above discussion, the thermal equilibrium and hydrodynamic homogeneous effect is dominant for critical flow under supercritical pressure. Therefore, in the model developed here, the following assumptions are made:
(1) Steady-state flow.
(2) The friction effect is ignored and the flow is considered isentropic.
(3) The vapor phase and liquid phase are in thermal equilibrium state.
(4) Liquid and vapor velocity are the same.
(5) The flow is considered to be one-dimensional.
The mass flux at the nozzle outlet is defined as:
where
Because it is assumed that there is no heat exchange between fluid and environment, and the energy equation is simplified as:
As the nozzle upstream stagnation velocity is zero, the relationship between inlet stagnation enthalpy and outlet enthalpy can be expressed as follows:
Because the friction effect is ignored, the outlet velocity can be obtained by energy conservation equation:
Substituting Eq. 4 to Eq. 1, the outlet mass flow rate can be obtained:
where
For ideal gas and superheated vapor, the relationship between inlet density, outlet density, inlet pressure and outlet pressure can be expressed as:
The following expression can be obtained:
By substituting Eqs 7 and 8 to Eq. 1, the mass flux can be evaluated as:
Equation 9 is exactly the same with the critical flow equation in gas dynamics. In other words, the proposed critical flow model is applicable to critical flow for ideal gas and superheated vapor.
For room temperature water, the density ρ is almost constant, combining the definition of entropy, during the isentropic process, we can obtain:
Thus, Eq. 5 may be simplified to:
Equation 11 is identical to the Bernoulli Equation, where the back pressure equals the atmosphere pressure. It can be concluded that Eq. 8 is a general model which is applicable to both subcooled water and superheated steam.
Based on isentropic assumptions with thermal equilibrium and equal velocities of two-phases, a HEM model (Starkman et al., 1964) was proposed as follows,
where
In fact, the current model Eq. 5 may be converted to Eq. 12 by substituting
Considering the actual discharge flow is not isentropic due to the friction and local resistance effect, Chen et al. (2012) modified the HEM model as
where C is the local resistance factor, and
Similarly, taking the friction and local resistance effect into account, a resistance factor C is multiplied to Eq. 5 and it becomes:
Calculation of Resistance Factor C
Usually, an empirical coefficient C is used for the critical mass flux calculation. For example, in Chen’s previous work, different empirical coefficients are used in the modified HEM model: for sharp-edge nozzle (nozzle A), the recommended C is 0.6; for round-edge nozzle (nozzle B), C = 0.4. But the choice of C is totally empirical and based on the user’s experience. Actually, the resistance factor C is not only affected by nozzle inlet geometry, but also related with nozzle length and fluid state.
In this section, a method of using the CFD software to calculate resistance factor is proposed. The commercial CFD code ANSYS CFX 14.0 is employed. To illustrate the analysis method to calculate resistance factor C, the nozzle configuration employed is a round-edge nozzle taken from literature (Chen et al., 2012), as shown in Figure 2.
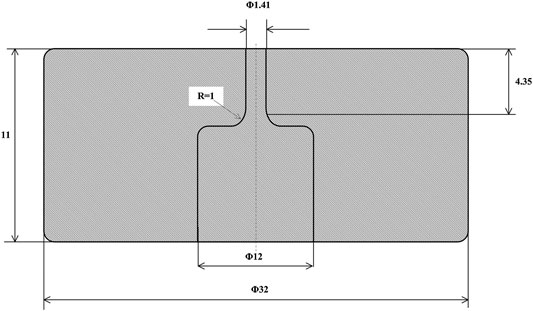
FIGURE 2. Schematic of nozzle A in literature (Chen et al., 2012).
The test section adopts high pressure lens pad orifice, and is fitted onto the main loop through threaded flange. To ensure the accuracy and reproducibility of the test, the finishing process is used and the tolerance of the nozzle diameter is 2 μm. The schematic diagram is shown in Figure 2. The total length of the test section is 11 mm, the outer and inner diameter of the lens pad orifice is 32 and 12 mm, respectively. The diameter of the nozzle is 1.41 mm and the length of the nozzle is 4.35 mm with rounded edge inlet, the radius of which is 1.0 mm.
The involved problem is room temperature water flowing through the nozzle. The region inside the nozzle is chosen as the numerical analysis region. The inlet of analysis region is set as Pressure Inlet at which the pressure, temperature are specified. The outlet is set as the Pressure Outlet with relative pressure 0 Pa. In this simulation, the initial pressure p0 = 25 MPa, initial temperature T0 = 20°C, and the standard k–ε model is employed. Then the mass flux G can be calculated by the simulation, thus the resistance factor C can be calculated by the following expression:
where G is the mass flux calculated by CFX,
For example, for supercritical water of initial pressure p0 = 25 MPa, initial temperature T0 = 20°C flowing in a round-edge nozzle (Nozzle A), the geometry of which is chosen from literature (Chen et al., 2012), as shown in Figure 2. The calculated mass flux is 175,000 kg m−2 s−1), substituting the value into Eq. 15, the resistance factor can be obtained. For this case, the resistance factor C equals 0.8.
For a given upstream condition and nozzle of certain geometry, the calculation procedure of the present model is as following:
Firstly, set a series of outlet pressure
Verification of the Model
Supercritical Pressure Condition
The supercritical pressure critical flow experiment performed by Chen et al. (2012) adopts nozzle of 1.41 mm in diameter and 4.35 mm in length with rounded-edge, with inlet pressure range of 22.1–31 MPa, subcooling range of −88–82°C. Under supercritical pressures, the subcooling is defined as the pseudo-critical temperature corresponding to the nozzle inlet pressure minus the inlet temperature (
Figure 3 shows the comparison between the present correlation with the test data for inlet pressure of 22.1–24.9 MPa, subcooling of −75–82°C. In the calculation, the initial pressure is set as 23 MPa for convenience. According to the calculation method of resistance coefficient in “Calculation of Resistance Factor C” section, the coefficient C is chosen as 0.8. As can be seen, the model gives the agreement basically within ±10%.
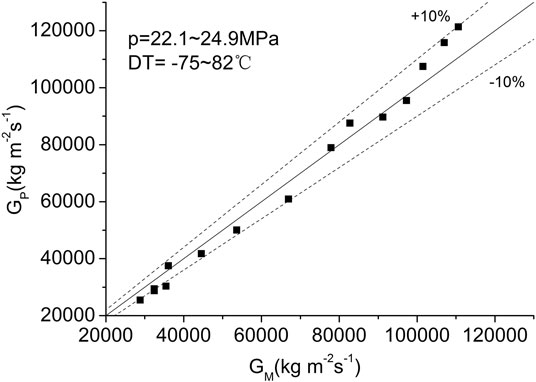
FIGURE 3. Comparison to the result of Chen (p = 22.1–24.9 MPa).
Figure 4 shows the comparison between the present model with test data for inlet pressure of 25–26.8 MPa, subcooling of −88–80°C. The initial pressure is set as 26 MPa and the resistance factor remains unchanged. The calculated mass flux matches with the test data within 10% relative error.
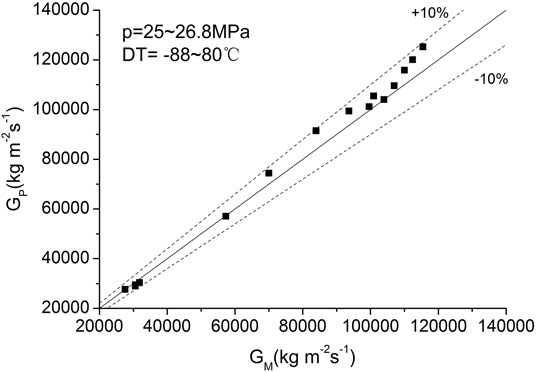
FIGURE 4. Comparison to the result of Chen (p = 25–26.8 MPa).
The critical flow experimental data of supercritical water were obtained by Lee and Swinnerton (1983) with four different nozzle test sections. In this study, test data of nozzle B is used to validate the proposed critical flow model. The nozzle diameter is 1.78 mm, length to diameter is 3, the range of inlet pressure is of 24.1–31 MPa, and the range of subcooling is of −20–60°C. The resistance coefficient is 0.9 in this calculation. The comparison of model predicted mass flux and measured data is shown in Figure 5. It can be concluded that calculated mass flux and experimental results agree within 10% of relative error, which validates the accuracy of the proposed model.
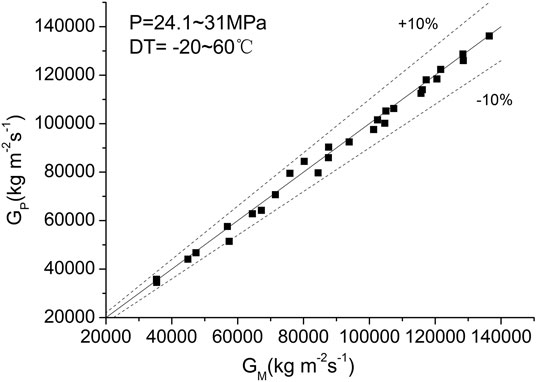
FIGURE 5. Comparison to the result of Lee and Swinnerton.
Subcritical Pressure Condition
CIAE has conducted a series of steady state critical flow tests with long nozzle, the diameter of which is 2 mm and the length of which is 40 mm, the test parameter covers a wide range: initial temperature ranges from 20 to 350°C, inlet quality ranges from 0.0 to 0.5, the upstream pressure is 10, 13, and 16 MPa, respectively (Zhao et al., 2015). According to the CFD calculation, choose the resistance coefficient C = 0.82 for subcooled condition and C = 0.9 for the saturated condition. The results are displayed in Figures 6 and 7. As can be observed, the model predicted results and long nozzle experiment results are in good agreement.
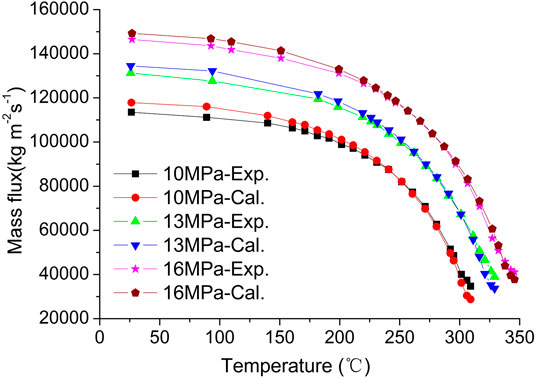
FIGURE 6. Comparison of model prediction with experiment data (subcooled condition).
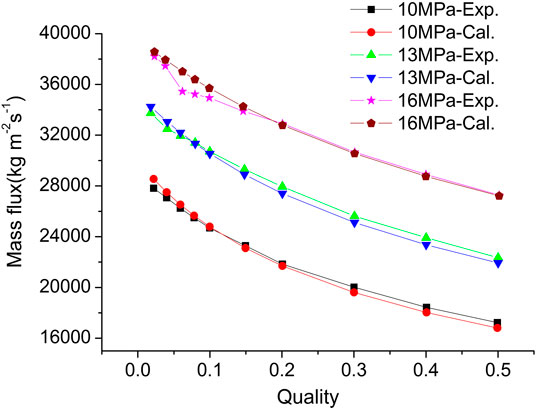
FIGURE 7. Comparison of model prediction with experiment data (saturated condition).
It can be seen from Figure 6 that at low temperature, the calculated mass flux is a bit higher than the measured data; while at high temperature, especially near the saturation temperature region, the calculated mass flux is lower than the test data. The error is closely related to the value of resistance coefficient C. In the current model, C = 0.82 is obtained at the room temperature condition (Tin = 20°C) and this value is used for all the subcooled region condition. Considering the error in numerical simulation, the calculated mass flux is a little higher than the measured value for the low temperature region and the maximum error between model prediction with test data is within 5%. As mentioned above, C = 0.9 is chosen for saturated region and this value is obtained for the saturated vapor condition. Therefore, there is a discontinuity between subcooled condition and saturated condition. Essentially, the resistance coefficient C should gradually increase from 0.82 to 0.9 for the transition from subcooled condition to saturated condition. This is why the calculated mass flux is lower than the test data for the near saturated condition. Caution is needed for the calculation of critical mass flux near saturated condition.
It should be mentioned that the current model is derived with the thermal equilibrium assumption, and is not applicable for two-phase critical flow condition where thermal non-equilibrium effect is dominant. For instance, inlet water with low subcooling or low quality and flowing through short nozzle condition. It is suggested that critical flow model considering thermal non-equilibrium effect is used in the above situation.
Conclusions
(1) With the isentropic and thermal equilibrium assumption, a critical flow model for supercritical pressure is proposed which can calculate critical pressure and critical mass flow rate. This model is also applicable for room temperature water discharge, two phase mixture, superheated steam critical flow.
(2) Considering friction and local resistance, the actual process is not isentropic; a resistance coefficient C is added in the model can be calculated from the CFD simulation.
(3) The maximum error between model prediction results and experiment data are within 10% under supercritical pressure and within 5% under low temperature region at subcritical pressure, illustrating that the model is accurate.
(4) Though the model gives satisfactory result at supercritical flow condition, it is not applicable for two-phase critical flow condition where thermal non-equilibrium effect is dominant.
Data Availability Statement
All datasets generated for this study are included in the article.
Author Contributions
YL was mainly responsible for critical flow model derivation and verification, data collection, and paper drafting. MZ mainly contributed to the model derivation design, critical flow test conduction under sub-critical pressure. KD was mainly responsible for paper review and modification.
Conflict of Interest
The authors declare that the research was conducted in the absence of any commercial or financial relationships that could be construed as a potential conflict of interest.
Acknowledgments
The present investigation is supported by the National Key R&D Program of China (2018YFE0116100). The authors wish to thank the CIAE team who performed the critical flow test under supercritical and subcritical pressure and provided the test data for the model validation. Special thanks to Professor Chen Yuzhou who contributed so much data for this paper.
References
Abdollahian, D., Healzer, J., Janssen, E., Amos, C., and Levy, S. (1982). EPRI Report No. NP-2192. Critical flow data review and analysis, final report.
Chen, Y., Yang, C., Zhang, S., Zhao, M., Du, K., and Cheng, X. (2008). “An experimental study of critical flow of water at steady-state with pressure of up to 22 MPa,” in Proceedings of the 7th international symposium of heat transfer, Beijing, October 26–29, 2008.
Chen, Y., Yang, C., Zhang, S., Zhao, M., Du, K., and Cheng, X. (2009). Experimental study of critical flow of water under near-critical and supercritical pressures. Front. Energy Power Eng. 3, 175–180. doi:10.1007/s11708-009-0029-6
Chen, Y., Zhao, M., Yang, C., Bi, K., Du, K., and Zhang, S. (2012). Research on critical flow of water under supercritical pressures in nozzles. J. Energy Power Eng. 6, 201–208.
Dobran, F. (1987). Non-equilibrium modeling of two-phase critical flows in tubes. J. Heat Transf. 109, 731–738. doi:10.1115/1.3248151
Fauske, H. K. (1962). Contribution to the theory of two-phase, one-component critical flow. Ph.D. Thesis.
Henry, R. E., and Fauske, H. K. (1971). The two-phase critical flow of one composition mixtures in nozzle, orifices, and short tubes. J. Heat Tran. 93, 179–187. doi:10.1115/1.3449782
Lee, D. H., and Swinnerton, D. (1983). Report No. EPRI NP-3086. Evaluation of critical flow for supercritical steam-water.
Mignot, G., Anderson, M., and Corradini, M., (2008). Critical flow experiment and analysis for supercritical fluid. Nucl. Eng. Technol. 40 (2), 133–138. doi:10.5516/net.2008.40.2.133
Moody, F. J. (1965). Maximum flow rate of a single component, two-phase mixture. Trans. ASME J. Heat Transf. 87, 134–141. doi:10.1115/1.3689029
Richter, H. J. (1983). Separated two-phase flow model: application to critical two-phase flow. Int. J. Multiphase Flow. 9 (5), 511–530. doi:10.1016/0301-9322(83)90015-0
Starkman, E. S., Schrock, V. E., Neusen, K. F., and Maneely, D. J. (1964). Expansion of a very low quality two-phase fluid through a convergent-divergent nozzle. J. Basic Eng. 86 (2), 247–254. doi:10.1115/1.3653047
Keywords: critical flow, supercritical water cooled reactor, loss of coolant accident, thermal equilibrium effect,resistance coefficient
Citation: Lv Y, Zhao M and Du K (2020) A Critical Flow Model for Supercritical Pressures. Front. Energy Res. 8:521233. doi: 10.3389/fenrg.2020.521233
Received: 18 December 2019; Accepted: 14 September 2020;
Published: 08 October 2020.
Edited by:
Jun Wang, University of Wisconsin–Madison, United StatesReviewed by:
Jinbiao Xiong, Shanghai Jiao Tong University, ChinaKeyou S. Mao, Oak Ridge National Laboratory (DOE), United States
Cheng Liu, University of Wisconsin–Madison, United States
Copyright © 2020 Lv, Zhao and Du. This is an open-access article distributed under the terms of the Creative Commons Attribution License (CC BY). The use, distribution or reproduction in other forums is permitted, provided the original author(s) and the copyright owner(s) are credited and that the original publication in this journal is cited, in accordance with accepted academic practice. No use, distribution or reproduction is permitted which does not comply with these terms.
*Correspondence: Yufeng Lv, bnVjbGVhcjE1QDE2My5jb20=