 Yigang Wei1,2
 Kenneth Hoi Ki Chung
 Tsun Se Cheong
 David Kam Hung Chui
- 1School of Economics and Management, Beihang University, Beijing, China
- 2Beijing Key Laboratory of Emergency Support Simulation Technologies for City Operation, Beihang University, Beijing, China
- 3Department of Economics and Finance, Hang Seng University of Hong Kong, Hong Kong, China
There has been a general consensus that greenhouse gas emission is closely related with energy consumption. A systematic and complete investigation of the state and evolution of the energy consumption structure (ECS) of global countries is of great importance to figure out the different positions, responsibilities and missions of each country in the global climate change cooperation. Furthermore, such task is of great policy implications to generate a global reference system for different countries, guiding each one to improve, update and optimize its ECS. However, most existing studies regarding the world ECS neglects the evolutionary trends of ECS and their distributional positions in the global picture. Noting the paucity of studies of convergence in ECS across the world countries, this paper aims to explore the evolution of ECS at the national level and the global level to sharpen understandings on the state of global energy transition by employing the distribution dynamics approach. Three major energy sources were investigated, including coal, oil, and natural gas. The dataset was collected from the Global Trade Analysis Project database whose latest version covers the period from 2004 to 2014. In the second part of the analysis, the dataset is further divided into different income groups so as to evaluate the impacts of income on the distribution dynamics. A distribution dynamics approach is used to analyze the data of almost all the countries and regions in the world. The visualization of global ECS provides an insightful and novel understanding on the underlying trends. This study fills an important gap in the literature by providing several important findings which are not available from traditional econometric techniques. First, many countries would reduce their relative coal and oil consumption in the future but oil would remain to be the most common form of energy source. However, great variability can be observed for the distribution of gas consumption. Second, from the ergodic distribution of the gas market, it can be observed convergence clubs may emerge in the long run as the countries would congregate in certain clusters with similar levels of gas consumption. These findings call for further research and policy planning for the development of gas industry. Third, the distribution dynamics is very different for the four income groups (according to the World Bank), and so it is necessary to take a country's income level into consideration in formulating energy policies. Fourth, our findings reflect the issue of global inequality amongst the countries as the energy consumption of the poor countries are much lower than the other countries. Fifth, oil is deemed to be the most popular form of energy sources for the upper-middle-income and high-income countries, while coal is not a preferred energy source for the affluent countries, thereby suggesting the need to provide aid to the poor countries for mitigating the use of coal. Finally, gas consumption seems to have a very high variability and the countries can have very different consumption patterns of gas even if they belong to the same income category, implying that country-specific policies should be formulated for the development of the gas industry. Furthermore, it is observed that for the lower-middle-income and upper-middle-income countries, the big consumers of gas tend to increase their gas consumption further. The findings derived from this study may prove valuable for the policy makers in formulating energy policies for adapting to market changes, and may assist the design of international aid program on mitigating carbon emissions for the poor countries.
Introduction
Against the backdrop of global warming and the global commitment on mitigating the adverse impacts of climate change, promoting energy consumption transition toward clean and renewable alternatives is an imperative mission. The energy consumption structure (ECS) is defined as the composition and proportion of each type of energy consumed (such as coal, oil, natural gas, nuclear power, and other renewable energy) relative to the total energy consumption (Hu et al., 2018; Yang et al., 2018). In the current global ECS, coal and oil are regarded as the top culprit of carbon emission and other air pollutants (Ozturk and Yuksel, 2016). Undoubtedly, the massive use of coal and oil has led to relentless growth of carbon dioxide emissions in developing countries. Additional environmental challenges on sustainable economic growth has also been brought about (Kahia et al., 2016; Li et al., 2018; Wei et al., 2019a,b). In addition, renewable energy sources generate nearly zero emission in the consumption process, which is the key to promote ECS optimization (Çelikbilek and Tüysüz, 2016). However, the widespread use of renewable energy sources has been impeded by the immaturity of technology and economical unaffordability (Chen et al., 2019). On the contrary, natural gas is considered as clean and transitional energy with the advantages of high unit heat value, low exhaust pollution and good economy. Before the advent of economically viable and technological reliable renewable energy sources, expanding the natural gas consumption is a feasible roadmap to promote the ECS toward a green transition.
While there have been substantial literatures exploring the contributing factors behind energy consumption globally, little attention has been paid on whether differences in ECS among different countries vanish over time, and if convergence can be realized. Convergence research is important in terms of mapping out the current condition and in the formulation of regional policies so as to rationalize the energy structure (Herrerias, 2012). Nevertheless, the existing literature cannot provide policy makers with country-level estimation on the ongoing dynamics of the global energy consumption market. In the absence of this material, this study aims to fill the gap in the literature by examining the unfolding energy consumption market dynamics through performing country-level transitional dynamics analysis. This paper evaluates the evolution and the trend of energy consumption structure, but focusing on three major energy sources i.e., oil, coal, and gas. The data used in the study are based on the Global Trade Analysis Project database which is compiled by Purdue University. The dataset is made up of almost all the countries and regions in the world spanning the period from 2004 to 2014. Distribution dynamics approach is used to explore the evolution and dynamics changes of each country with the distributions in different regional groups. The methodological and practical advantages of the research method are summarized as follows: (1) The estimation on the distribution of ECS among all the countries can help commensurate intergovernmental cooperation plan by prioritizing the energy and subsidy policies across the countries. (2) The research outcome can depict the future development trend of national ECS, thereby guiding the government to allocate capital and technical resources in a more efficient way to promote energy transition. (3) The organizations for climate change cooperation can encourage and prioritize their investment in these countries and regions, and improve knowledge diffusion, particularly for the region with outdated and imbalanced ECS.
The contribution of this study lies in the following three aspects. First, to the best of the authors' knowledge, this is the most comprehensive study ever performed for investigating the evolution and trend of global energy transition by using distribution analysis. Stochastic kernel analyses are performed for the world in order to draw a complete and an in-depth picture of the evolution and convergence of energy transition in the world. Second, distribution dynamics analyses are conducted individually for each of the three main markets, namely, the coal, oil, and gas markets, so as to provide a comprehensive analysis on the overall energy market in the world. Finally, this paper also provides an in-depth investigation on the impact of income on the distribution dynamics of the countries at the global level. The findings foster better understanding of dynamics of ongoing energy transition and provide policy makers relevant reference for formulation of pertinent energy policies in alleviating climate change impacts.
The rest of the paper is organized as follows. In section Background and Literature Review, background information and literature review of the convergence concept are provided. In sections Data and Method, the research methods and data are introduced. Section Results is a detailed discussion of empirical results. Section Conclusions concludes the research findings and policy recommendations.
Background and Literature Review
The optimization of ECS is beneficial to promoting energy security and environmental conservation. Firstly, the improvement in ECS contributes to the energy security (Augutis et al., 2015; Yang et al., 2018). Optimal ECS can be considered as a mix of different types of energy to minimize the risks caused by the future uncertainties in the energy market (Thangavelu et al., 2015). Ozturk and Yuksel (2016) argued that some renewable and clean energy sources are centrally important to ensure safe and sustainable energy supply. Therefore, improvement in ECS is imperative to guarantee energy security and support economic development (Liang and Zhang, 2009). Secondly, the optimization and green transition of ECS is centrally important to curb global warming and realize sustainable economic development. ECS is also one of the most important monitoring and measurable indicators to evaluate the technological or affluence level of a region or nation (Hu et al., 2018). Besides excessive carbon dioxide emissions, the fossil fuel-based ECS leads to some environment issues such as frequent hazy weather, acid rains, etc. in developing countries. Actually, ECS is rooted in the energy endowment and accessibility condition of a nation (Yang et al., 2018). Since energy sources endowments are diverse, ECS shows varied patterns in different countries. For example, the Middle East countries have natural advantages of rich oil and natural gas endowments, hence their ECSs mainly rely on these two types of fuels. For China and India, the top two developing countries situated in the Asia Pacific regions, they have extremely high proportion of coal in their ECSs, due to their huge coal reserves. On the other hand, ECS is highly related to technological and affluent level of a country (Wu et al., 2018b). In many post-industrial and developed countries, their ECS are transiting rapidly toward low-carbon, high-output structures. The energy-related technologies including clean and renewable energy mix and the end processing technologies of carbon emission are advancing remarkably. For another example, the growing of renewable energies in the energy mix and trade, such as the wide commercialization of shale gas and globalization of liquefied natural gas (LNG) driven by the technological progress is an impetus for energy transition in these countries (Wu et al., 2018b), contributing to a high share of gas in their ECSs. These countries are proactively diversifying and optimizing their ECS (Hu et al., 2018). Therefore, evolutional analyses on the ECS of the global countries is important not only for guiding a country to figure out its ECS, but also for developing an analytic framework within which countries can make cross-sectional comparisons and learn from the cohorts with similar conditions but superior ECS.
Figure 1 shows the historical evolution of energy mix consumption including the consumption volumes of oil, coal, gas and renewable alternatives (e.g., nuclear power, hydropower, solar power, and wind power) and the proportions of fossil energy consumption and non-fossil consumption during 1965 to 2018. According to British Petroleum (BP) statistical data (BP, 2019), the total global energy consumption gradually increased from 3699.3 Mtoe in 1965 to 13724.2 in 2018, with an annual growth rate of 6% and a total increment of 10023.9 Mtoe. In terms of ECS, the proportion of global fossil energy consumption decreased steadily from 94.2% in 1965 to 85.6% in 2018. In general, the improvement of ECS is sluggish and less optimistic than expected, showing a mild reduction in the fossil energy proportion by 10% in the past 53 years. The percentage of renewable energy increased from <5% in 1965 to 14% in 2018. Looking into the internal structure of fossil energy consumption, the proportion of oil consumption ranked the top, fluctuating up and down around the level of 40%. In the 1970s, the fluctuation was significant and the proportion of oil reached the peak of more than 50%. Since 1980s, the overall proportion of oil use tends to decline steadily. The proportion of coal consumption varies from 25 to 40%. The proportion of natural gas consumption, as a clean and transitional energy, has been increased year by year, from 14.7% in 1965 to 24.1% in 2018. In views of different countries and regions, the ECS varies greatly. For example, during 2001 to 2018 the average proportion of coal in national primary energy consumption of China has been 68.7% (BP, 2019). This share is substantially higher than that of the Organization for Economic Co-operation and Development (OECD) countries, 19.8% and three of other four BRICS countries, 6.0% in Brazil, 14.2% in Russia, 54.6% in India, and 72.2% in South Africa over the same period. In general, Figure 1 shows that the global ECS has experienced a gradual improvement. However, different countries are of varied ECS evolution patterns due to different resources and technology conditions. An in-depth investigation on the national level is imperatively needed to understand the distributional patterns of ECS, i.e., whether differences in the ECS is diminishing over time and if convergence can be achieved.
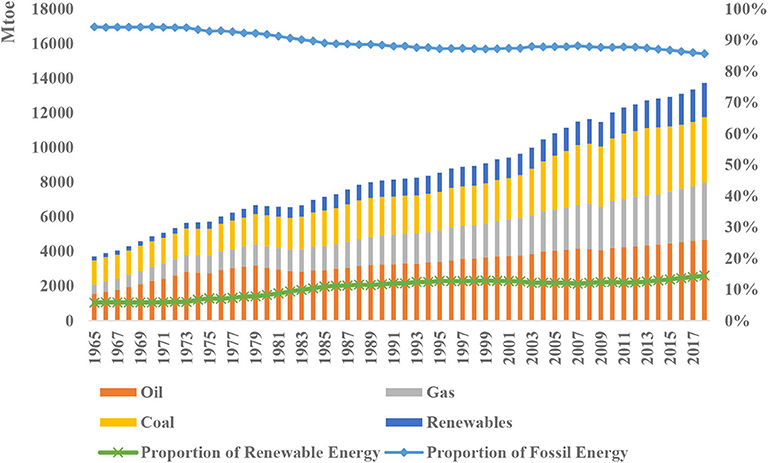
Figure 1. Evolution of global energy mix consumption and ESC structure Note: (Left Axis refer to the unit of Mtoe; Right Axis refer to the unit of percentage) Source: BP (2019).
Turning to the literature, there are two major strands of literatures related to this study: (1) Convergence concept (Section The Concept of Convergence), and (2) Related literatures on energy consumption and ECS (Section Related Literatures on Energy Consumption and ECS).
The Concept of Convergence
The concept of convergence, originating from the economic growth theories (Herrerias, 2012), has been widely introduced to various research domains such as energy and environmental economics study (Cheong et al., 2016, 2019). A growing number of studies has attempted to use the convergence concept to understand energy problems and phenomena. For example, Sheng and Shi (2013) explored the issue of how the ongoing integration of regional or global energy market contributes to the economic growth. The estimation results confirmed that a more integrated energy market has a positive effect on the convergence of income for a group of countries, contributing to equitable growth. By integrating the accumulation of physical capital and energy consumption among 50 states of the U.S, Burnett and Madariaga (2017) extended a neoclassical growth model to explore the policy implications for convergence in economic growth and energy intensity. The empirical findings show that energy intensity of the entire panel of 50 states has a convergence pattern over the past four decades. By means of difference in difference estimator (DID) on a panel data for 30 developing and 21 industrialized countries, Jakob et al. (2012) explored the dynamic patterns of energy use in the process of economic development over the period 1971–2005. Estimation results show that there is almost a one-to-one relationship between economic convergence and convergence of energy use patterns for developing countries. The findings indicate that the economic growth of developing countries has recently caught up the global average level and their energy use patterns are changing toward a more energy- or carbon-intensive than those in industrialized ones. Some scholars use this concept to explore various energy economics research themes, including energy intensity convergence, electricity consumption (Cheong et al., 2016, 2019), per capita energy consumption convergence (Fallahi and Voia, 2015; Payne et al., 2017) and energy market convergence in terms of prices (Ma and Oxley, 2012; Sheng and Shi, 2013).
In view of these previous studies, we would like to investigate if the level of income exerts impact on the convergence of energy consumption amongst countries. So our hypothesis is:
Hypothesis 1: The convergence pattern of energy consumption is not the same for different income groups.
We will investigate this issue by separating the countries into different income groups. Distribution dynamics analysis will then be conducted separately for each group, so that we can compare the convergence patterns of each group and know if they are the same.
Related Literatures on Energy Consumption and ECS
Compared with related topics such as convergence in per capita energy consumption (Mohammadi and Ram, 2012; Payne et al., 2017), and environment and growth (Le Pen and Sévi, 2010; Herrerias, 2012), the question of whether ESC converges across countries over time or not is a salient topic that has not been well-explored. For example, related studies on the topics of convergence in per capita energy use have emerged recently. Payne et al. (2017) explored the convergence properties of per capita renewable energy consumption across states of the U.S. and found that there is stochastic convergence of per capita renewable energy consumption for a majority of U.S. states. Combining parametric and non-parametric approaches, Mohammadi and Ram (2012) explored if per-capita energy consumption had converged across the states of the U.S. over the period 1970–2013. The estimation results support the lack of convergence in per-capita energy consumption across states of the U.S. and attribute the contributing factors to the significant variations in structural factors. Besides the related studies in the U.S., some study focused on the convergence in per capita energy use among OECD countries. However, there are no consistent findings. Using newly developed LM and RALS-LM (residual augmented least squares regression), Meng et al. (2013) investigated the convergence in per capita energy use among 25 OECD countries during 1960 to 2010. Their empirical findings provided a significant support for convergences existing among OECD countries. However, by means of different methods and same dataset with different timespan, Fallahi and Voia (2015) offered different findings. By constructing subsampling confidence intervals, they explored the convergence patterns in per capita energy consumption among 25 OECD countries over the period 1960–2012. Their findings reveal that the convergent pattern only exists in a limited number of countries, while other countries show either persistent or divergent patterns.
There has been a limited number of studies focusing on the evolution of ECS particularly at the regional or global level. By means of traditional time series approaches including cointegration tests and Granger causality tests, Feng et al. (2009) found that there is a temporal dynamic and casual relationships among ECS, economy structure and energy intensity during 1980–2006 in China. Proposing a bottom-up accounting model and constructing a long-range energy alternative planning energy modeling tool, Dong et al. (2017) projected the future trajectory of Chinese ECS evolution under multiple policies scenarios. Their research outcomes suggest that natural gas and renewables could develop into important alternatives to traditional fossil-based energy (coal and oil) and provide much more potentials. Lawrence et al. (2013) focused on the issue of the global probability distribution of energy consumption per capita around the world. Their research findings revealed that the Gini coefficient, decreased from 0.66 in 1980 to 0.55 in 2010, indicating a decrease in inequality. Using entropy information approach, Zhang et al. (2011) investigated the changes of China's ECS and found that Chinese ECS only experience slow and limited improvement. However, the links between ECS of different countries have been largely ignored in existing literature, and the evolution of the global ECS requires further investigation.
Given that gas is better than oil and coal in terms of greenhouse gas emission, we would like to investigate if the countries will change their ECS by increasing the use of gas, and reducing the consumption of oil and coal. So our second hypothesis is:
Hypothesis 2: The consumption of oil and coal will be reduced, and the use of gas will be increased in the future.
We will investigate this issue by conducting distribution dynamics analysis for the three energy sectors separately by employing ergodic distribution and mobility probability plots, so that we can understand future development of these three markets.
Summary of the Literature Review
A summary of the literature review is provided in Table 1. It can be observed that there has been limited research concerns on the dynamic aspects of ECS. Although the strand of parametric method-based study generates a summary of the statistic of interest, it neglects the important information on multimodal distribution, which may containment data and lead to misleading results (Quah, 1990, 1997). In addition, the traditional method cannot derive insightful understandings on the integral shape of the distribution and its dynamics (Quah, 1990, 1997).
Table 1. Major recent findings of relevant literature in this area.
To fill the gaps, this study applies the distribution dynamics approach. This method provides a lens to the transitional dynamics of ECS across time. This information will improve the understanding of intra-distribution energies across countries by global energy trade. The research findings can provide complete and insightful information on each spatial grouping by uncovering their distinguishing features in terms of ECS. Moreover, this method is powerful to project the shape of the distribution of ECS levels in the long term, which provides rich reference for the improvement of energy policy.
Data
The preliminary data were extracted from the Global Trade Analysis Project 10 database which is compiled by Purdue University. This is a Computable General Equilibrium model database which covers the years of 2004, 2007, 2011, and 2014. The database has 65 sectors and 141 countries and regions, and it covers almost all the important economies in the world. It is worth noting that the data are available for every year, so that a panel dataset which has no gap can be compiled; and this is a prerequisite for the distribution dynamics analysis which will be employed later in this study.
The main focus of this study is on energy market, therefore, the data of the coal, oil, and gas sectors were extracted from the database for further processing. For each year, total consumption values in the world (which are made up of consumption as intermediate goods and final consumption) of the three sectors were computed. These values were divided by total population in the globe to derive the average world consumption per capita for each sector. After that, total consumption per capita of each sector for each country/region was then divided by the average world consumption per capita of each sector in that particular year to compute the values of relative consumption per capita for the three sectors separately.
The data were used to conduct distribution dynamics analysis for each sector individually so as to provide an overview of the three markets. However, in order to understand the impacts of income level on the distributions of consumption in greater detail, the preliminary dataset was then further divided into smaller datasets according to the income level of the countries. The classification is according to the definition, proposed by the World Bank, which divides countries into four groups, namely, low, lower-middle, upper-middle, and high-income groups. The idea is to conduct distribution dynamics analysis on each of these smaller datasets so that one can fully understand the evolutionary trend within these countries. The analytical results derived from these smaller datasets can offer pertinent policy implications in formulating energy policies for the countries in a more specific way which takes into consideration the income level, and thus the level of economic development of each country. The results can also provide important information on the market changes of the three sectors, so that international co-operation can be properly recommended in mitigating carbon emissions. Please refer to Table 2 for a summary of the sources of data used.
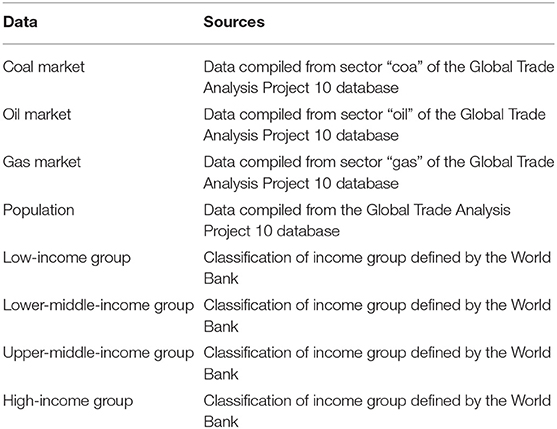
Table 2. Sources of data.
Method
The analysis is based on the transitional dynamics of the relative per capita consumption value of the three sectors in all the countries and regions compiled from the database. The distribution dynamics approach was first proposed by Quah (1993). This is a very useful tool for investigating evolution of distribution across time. Although time series econometrics is commonly used in forecasting, it can only provide information on several important characteristics of a distribution as it can only prepare a forecast of the dependent variable for the future. Given that distribution is a two-dimensional entity, it is impossible to prepare a forecast of the overall shape of the future distribution by relying on time series econometrics. Therefore, one can rely on distribution dynamics analysis which helps generate the shape of future distributions easily. Moreover, this approach can even offer the ergodic distribution which is the steady-state distribution for the future. By employing this analytical technique, one can gain a complete understanding of the underlying trend and also future evolution of the three markets. This analysis not only can fill an important gap in the literature, but also complement the findings from econometrics.
Distribution dynamics analysis can be broadly divided into two kinds, namely, the traditional Markov transition matrix analysis and the stochastic kernel approach. The former has the thorny issue of demarcation of the state which is associated with the selection of grid values. It is notable that this is an arbitrary process and the analytical results are dependent on the selection of grid line. On the contrary, the latter is deemed to be a much better tool since it can circumvent the issue of demarcation, therefore, the stochastic kernel approach is used in this study.
The bivariate kernel estimator is defined as:
where h1 and h2 are the bandwidths which are calculated based on the approach suggested by Silverman (1986), K is the normal density function, n is the number of observations, x is a variable representing the relative per capita consumption value of one of the three markets of a country/region at time t, y is a variable representing the relative per capita consumption value of one of the three markets of that country at time t+1, Xi,t is an observed value of relative per capita consumption value at time t, and Xi,t+1 is the observed value of relative per capita consumption at time t+1.
In order to take the sparseness of the data into consideration, an adaptive kernel with flexible bandwidth is employed (Silverman, 1986). Assuming that the process is first order and time invariant, and the distribution at time t +τ depends on t only and not on any previous distributions, then the relationship between the distributions at time t and time t +τ is shown as:
where ft+τ(z) is the τ-period-ahead density function of z conditional on x, gτ(z|x) is the transition probability kernel which maps the distribution from time t to t +τ, whilst ft(x) is the kernel density function of the relative per capita consumption distribution of one of the three markets at time t.
The ergodic density function, given that it exists, can then be calculated by:
where f∞(z) is the ergodic density function when τ is infinite. This is the steady-state equilibrium distribution in the long run.
Cheong and Wu (2018) developed the mobility probability plot (MPP) for interpreting mobility probability. This is an enhancement of the traditional tools of display of the stochastic kernel approach which are mainly based on the three-dimensional plots and the contour maps. Following the invention of this new tool, the MPP has been employed to analyze transitional dynamics in various research areas, such as industrial output (Cheong and Wu, 2018), energy markets (Wu et al., 2018a; Cheong et al., 2019), and also carbon dioxide emissions (Cheong et al., 2016; Wu et al., 2016).
The MPP can be constructed by computing p(x) which is calculated as the net upward mobility probability which can be represented by the following relationship:
The MPP shows the net upward mobility probability against the relative per capita consumption. It is worth noting that a positive value implies that the country will have a net probability of moving upwards in the future; whereas a negative value of net upward mobility probability implies that the country has a net probability of moving downwards within the distribution. Interested readers can refer to Cheong and Wu (2018) for technical details.
The scheme of this study is to calculate the relative per capita consumption of the three energy products for each country, followed by distribution dynamics analysis. Distribution dynamics analysis will be conducted for each market separately. Three-dimensional plot and contour map will be constructed to reveal the trend in the data, while ergodic distribution and MPP will be computed for uncovering the steady-state equilibrium and the movement of the countries within the distribution. After that, the whole dataset will be divided into smaller datasets according to the levels of income of the countries. Distribution dynamics analysis will then be conducted for each group of countries separately. However, in order to save space, only ergodic distribution and MPP will be employed in the analysis.
Results
The analysis results are shown below in two different sections. The first one depicts the transitional dynamics of the three sectors, while the second one illustrates the impacts of income levels on the distribution dynamics.
Overview of the Three Energy Markets and Its Distribution Dynamics
Although many countries have invested a lot of resources in research and development of new energy source and progress have been made; however, the most important energy sources nowadays are still coal, oil, and gas. It is thus important to understand the trend of these three energy markets, so that one can have a better understanding of the future demand in each sector. Distribution dynamics analysis is a suitable tool for this task as it can reveal the distributions of consumption of the three markets in great details.
In this section, the coal market will be discussed first, and the value used in this sub-section is the relative consumption per capita for coal; the second sub-section covers the relative consumption per capita for oil, and the last sub-section is based on the relative consumption per capita for gas.
The Coal Market
The three-dimensional plot of the coal market is shown in Figure 2A, while Figure 2B is the contour map. It can be observed from both figures that there is a very high peak situated in the region with a relative per capita coal consumption value below 0.2. Since the value of one represents the consumption level which is equal to the world average; therefore, a value much lower than 0.2 suggest that many countries just do not rely on coal but other forms of energy resources in the study period.
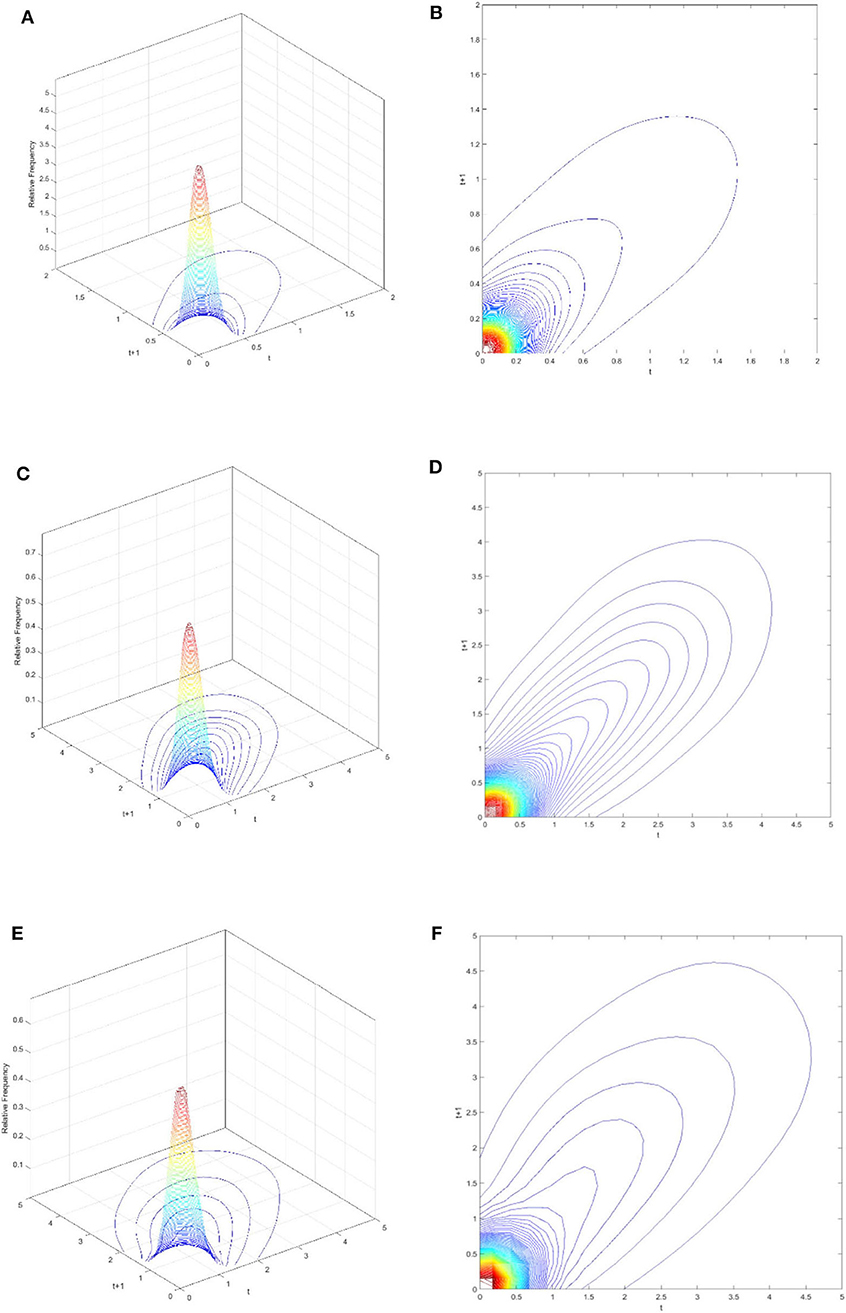
Figure 2. Three-dimensional plots and contour maps of the three markets. Note: (A,B) are for the coal market. (C,D) are for the oil market. (E,F) are for the gas market. For figures (A,C), and (E), the right axis represents time t, left axis represents time t+1, and height represents kernel density. For figures (B,D,F), horizontal axis represents time t, vertical axis represents time t+1. Source: Authors' calculation.
In order to provide a forecast into the future, one cannot rely on the three-dimensional plot and contour map alone. One needs to employ the ergodic distribution and the MPP too. Figure 3 shows the ergodic distribution and the MPP of the coal market. The ergodic distribution shown in Figure 3A is a heavily right-skewed one with a peak situated around a value of relative per capita coal consumption of 0.1. Since the ergodic distribution is the steady-state equilibrium distribution of the coal market, while the value of the world average is one, a peak situated at a value of 0.1 suggests that the consumption of coal is very low for a lot of the countries if the distribution dynamics remains unchanged. This is an encouraging finding as carbon dioxide emission per unit of energy output is the highest for the burning of coal, followed by oil, while gas has the lowest emission in the burning process amongst the three energy sources.
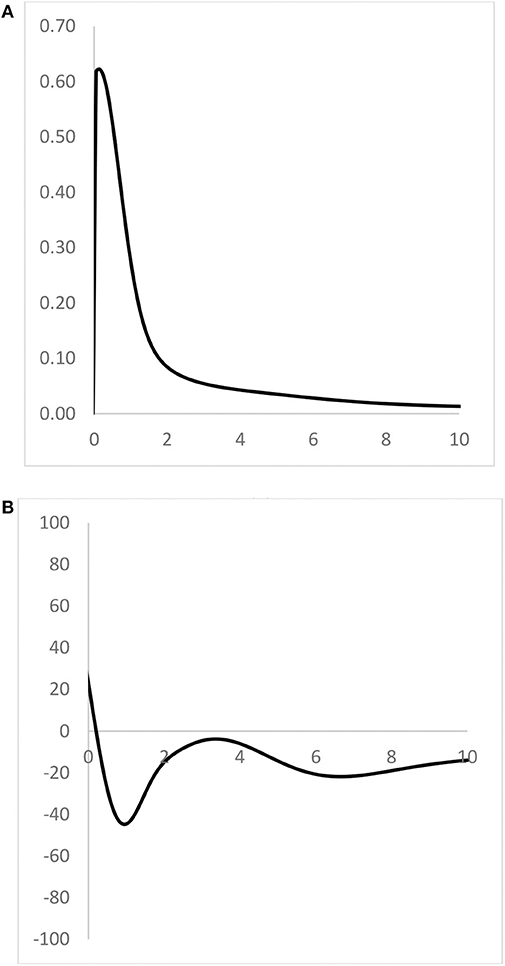
Figure 3. Ergodic distribution and MPP of the coal market for all countries. Note: For (A), horizontal axis represents relative per capita consumption, vertical axis represents proportion. For (B), horizontal axis represents relative per capita consumption, vertical axis represents MPP. Source: Authors' calculation.
Figure 3B shows the MPP of the coal market, one can observe that the MPP crosses the horizontal axis at a relative per capita coal consumption value of 0.1. In fact, it is the same value of the peak of the ergodic distribution. It is noteworthy that this is not a coincidence since a positive value of MPP suggests that the country has a higher probability in increasing the relative consumption of coal, while a negative value of MPP suggests that it has a higher tendency in reducing coal consumption; therefore, countries would gather around the value where the MPP crosses the horizontal axis, thereby creating the peak of the ergodic distribution. Hence the MPP is a very useful tool in analyzing distribution dynamics as it can reveal the trend behind the scene and the mechanics behind the changes in the distribution of consumption.
The MPP reaches the lowest point with a relative per capita coal consumption value of 0.9, as the average world consumption level is one, it means that for a country with coal consumption close to the world average level, it has a very high probability to decrease in its consumption in the future. In fact, it can be observed that the MPP lies under the horizontal axis from 0.14 onwards; it is a good sign as it suggests that many countries would tend to reduce their coal usage in the future. However, it is alarming to note that for the countries with a relative per capita coal consumption value around 3.8, they are very close to the horizontal axis, implying that they have a higher probability of increasing their coal consumption than the other countries even though the net probability is negative.
In order to observe the changes across time, the dataset was divided according to different time periods, so that the changes in the distribution dynamics can be studied in greater details. The results are provided in Figure 4. According to Figure 4A, the ergodic distribution generated from the data from 2004 to 2007 is observed to be more dispersed than the one based on the data from 2011 to 2014.
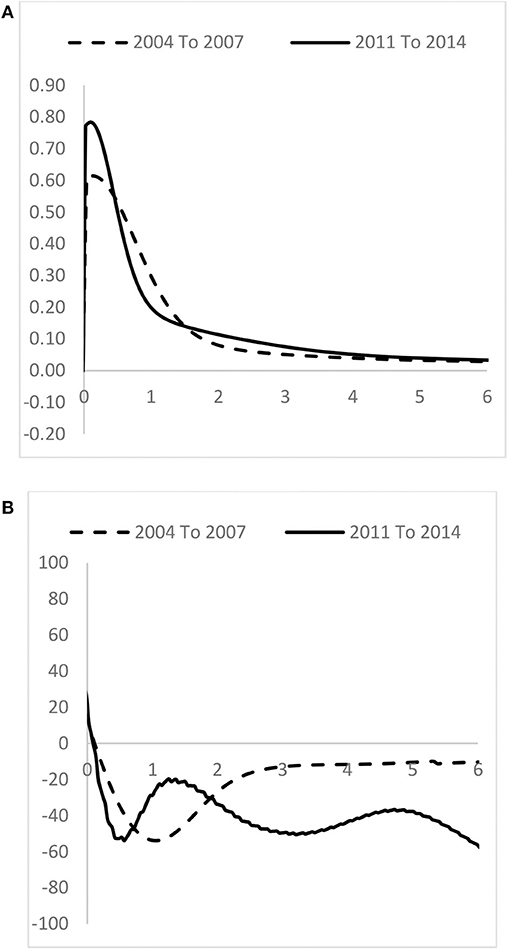
Figure 4. Comparison of the ergodic distributions and MPPs of the coal market for all countries across time. Note: For (A), horizontal axis represents relative per capita consumption, vertical axis represents proportion. For (B), horizontal axis represents relative per capita consumption, vertical axis represents MPP. Source: Authors' calculation.
The MPPs are shown in Figure 4B, by comparing the MPP of the period 2004 to 2007 with the one of the period 2011 to 2014, it can be concluded that the MPP of the second period lies lower than the first period for those countries with a relative per capita coal consumption values from 0 to 0.7 and above 2.0, thereby signifying that many countries would have a higher probability in reducing their consumption. However, the second period shows an increase in probability for a rise in coal consumption for those countries with a relative per capita coal consumption values from 0.7 to 2.0. Combining this observation with the finding derived from the changes of the ergodic distributions across time, one can conclude that there would be a reduction in relative coal consumption for most of the countries. Nevertheless, attention should be paid to those countries with a relative per capita coal consumption value from 0.7 to 2.0 which have demonstrated an upward trend in coal consumption.
The Oil Market
Turning to the oil market, Figure 2C shows the three-dimensional plot, and Figure 2D shows the contour map. It can be observed that the peak of the distribution also lies in a low value of relative per capita oil consumption, however, it is higher than the one of coal market. Another observation is that the outermost contour line reaches a relative per capita oil consumption value of 4.3 which is much higher than the outermost contour line of the coal market which has only a value of 1.6. The pattern of the oil market is more dispersed, and so it implies that the oil market is made up of countries from a more diverse background, with many countries having above-average consumption. In contrast, the coal market is limited to a few countries with comparatively similar characteristics. Another interesting fact derived from the contour map is that the contour map of the oil market is more dispersed than the one of the coal market, thereby suggesting that the oil market has higher variability in consumption.
The ergodic distribution and the MPP of the oil market are shown in Figure 5. Similar to the coal market, the peak of the ergodic distribution also lies in a low value of relative consumption even though the shape of the two distributions are very different. It is interesting to note that the MPP lies under the horizontal axis for almost all the values except for the values close to zero, therefore it suggests that a lot of the countries have a higher tendency to reduce their relative consumption in oil.
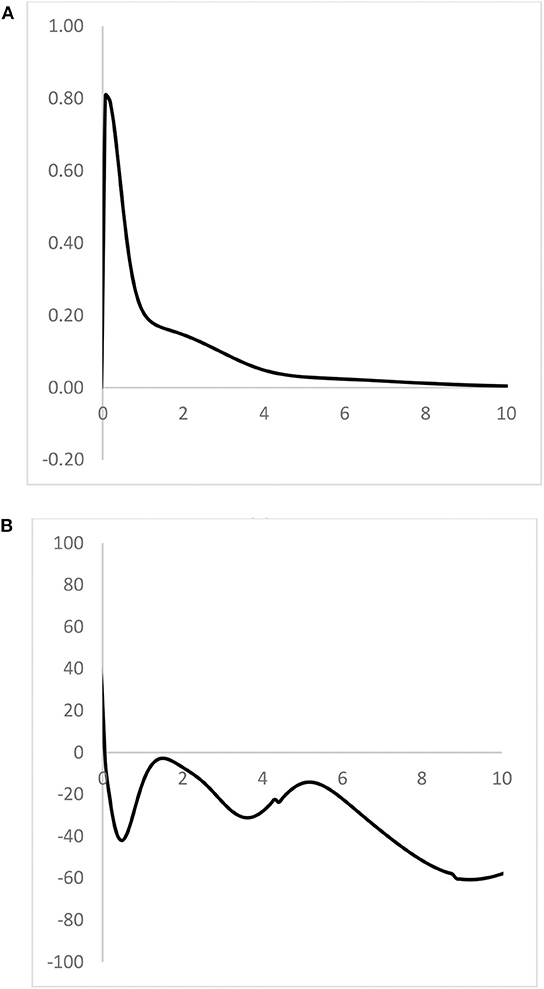
Figure 5. Ergodic distribution and MPP of the oil market for all countries. Note: For (A), horizontal axis represents relative per capita consumption, vertical axis represents proportion. For (B), horizontal axis represents relative per capita consumption, vertical axis represents MPP. Source: Authors' calculation.
The changes across time can be examined by Figure 6 which shows the ergodic distributions and MPP for the two different time periods. The convergence pattern of the ergodic distribution of the second period is more prominent than the one of the first period. This finding is supported by the fact that the MPP of the second period lies much lower than the MPP of the first period in almost all the values except the values from 0.3 to 0.9, from 2.1 to 2.8, and from 6.7 to 8.7. The two figures show that many countries have reduced their relative consumption in oil across time.
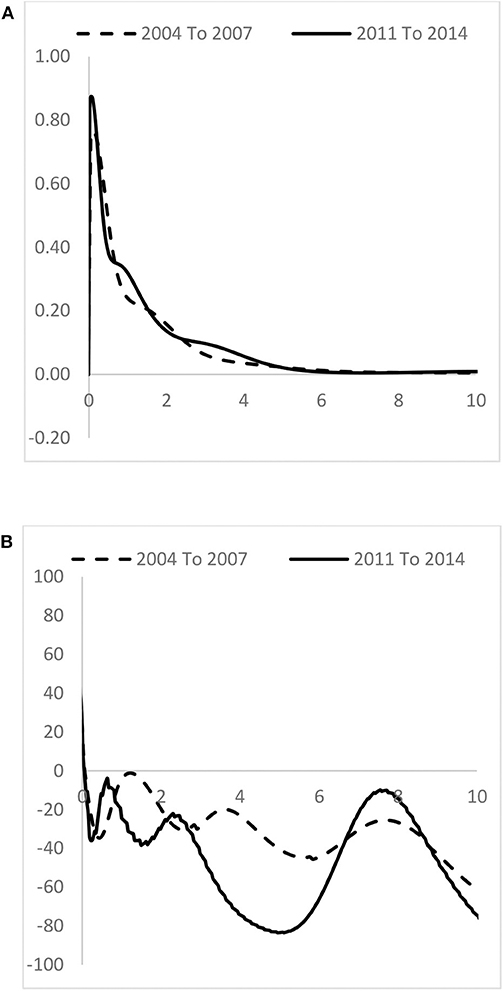
Figure 6. Comparison of the ergodic distributions and MPPs of the oil market for all countries across time. Note: For (A), horizontal axis represents relative per capita consumption, vertical axis represents proportion. For (B), horizontal axis represents relative per capita consumption, vertical axis represents MPP. Source: Authors' calculation.
The Gas Market
The evolutionary trend of the gas market can be examined from Figure 2. The shape of the probability mass as shown in Figures 2E,F is very similar to the one of the oil market, however, the shape is much more dispersed than the oil market as the outermost contour line is above the level of 4.5. It means that the constituents of the countries of the gas market are far more diverse and are made up of countries from very different backgrounds. Moreover, by comparing the different markets in Figure 2, it can be observed that both the contour maps of the coal market and the oil market are more concentrated around the 45-degree diagonal line than the one of the gas market. It is worth noting that the 45-degree diagonal line represents the case that the country will stay at the same level of relative per capita consumption value before and after the transition as if the t (current) and t+1 (future) values of the contour map are the same, then it is basically the 45-degree diagonal line. Since the shape of the gas market is more dispersed than the others, it suggests that the consumption of gas is subject to much higher variability. In contrast, the consumption levels of coal and oil markets are relatively more stable than the gas market, so that the consumption levels of coal and oil in a country are more similar to its previous consumption level in the past. This salient finding is important for the policy makers in formulating global policies for mitigating carbon emissions. Given that the gas market has a much variability in consumption, it implies that this market is comparatively more flexible than the coal and oil market. Thus, it is much easier to implement changes in the gas market for reducing carbon emissions.
Figure 7 shows the ergodic distribution and MPP of the gas market for all the countries. Some interesting findings can be derived from the ergodic distribution. First, similar to the other markets, the peak of the ergodic distribution also lies at a very low level of relative per capita gas consumption. Second, it can be observed that there is a smaller peak with a relative per capita gas consumption value of 0.6. Moreover, there is another peak which is situated at a relative per capita gas consumption value around 6. The multi-modal pattern of the ergodic distribution suggests the emergence of convergence clubs in the future. This finding is very important as it implies that the countries will congregate in certain clusters with similar levels of gas consumption.
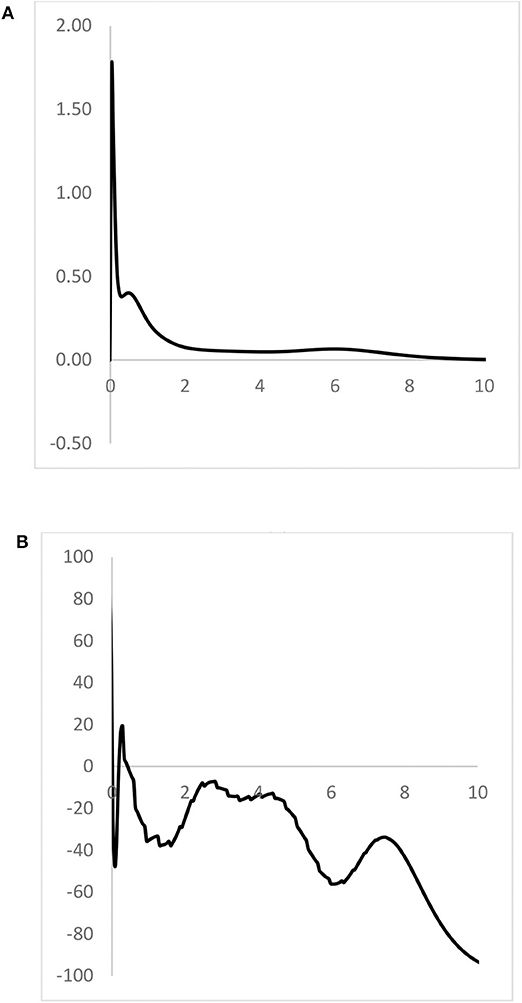
Figure 7. Ergodic distribution and MPP of the gas market for all countries. Note: For (A), horizontal axis represents relative per capita consumption, vertical axis represents proportion. For (B), horizontal axis represents relative per capita consumption, vertical axis represents MPP. Source: Authors' calculation.
The MPP of the gas market is also very different from the other markets, the MPP lies above the horizontal axis for the values of relative per capita gas consumption from 0.2 to 0.4. It means that for those countries having a relative consumption level of 0.2 to 0.4 of the world average, would have a higher probability in increasing their consumption of gas. This lends support to the shape of the ergodic distribution and the emergence of the convergence clubs as discussed above. This is an encouraging finding as gas is deemed to be the best energy source out of the three in terms of carbon dioxide emission per unit of energy output.
Figure 8 provides a comparison of the ergodic distributions and MPPs across time. Figure 8A shows that there is a significant change across time. The ergodic distribution changes from a two-modal shape into a dispersed one, thereby implying that there is an increase in the variability of the gas market. From Figure 8B, it can be observed that the MPP has also changed a lot as the latest period shows that the MPP lies above the horizontal axis for the values from 0 to 0.45, it suggests that the countries with a level of relative per capita gas consumption from 0 to 0.45 of the world average would increase their levels of consumption further in the future. Moreover, the countries with relative per capita gas consumption values from 1.1 and above also tend to have a higher probability in increasing their consumption than before. However, for those countries with relative per capita gas consumption values from 0.6 to 1.2, the MPP fell within the study period; in fact, the disappearance of the second smaller peak of the ergodic distribution in the first period can be explained by the change of MPP from positive values to negative for the range from 0.6 to 1.2.
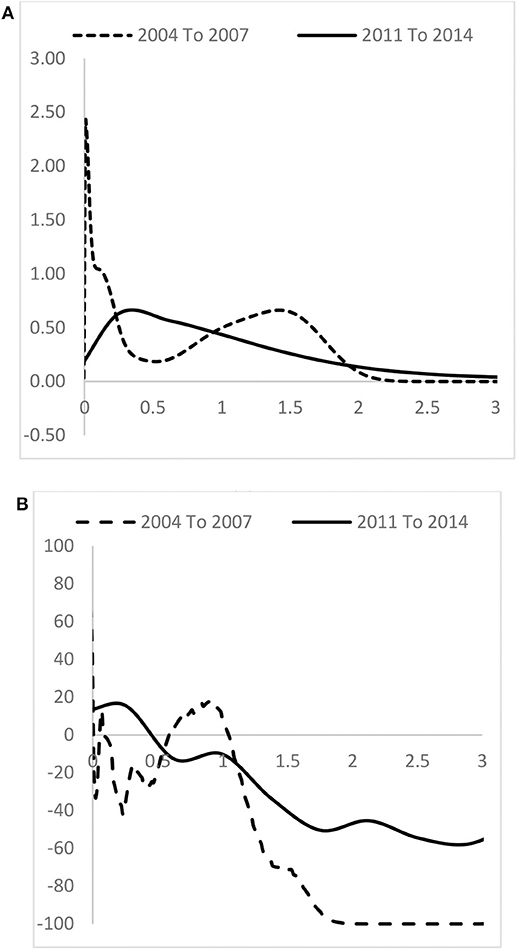
Figure 8. Comparison of the ergodic distributions and MPPs of the gas market for all countries across time. Note: For (A), horizontal axis represents relative per capita consumption, vertical axis represents proportion. For (B), horizontal axis represents relative per capita consumption, vertical axis represents MPP. Source: Authors' calculation.
By examining the MPPs and ergodic distributions of the three markets, we can conclude that hypothesis 2 is true, thereby confirming that the consumption of oil and coal will be reduced, and the use of gas will be increased in the future. Our findings corroborate with prior research findings reported by Dong et al. (2017) that gas will become an important alternative to coal and oil in the future. Moreover, our findings also support the conclusion drawn by Meng et al. (2013) that convergence in per capita energy use can be achieved in the long run; however, it is notable that the research conducted by Meng et al. (2013) only covers the OECD countries, while this study covers almost all the important economies in the world.
This concludes the first part of analysis in this paper by providing an overview of the recent pattern of the three energy markets and a forecast of the ergodic distributions in the long run along with the MPPs. However, in order to formulate effective energy polices for the countries, one has to take economic development into consideration. Therefore, the next subsection will be based on an investigation of the impacts of the income on the distribution dynamics of the three energy markets.
The Impacts of Income Levels on Distribution Dynamics
The previous section has provided a comprehensive analysis on the underlying trend and distribution dynamics of the three energy markets, however, in order to provide pertinent policy suggestions for reducing carbon dioxide emissions at a global level, it is necessary to analyze the relationship between income and the energy market.
Given that most of the poor countries are short of investment funds, they usually do not have the required resources to reform their energy structure; while the rich countries have plenty of resources at their disposal, so that they can change their energy structure and develop new types of energy if required. Therefore, a majority of the poor countries can only rely on their existing energy structure; in contrast, rich countries can exercise greater flexibility in selecting their ideal energy structure for the future. It is thus of interest to understand the impacts of income levels on the future development of the three energy markets. The results derived from this analysis not only can provide a guideline for formulating energy polices for countries of different levels of income and economic development, but can also offer crucial information on international aid policy in mitigating carbon dioxide emissions.
The full dataset was divided into four smaller datasets according to the classification of income as proposed by the World Bank. The countries were first categorized into the low, lower-middle, upper-middle, and high-income groups; and then distribution dynamics analyses were conducted on these four groups independently so as to examine this main issue in greater details.
Low-Income Countries
Figure 9 shows the ergodic distributions of the three energy markets and their MPPs for the low-income countries. According to Figure 9A, it can be observed that all the three markets would converge at an extremely low level of relative consumption. The highest values of the ergodic distributions of the oil and gas markets are situated below the relative per capita consumption value of 0.5, however, the coal market extends to the relative per capita consumption value of 0.7. It shows that inequality is very high, and the energy consumption levels of the poor countries are far below the global average level. Moreover, it can be observed that the ergodic distribution of the coal market is the most dispersed, followed by the oil market, and then the gas market.
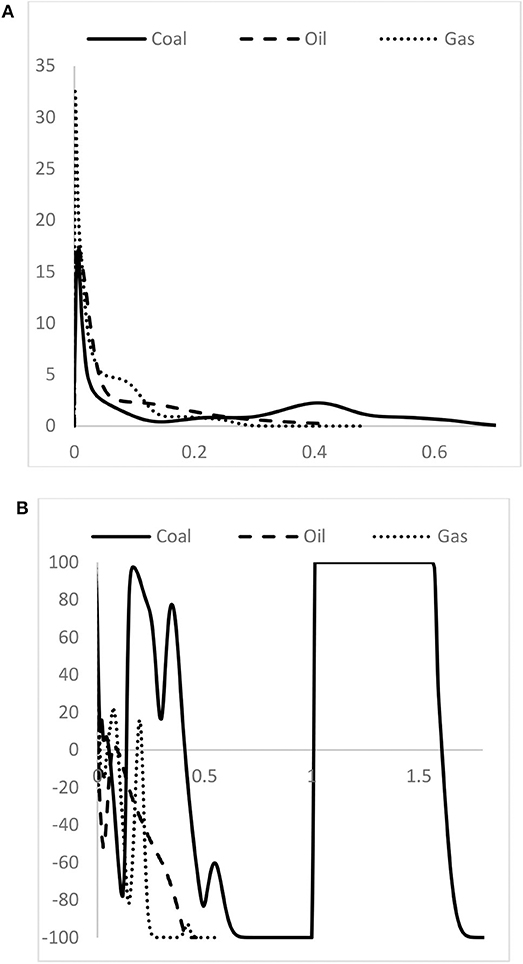
Figure 9. Comparison of the ergodic distributions and MPPs of the coal, oil, and gas markets for the low-income countries. Note: For (A), horizontal axis represents relative per capita consumption, vertical axis represents proportion. For (B), horizontal axis represents relative per capita consumption, vertical axis represents MPP. Source: Authors' calculation.
Turning to Figure 9B for the MPPs of the three markets, there are two important findings. First, both the MPPs of the oil and gas markets reach−100 around the relative per capita consumption value of 0.5, thereby indicating that the poor countries could not increase their consumption of oil and gas above half of the world average. As the MPP value is −100, it means that whenever the poor countries reach this threshold value, their consumption would be reduced in the future. Second, the MPP value of the coal market has two regions where the MPP value is very high, namely, the region with values from 0.1 to 0.4, and from 1.0 to 1.6. For the region from 1.0 to 1.6, the MPP value is 100, this is a worrisome sign as it means that the poor countries which have an above-average level of coal consumption would have a higher probability in increasing their consumption in the future.
In summary, both figures suggest that many poor countries would strongly rely on coal in the future, and they would increase their consumption even if their consumption levels are much higher than the world average.
Lower-Middle-Income Countries
Figure 10A shows that the ergodic distributions of the lower-middle-income countries bear resemblance to those of the low-income countries as the peaks of the three distributions are all situated below the global average. However, it can be observed that the right-hand tail of all the distributions now extend to the relative per capita consumption value of 5 in the figure. By comparing with the ergodic distributions of the low-income countries, it can be concluded that the level of energy consumption increases with the income level of the countries. One more interesting observation is that the ergodic distribution of the gas market is the most dispersed amongst the three, followed by the oil market, and then the coal market. It suggests that the variability of the oil and gas markets is very high amongst the lower-middle-income countries.
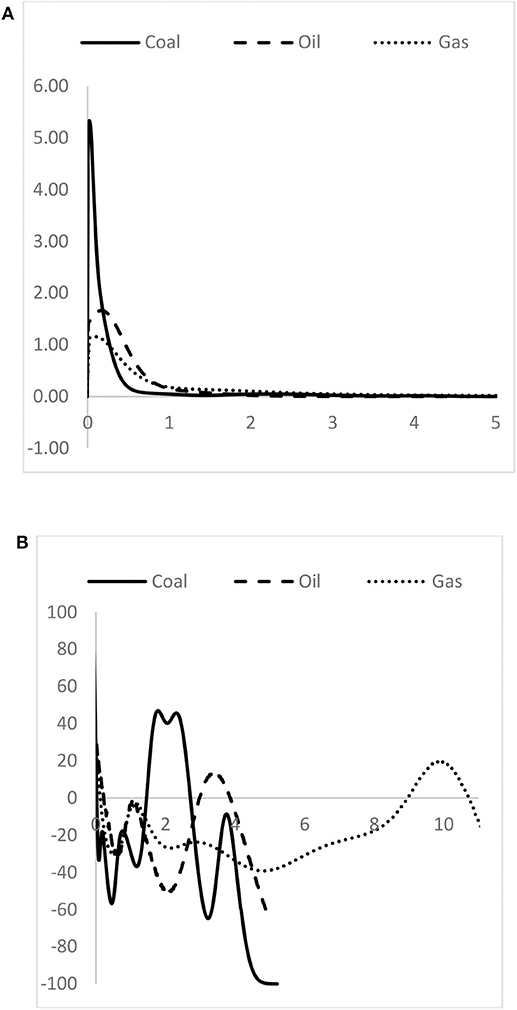
Figure 10. Comparison of the ergodic distributions and MPPs of the coal, oil, and gas markets for the lower-middle-income countries. Note: For (A), horizontal axis represents relative per capita consumption, vertical axis represents proportion. For (B), horizontal axis represents relative per capita consumption, vertical axis represents MPP. Source: Authors' calculation.
The MPPs of the three markets are shown in Figure 10B, it is notable that the MPP of the coal market is above the horizontal axis for the relative per capita consumption values from 1.5 to 2.6, thereby suggesting that these countries would have a higher tendency in increasing coal consumption. Similarly, the MPP of the oil market is above the horizontal axis for the relative per capita consumption values from 3.0 to 4.0, and the MPP of the gas market lies above the horizontal axis for the region from 9.0 to 11.0. This is an important finding as it suggests that for the middle-income countries, a few of them would increase their relative consumption even though their consumption levels are much higher than the world average. This phenomenon is the most apparent for gas (with values from 9.0 to 11.0), followed by oil, and then the coal market. The analysis further shows that the distribution dynamics of the three markets are very different.
Upper-Middle-Income Countries
Turning to the ergodic distributions of the upper-middle-income countries which are shown in Figure 11A, it can be observed that the right-hand tail of the distributions extends further to the right and reaches the relative per capita consumption value of 10 for the oil and gas markets, while the coal market reaches the relative per capita coal consumption value of 5.5. The shapes of the distributions are very similar to the ones of the lower-middle-income countries, of which the distribution of the gas market is the most dispersed, followed by the distribution of the oil market, and then finally, the coal market. Interestingly, this reveals the finding that the variability of consumption increases with income is still valid for the upper-middle-income countries.
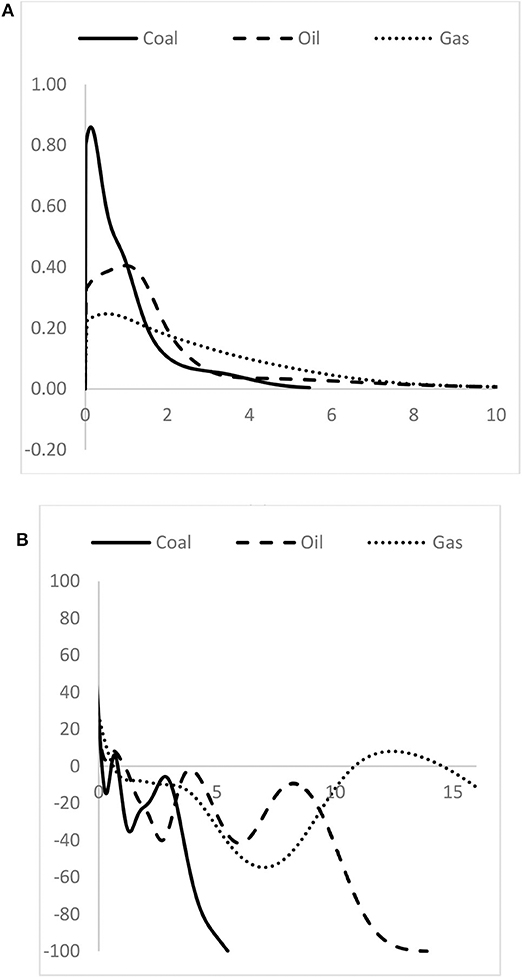
Figure 11. Comparison of the ergodic distributions and MPPs of the coal, oil, and gas markets for the upper-middle-income countries. Note: For (A), horizontal axis represents relative per capita consumption, vertical axis represents proportion. For (B), horizontal axis represents relative per capita consumption, vertical axis represents MPP. Source: Authors' calculation.
One important finding can also be derived from Figure 11A. The peak of the ergodic distribution of the oil market is observed to lie around the relative per capita oil consumption value of one, it means that many of the upper-middle-countries would consume a level of oil similar to the world average, and oil would remain to be a very popular energy source within the upper-middle-income countries.
Figure 11B shows that most of the MPPs lie below the horizontal axis except for the values within the region from 11.0 to 14.5 for the gas market, and for the relative per capita consumption values below one for the three markets. This lends support to the earlier findings that countries which have extremely high levels of gas consumption would have a high likelihood in increasing the consumption further in the future. In contrast, the MPP of the coal market lies under the horizontal axis except for very small relative per capita consumption values, thereby indicating that coal is not a preferred energy source for the upper-middle-income countries.
High-Income Countries
Turning to the high-income countries, Figure 12A shows the ergodic distributions of the three energy markets. Similar to the upper-middle-income countries, the shape of the ergodic distribution of the gas market is the most dispersed, followed by the oil market, and the last one is the coal market. Moreover, it can be observed that for the high-income countries, the oil market will converge to a relative per capita oil consumption value of 2.5 which is two and a half times above the world average. It shows that oil is a very important energy source for the high-income countries and the reliance is quite heavy.
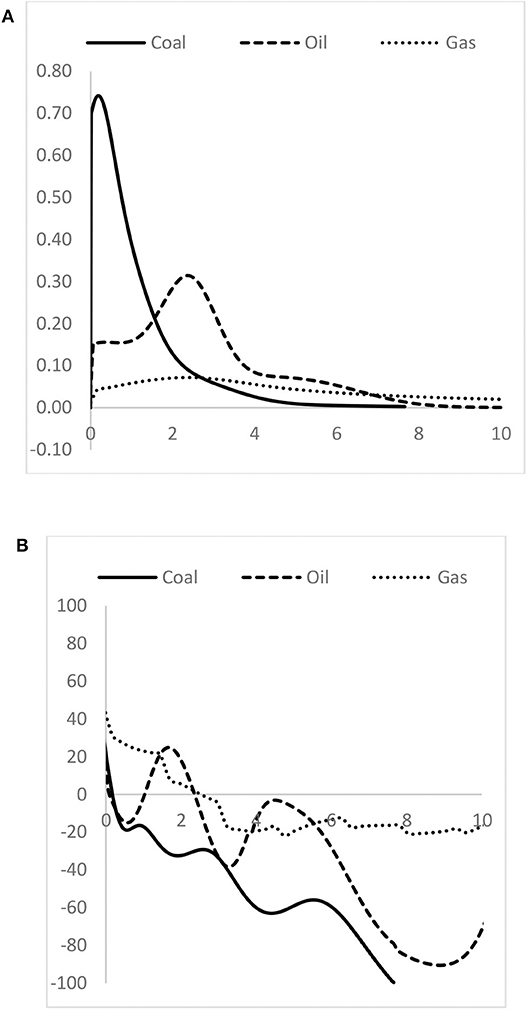
Figure 12. Comparison of the ergodic distributions and MPPs of the coal, oil, and gas markets for the high-income countries. Note: For (A), horizontal axis represents relative per capita consumption, vertical axis represents proportion. For (B), horizontal axis represents relative per capita consumption, vertical axis represents MPP. Source: Authors' calculation.
Figure 12B shows the MPPs of the three markets for the high-income countries. There are several interesting findings derived from this figure. First, the MPP of the coal market lies under the horizontal axis for nearly all its range save very small values. Second, the MPP of the gas market crosses the axis around a value of relative per capita gas consumption of 2.3. It indicates the consumption of gas for many high-income countries would increase in the future. The MPP of the oil market lies above the horizontal axis for the range from 1.0 to 2.3, and so it means that many above-average users of oil would also increase their consumption in the future. Given that the ergodic distribution is the steady-state distribution in the long run, the shape of the three distributions and the findings derived from the MPP analysis pinpoint the fact that, the consumption of oil and gas is increasing for the high-income countries, and it may be attributed to their income level which may allow them to adjust their energy structure in the long run.
By comparing the ergodic distributions and MPPs of the three energy sectors in different income groups, one can draw the conclusion that hypothesis 1 is true, thereby implying that the convergence pattern of energy consumption is not the same for the different income groups. Our findings corroborates those reported by Jakob et al. (2012) that convergence of energy use is related to the economic development of a country. Our findings also support another conclusion drawn by them which states that the convergence pattern of the industrialized countries is different from those of the developing countries.
Conclusions
The improvement in ECS is centrally important for the global society to fulfill the goal of green energy transition and to combat the adverse effects of global climate change. The aim of this study is to investigate the evolutionary trend and future development of the markets of three major energy commodities, namely, coal, oil, and gas. Distribution dynamics analyses were conducted on the Global Trade Analysis Project dataset which is made up of almost all the countries and regions in the world. The first part of the analysis is to provide an overview of the three markets, while the second part is based on a study focusing on the impacts of income on the distribution dynamics of the three markets.
Many important findings have been derived from this study. For an overview of the three markets, our findings show that coal consumption is not high for a lot of the countries and the MPP of the coal market shows that many countries would reduce their coal consumption in the future. In contrast, the oil market is made up of countries from a more diverse background, with many countries having above-average consumption, however, the MPP of the oil market also shows that many countries would reduce their relative consumption of oil in the future.
Finally, our findings reveal that the gas market has the highest variability amongst the three markets. It is an encouraging finding as it implies that it is far easier to implement change in the gas market in adjusting the energy structure for mitigating carbon emissions. From the ergodic distribution of the gas market, it can be observed that convergence clubs may emerge in the long run as the countries would congregate in certain clusters with similar levels of gas consumption.
The second part of the analysis is to evaluate the impacts of income on the distribution dynamics of the energy markets. Our findings demonstrate that the distribution dynamics is very different for the four income groups, and so it is necessary to take income level of a country into consideration in formulating energy policies. There are several pertinent findings. First, the range of the ergodic distribution increases with the income level. It reflects the issue of global inequality amongst the countries as the energy consumption of the poor countries are much lower than the other countries. Besides, since the poor countries are lacking of investment funds, they do not have many choices in their energy structure, and hence it is very difficult for them to change their existing energy structure. In contrast, as the affluent countries have more financial resources at their disposal, so they have higher flexibility in the energy structure which can be demonstrated by the higher variability of the ergodic distributions of the three markets.
One salient finding is that the MPPs of the oil and gas markets of the poor countries reach −100 for the relative per capita consumption value of 0.5, it means that the low-income countries could not increase their oil and gas consumption once it reaches the threshold of one half of the world average; moreover, the MPP of the coal market of the poor countries show that these countries have a higher probability in increasing their coal consumption even if they already have an above-average level of consumption.
Oil is deemed to be the most popular form of energy sources for the upper-middle-income and high-income countries, while coal is not a preferred energy source for the affluent countries. However, gas consumption seems to have a very high variability and the countries can have very different consumption patterns of gas even if they belong to the same income category. Furthermore, it is observed that for the lower-middle-income and upper-middle-income countries, the big consumers of gas tend to increase their gas consumption further. However, it is worth mentioning that the level of income is not the only factor affecting the distribution dynamics, and resource endowments also play a major role. A summary of the findings is provided in Table 3.
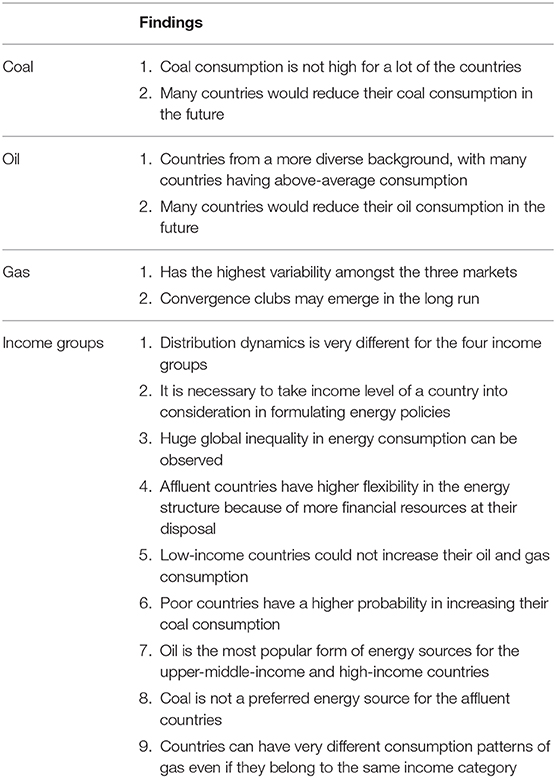
Table 3. Summary of major findings.
The findings derived from this study may prove valuable for the policy makers in formulating energy policies for adapting to market changes, and may assist the design of international aid program for mitigating carbon emissions for the poor countries. Several policy implications can be derived. First, as gas is better than oil and coal in terms of greenhouse gas emission, country-specific policies should be formulated for the development of the gas industry. Second, the variability of gas usage is very high, therefore, more resources should be diverted to the gas industry through further research and development activities. Third, the government should also encourage investment in these areas actively so as to mitigate greenhouse gas emission. Fourth, both developing and developed countries should work together, and international aid should be provided to the low-income countries for reducing the use of coal as these poor countries just do not have enough financial resources to change their current energy consumption structure.
This research study offers an innovative perspective for examining three important energy markets in the world. However, given that renewable energy sources have gained importance in recent years, it would be a good idea to conduct an analysis on these new energy sources when the data are available in the future. Another potential way for extending this study is to determine the proper ways for changing the energy consumption structure of the developing countries by employing econometrics analysis so as to mitigate greenhouse gas emission for the world.
Data Availability Statement
Publicly available datasets were analyzed in this study. This data can be found here: https://www.gtap.agecon.purdue.edu/.
Author Contributions
The contributions of the authors are the same. They contribute in different areas, but the work load is shared equally among them.
Funding
The authors are grateful for the financial support from the National Natural Science Foundation of China (No. 71904009), the MOE (Ministry of Education in China) Project of Humanities and Social Sciences (No. 18YJC840041).
Conflict of Interest
The authors declare that the research was conducted in the absence of any commercial or financial relationships that could be construed as a potential conflict of interest.
References
Augutis, J., Martišauskas, L., and Krikštolaitis, R. (2015). Energy mix optimization from an energy security perspective. Energ. Convers. Manage. 90, 300–314. doi: 10.1016/j.enconman.2014.11.033
BP (2019). 2019-06. Statistical Review of World Energy. Available online at: https://www.bp.com/en/global/corporate/energy-economics/statistical-review-of-world-energy.html (accessed August 25, 2019).
Burnett, J. W., and Madariaga, J. (2017). The Convergence of U.S. state-level energy intensity. Energy Econ. 62, 357–370. doi: 10.1016/j.eneco.2016.03.029
Çelikbilek, Y., and Tüysüz, F. (2016). An integrated grey based multi-criteria decision making approach for the evaluation of renewable energy sources. Energy 115, 1246–1258. doi: 10.1016/j.energy.2016.09.091
Chen, J., Wu, Y., Xu, C., Song, M., and Liu, X. (2019). Global non-fossil fuel consumption: driving factors, disparities, and trends. Manage. Decis. 57, 791–810. doi: 10.1108/MD-04-2018-0409
Cheong, T. S., and Wu, Y. (2018). Convergence and transitional dynamics of china's industrial output: a county-level study using a new framework of distribution dynamics analysis. China Econ. Rev. 48, 125–138. doi: 10.1016/j.chieco.2015.11.012
Cheong, T. S., Wu, Y., and Wu, J. (2016). Evolution of carbon dioxide emissions in chinese cities: trends and transitional dynamics. J. Asia Pac. Econ. 21, 357–377. doi: 10.1080/13547860.2016.1176642
Cheong, T. S., Li, V. J., and Shi, X. (2019). Regional disparity and convergence of electricity consumption in China: a distribution dynamics approach. China Econ. Rev. 58:101154. doi: 10.1016/j.chieco.2018.02.003
Dong, K.-Y., Sun, R.-J., Li, H., and Jiang, H.-D. (2017). A review of China's energy consumption structure and outlook based on a long-range energy alternatives modeling tool. Petrol. Sci. 14, 214–227. doi: 10.1007/s12182-016-0136-z
Fallahi, F., and Voia, M.-C. (2015). Convergence and persistence in per capita energy use among OECD countries: revisited using confidence intervals. Energy Econ. 52, 246–253. doi: 10.1016/j.eneco.2015.10.004
Feng, T., Sun, L., and Zhang, Y. (2009). The relationship between energy consumption structure, economic structure and energy intensity in China. Energy Policy 37, 5475–5483. doi: 10.1016/j.enpol.2009.08.008
Herrerias, M. J. (2012). World energy intensity convergence revisited: a weighted distribution dynamics approach. Energy Policy 49, 383–399. doi: 10.1016/j.enpol.2012.06.044
Hu, Y., Peng, L., Li, X., Yao, X., Lin, H., and Chi, T. (2018). A novel evolution tree for analyzing the global energy consumption structure. Energy 147, 1177–1187. doi: 10.1016/j.energy.2018.01.093
Jakob, M., Haller, M., and Marschinski, R. (2012). Will history repeat itself? Economic convergence and convergence in energy use patterns. Energy Econ. 34, 95–104. doi: 10.1016/j.eneco.2011.07.008
Kahia, M., Aïssa, M. S. B., and Charfeddine, L. (2016). Impact of renewable and non-renewable energy consumption on economic growth: new evidence from the MENA Net Oil Exporting Countries (NOECs). Energy 116, 102–115. doi: 10.1016/j.energy.2016.07.126
Lawrence, S., Liu, Q., and Yakovenko, V. (2013). Global inequality in energy consumption from 1980 to 2010. Entropy 15, 5565–5579. doi: 10.3390/e15125565
Le Pen, Y., and Sévi, B. (2010). On the non-convergence of energy intensities: evidence from a pair-wise econometric approach. Ecol. Econ. 69, 641–650. doi: 10.1016/j.ecolecon.2009.10.001
Li, Y., Wei, Y., Shan, S., and Tao, Y. (2018). Pathways to a low-carbon economy: estimations on macroeconomic costs and potential of carbon emission abatement in Beijing. J. Clean. Prod. 199, 603–615. doi: 10.1016/j.jclepro.2018.07.093
Liang, J., and Zhang, L. (2009). Analysis on spatial distribution characteristics of urban energy consumption among capital cities in China. Resour. Sci. 31, 2086–2092. doi: 10.1007/978-3-642-00205-2_9
Ma, H., and Oxley, L. (2012). The emergence and evolution of regional convergence clusters in China's energy markets. Energy Econ. 34, 82–94. doi: 10.1016/j.eneco.2011.02.015
Meng, M., Payne, J. E., and Lee, J. (2013). Convergence in per capita energy use among OECD countries. Energy Econ. 36, 536–545. doi: 10.1016/j.eneco.2012.11.002
Mohammadi, H., and Ram, R. (2012). Cross-country convergence in energy and electricity consumption, 1971–2007. Energy Econ. 34, 1882–1887. doi: 10.1016/j.eneco.2012.08.001
Ozturk, M., and Yuksel, Y. E. (2016). Energy structure of Turkey for sustainable development. Renew. Sust. Energy Rev. 53, 1259–1272. doi: 10.1016/j.rser.2015.09.087
Payne, J. E., Vizek, M., and Lee, J. (2017). Is there convergence in per capita renewable energy consumption across US States? Evidence from LM and RALS-LM unit root tests with breaks. Renew. Sust. Energy Rev. 70, 715–728. doi: 10.1016/j.rser.2016.11.252
Quah, D. (1990). Galton's fallacy and tests of the convergence hypothesis. Scand. J. Econ. 95, 427–443. doi: 10.2307/3440905
Quah, D. (1993). Empirical cross-section dynamics in economic growth. Eur. Econ. Rev. 37, 426–434. doi: 10.1016/0014-2921(93)90031-5
Quah, D. (1997). Empirics for growth and distribution: stratification, polarization, and convergence clubs. J. Econ. Growth 2, 27–59. doi: 10.1023/A:1009781613339
Sheng, Y., and Shi, X. (2013). Energy market integration and equitable growth across countries. Appl. Energy 104, 319–325. doi: 10.1016/j.apenergy.2012.10.043
Silverman, B. W. (1986). Density Estimation for Statistics and Data Analysis. New York, NY: Chapman and Hall.
Thangavelu, S. R., Khambadkone, A. M., and Karimi, I. A. (2015). Long-term optimal energy mix planning towards high energy security and low GHG emission. Appl. Energy 154, 959–969. doi: 10.1016/j.apenergy.2015.05.087
Wei, Y., Li, Y., Wu, M., and Li, Y. (2019a). The decomposition of total-factor CO2 emission efficiency of 97 contracting countries in Paris Agreement. Energy Econ. 78, 365–378. doi: 10.1016/j.eneco.2018.11.028
Wei, Y., Zhu, X., Li, Y., Yao, T., and Tao, Y. (2019b). Influential factors of national and regional CO2 emission in China based on combined model of DPSIR and PLS-SEM. J. Clean. Prod. 212, 698–712. doi: 10.1016/j.jclepro.2018.11.155
Wu, J., Wu, Y., Cheong, T. S., and Yu, Y. (2018a). Distribution dynamics of energy intensity in Chinese cities. Appl. Energy 211, 875–879. doi: 10.1016/j.apenergy.2017.10.097
Wu, J., Wu, Y., Guo, X., and Cheong, T. S. (2016). Convergence of carbon dioxide emissions in Chinese cities: a continuous dynamic distribution approach. Energy Policy 91, 207–219. doi: 10.1016/j.enpol.2015.12.028
Wu, Y., Zhu, Q., and Zhu, B. (2018b). Comparisons of decoupling trends of global economic growth and energy consumption between developed and developing countries. Energy Policy 116, 30–38. doi: 10.1016/j.enpol.2018.01.047
Yang, Z., Shao, S., Yang, L., and Miao, Z. (2018). Improvement pathway of energy consumption structure in China's industrial sector: from the perspective of directed technical change. Energy Econ. 72, 166–176. doi: 10.1016/j.eneco.2018.04.003
Keywords: energy consumption structure (ECS), transitional dynamics approach, global energy transition, transitional dynamics, climate change
Citation: Wei Y, Chung KHK, Cheong TS and Chui DKH (2020) The Evolution of Energy Market and Energy Usage: An Application of the Distribution Dynamics Analysis. Front. Energy Res. 8:122. doi: 10.3389/fenrg.2020.00122
Received: 10 January 2020; Accepted: 19 May 2020;
Published: 19 June 2020.
Edited by:
Farhad Taghizadeh-Hesary, Tokai University, JapanReviewed by:
Stanislav Martinat, Cardiff University, United KingdomJay Zarnikau, University of Texas at Austin, United States
Copyright © 2020 Wei, Chung, Cheong and Chui. This is an open-access article distributed under the terms of the Creative Commons Attribution License (CC BY). The use, distribution or reproduction in other forums is permitted, provided the original author(s) and the copyright owner(s) are credited and that the original publication in this journal is cited, in accordance with accepted academic practice. No use, distribution or reproduction is permitted which does not comply with these terms.
*Correspondence: Tsun Se Cheong, amFtZXNjaGVvbmdAaHN1LmVkdS5oaw==