 Yinhe Bu1,2
 Xingping Zhang1,3*
- 1School of Economics and Management, North China Electric Power University, Beijing, China
- 2Beijing Key Laboratory of New Energy and Low-Carbon Development, North China Electric Power University, Beijing, China
- 3Research Center for Beijing Energy Development, Beijing, China
The new renewable portfolio standard policy issued by China on May 2019 stipulates a specific promotion scheme of a quota obligation mainly on power supply companies and power consumers to sell or buy an increasing proportion of their electricity from renewable energy sources. The quota is essentially switched from the supply side to the demand side and will be provincially distributed and assessed, consequently motivating the provincial power system to accommodate a more renewable energy power. This paper proposes a prospect analysis by assessing the completion pressure of a newly modified quota in 30 provinces across Mainland China. The results show that 17 provinces enjoy the challenging completion pressure, while 10 provinces make it relatively easy to complete. Structural data analysis toward the provincial power supply structure and electricity balance is then put forward and reveals unfavorable factors for activating completion potential. Systematical measures are correspondingly introduced from the supply side, grid side, and demand side of the power system, with accompanying policy implications toward the core position of the power grid corporation and coordinated market-based mechanism simultaneously proposed.
Introduction
According to the International Renewable Energy Agency (IRENA), high curtailment has been reported in China in parallel with the rapid deployment of variable renewable energy over the past decade, while a set of actions has contributed to accommodating increasing shares of solar and wind, substantially decreasing the curtailment levels as a result. The curtailment rate from 2015 to 2016 achieves its highest level and typically reflects many problems for China's power system in integrating and accommodating renewable energy. Though the average curtailment rates of solar and wind have dropped to 1.9 and 4.2%, respectively, by the end of September 2019, the penetration rate of renewables is still 18.4% lower than its target in 2035 (60%), while the non-fossil energy consumption rate is 5.7% away from its target in 2030 (20%). To integrate more than half of generation from renewables and support further sustainable development of a renewable energy, a more powerful plan-oriented policy, together with a coordinating market-oriented mechanism, is needed (He et al., 2016).
Renewable portfolio standard (RPS) policy is the main promotion scheme of a quota obligation on electricity suppliers to supply an increasing proportion of their electricity from renewable sources, usually structured as a quantity regulation and, in most cases, accompanied with tradable green certificates (TGC) created by the government to track the fulfillment of quotas (Zhang et al., 2017). It was first carried out in 1983, and about 25 countries, including Australia, the United States, Italy, Britain, the Netherlands, Belgium, Denmark, and Japan, have implemented different forms of RPS. It has been proven to be one of the most compulsive policy tools toward promoting the development of renewable energy, especially throughout the representative implementation of California and Texas in the United States. Rouhani et al. (2016) and Bento et al. (2018) evaluated the main effects of introducing RPS from electricity prices, greenhouse gas (GHG) emissions, criteria pollutant emissions, the electricity generation mix, the labor market, renewable investment decisions, and social welfare. Similarly, great changes that will happen to China's power supply structure, emissions reduction, and governmental expenditure on subsidies when RPS together with TGC is practically adopted were illustrated by Feng et al. (2018) and Zhang et al. (2018). The special effect toward cutting curtailment and promoting the accommodation of photovoltaic (PV) and wind power in China was also separately proven by Zhang et al. (2017).
Evolution for the introduction and localization of RPS in China could be divided into two stages. It was firstly introduced in 2007, beginning with assessing electricity suppliers on the quota of renewable energy's installed capacity and generating electricity and had delivered large construction booms on the supply side. However, its effect toward accommodating renewable energy power was undesirable because of the mismatch between construction and accommodation. Then, the assessment subject and index were switched from the supply side to the demand side during evolution of the RPS scheme from NEA (2018a,b,c). In May 2019, the final amendment issued as “Notice on guarantee mechanism of renewable energy power accommodation” was published (NEA, 2019a). It stipulated that the RPS target will be annually distributed, provincially implemented, and assessed. The assessment subjects will turn to the power supply company together with power users, and the assessment index will directly concentrate on the accommodation rate of renewable energy power (REP) and non-hydro renewable power (NREP) in the total provincial electricity consumption. The newest notice announced the official launch of the demand side-based provincial RPS in China.
After the quota obligation was imposed on the demand side, studies mainly focused on analyzing the impacts of the policy portfolio concerning RPS, TGC, emission trading, carbon trading, and feed-in tariff (FIT), represented by Zuo et al. (2019) and Li et al. (2018). Yet, rare detailed research drew attention to the following three questions. Which provinces in China are possible to complete their obligated quota while other provinces are under a relatively high completion pressure? How many unfavorable factors against activating the accommodation potential hide behind a complicated provincial power supply structure and electricity balance? What kinds of measures are suitable for different provinces in order to release the accommodation potential? This paper aims to answer these questions and seek out a pathway for ensuring effective implementation of the new provincial non-hydro renewable portfolio standard in China. Besides, the background of RPS implementation in China is quite different from other countries thanks to the characteristics of the supply side, grid side, and demand side of the power system (Chen et al., 2018). The RPS in China must be fulfilled within unique ways regarding the lessons learned from the South Korean government's failure in deploying its RPS policy due to blindly copying international experience (Yoon and Sim, 2015). The unique pathway proposed in this paper also provides references for all responsible or related subjects, including the provincial government, the central government, the provincial power grid corporations and their power supply companies, independent power supply companies, enterprises which possess captive power plants, and all kinds of electricity suppliers, to form their RPS completion schemes.
This paper presents a prospect analysis beginning with illustrating an assessment index of provincial RPS completion and highlights in overviewing provincial completion pressure, then proposes a structural data analysis framework to find out favorable factors hiding behind the provincial power supply structure and electricity balance structure, describes how to improve completion conditions for the obligated quota in different or similar provinces, and provides practical experiences from China to optimally integrate the RPS scheme with the physical power system and other energy policies. This paper focuses on the RPS completion in 30 provincial administrative regions (Tibet is not contained in the assessment) across Mainland China and is organized as follows. Section framework and Prospect Analysis introduces the assessment mechanism for provincial RPS completion and then overviews its implementation prospect by analyzing provincial completion pressure. Section Unfavorable Factors Against RPS Completion identifies several unfavorable factors for RPS completion from structural data analysis toward provincial electricity balance and provincial power supply structure. Section Practical Experience From China empirically illustrates the measures closely related to raising the assessment index of RPS or activating accommodation potential, with their measure characteristics and applicable provinces simultaneously listed. Section Conclusions concludes the paper.
Framework and Prospect Analysis
Framework of This Paper
The major analysis framework consists of two important parts. One is prospect analysis based on the completion pressure for the obligated quota. The other one is unfavorable factor analysis based on structural data related to NREP accommodation, provincial power supply structure, and electricity balance. The data availability and validity, together with the feasibility and rationality of the analysis methods proposed in this paper, are simply explained. The estimated completion prospect reveals differences among the provinces across the Chinese Mainland and further leads to finding out the unfavorable factors against activating the accommodation potential. Based on the results of these two analyses, this paper further summarizes empirical measures from the supply side, grid side, and demand side of China's physical power system and illustrates a unique pathway for future RPS implementation combined with experiences from China's practice and other countries.
Assessment Mechanism for Provincial RPS Completion1
Provincial Quota Distribution
The distributed quota for province i in assessment year t will be annually calculated and determined 1 year before using Equation (1).
where is the predictable amount of the locally absorbed accommodation 1 year before which will be generated inside province i in year t; is the predictable amount of the locally absorbed accommodation which will be imported outside province i in year t; and is the predictable amount of electricity consumption for province i in year t.
Overall Assessment for a Province
According to the newest RPS scheme issued in May 2019, the overall completion progress of the obligated quota for a province is defined as RPS completion. Both amount index and proportion index of RPS completion are assessed by Equations (2) and (3).
where is the amount index of RPS completion for province i in year t; is the proportion index of RPS completion for province i in year t; is the physical accommodation of renewable energy electricity for province i in year t, which is reflected in the provincial electricity balance; is the total assigned amount of tradable accommodation purchased by all subjects located in province i; is the total equivalent amount of accommodation corresponding to the voluntary green certificates purchased by all subjects located in province i; is the part of electricity consumption which is closely related to public welfare and declared to be out of assessment for province i in year t; and is the annual electricity consumption in the whole province i for year t.
Single Assessment for a Responsible Subject
The provincial quota distributed by the NEA will be further undertaken by all responsible subjects located in the same province. The responsible subjects involved in this demand side-based assessment can be divided into two categories. One is collectively called the power supply company, including the independent power supply company that possesses no operation right of the distribution network and the dependent one which belongs to a power grid corporation and directly supplies power to end users. The other one is collectively called the power consumer, including those who directly purchase electricity through a wholesale electricity market and enterprises that possess their captive power plants. All the involved subjects must correspondingly buy (or sell) the same or higher proportion of renewable energy power in their total power purchase (or sale) as the obligated quota for their located province. All the identified RPS completion of a single responsible subject contributes to the total RPS completion of a province.
In particular, the tradable part accompanying the physical assessment consists of two alternatives. One is to purchase the surplus accommodation from market entities whose physical RPS completion has exceeded their obligated one. The other is to voluntarily purchase TGC from green power suppliers with its correspondingly equivalent amount of accommodation be recorded as supplementary RPS completion.
The completion progress of the obligated quota for a single responsible subject is assessed using Equations (4) and (5).
where is the amount index of RPS completion for subject j in year t; is the proportion index of RPS completion for subject j in year t; is the actual purchases of renewable energy electricity for power user j in year t; is the actual sales of renewable energy electricity for power supply company j in year t; is the assigned amount of directly purchased accommodation for subject j in year t; is the equivalent amount of accommodation corresponding to the voluntary green certificates purchased by subject j in year t; is the part of electricity which is generated and simultaneously consumed by subject j itself in year t; is the part of electricity which is declared to be out of assessment for subject j in year t; and and are the total purchases and the total sales of electricity, respectively, for subject j in year t. τ is set to be 0 when subject j is a power supply company and set to be 1 when subject j is a power user.
Relationships Between RPS and TGC
TGC is usually considered as the certificate for consuming renewable energy and provides the only market-oriented alternative for subjects to complementarily complete their obligated quota. However, this RPS scheme issued in China provides two market-oriented alternatives for RPS completion, voluntary TGC to RPS is not as important as public imagination. The relationship between RPS and TGC seems to be more independent.
Besides, due to the relatively unenforceable TGC, joint administrative punishment and bad credit record substitute the economic compensation that is once forced to be paid, for those provinces which can neither absorb enough physical accommodation nor finally buy or sell enough tradable accommodation. This characteristic further reduces TGC's economic influence on RPS, making RPS implementation less reliable to TGC. Last but not least, TGC is still an important part of this RPS scheme because provinces would either raise actual accommodation capability and physically accommodate more NREP, or encourage responsible subjects to purchase enough amount of tradable RPS completion whether through a direct assigned transaction of accommodation or a voluntary subscription of TGC to complete or exceed the obligated quota.
Assessment Index for Completion Pressure
The NEA has been monitoring and evaluating the provincial accommodation of renewable energy power in China for 4 years, which means that the available official data of the total provincial accommodation and its proportion in electricity consumption from 2015 to 20182 can be directly quoted from the “Report on the monitoring and evaluation of national renewable energy and electricity development” annually issued by the NEA. Equation (6), defined according to these annual reports, is used here to estimate the changing trend of the important parameters in the overall assessment for provincial RPS completion, such as and .
where is the accommodation rate of non-hydro renewable energy electricity for province i in year t.
These reports reveal a fact that the most serious curtailment problem appears in 2015 and 2016 and begins to decline in 2017. Our investigation toward Inner Mongolia, Qinghai Province, and Gansu Province was also organized in 2016 and 2017. In addition, data for some provinces in 2018 were calculated using a different statistical method. Therefore, the data from 2015 to 2017 are the most representative for reflecting problems. Data in 2018 are used here to compare with our prediction. Both the amount and proportion data for the provincial accommodation of non-hydro renewable energy electricity from 2015 to 2017 are listed in Table 1.

Table 1. Evolution of the non-hydro RPS target and accommodation rate, 2015–2017a.
The assessment index for completion pressure is defined to reflect the difficulty in completing the obligated quota. Analysis in this section chooses data from 2015 to 2017 as a representative. Though provincial electricity consumption and the corresponding accommodation rate 2 years later could not be precisely predicted via data in 2015 due to various uncertainties, Equation (7) might simply be used here to similarly reflect the completion pressure of the provincial RPS target.
where Mpre is the provincial completion pressure, is the newest non-hydro RPS target, and is the accommodation rate of the non-hydro renewable energy electricity for province i in 2017.
The prospect analysis based on the assessment index of completion pressure is a practical and direct way to simply find out the distance from the present circumstances to the obligated one across Mainland China. The basic change trend of RPS completion could be inferred by the estimation results and verified by the actual data in 2018. However, the fluctuation led by the newly added accommodation and the excess one led by synergism among policy portfolios are not included in this paper. Nevertheless, the estimation results of the completion pressure that is calculated from the most related actual data are rational enough to be regarded as part of the key indexes in organizing the following prospect overview.
Prospect Overview for Provincial RPS Completion
The provinces in Table 1 were sorted using Mpre in ascending order and were divided into three categories according to the completion pressure of the RPS target. Provinces in class A completed their targets at the end of 2017, including Yunnan, Ningxia, and Inner Mongolia Province. Ten provinces in class B made it relatively easy to complete, while 17 provinces in class C had to complete another 20% or more challenging rate of the RPS target before 20203.
A higher provincial RPS target means more expectations on absorbing a non-hydro renewable energy power, potentially resulting in more completion pressure. On one hand, there were a total of 10 provinces possessing an RPS target no <15%, and five of these provinces were classified as class C, and over half of them had at least a quarter of RPS completion remaining to be finished. On the other hand, most provincial targets of the provinces in classes B and C dropped or remained stable from the firstly distributed one to the newly modified one, except Beijing, Tianjin, Hebei, Jiangsu, Zhejiang, Guangdong, Liaoning, Shaanxi, Gansu, Xinjiang, and Guizhou Province. These 11 provinces, together with three provinces classified as class A, possessed either a huge electricity consumption or abundant non-hydro renewable energy resources, which probably led to their relatively high potentials and expectations for raising the assessment index of RPS completion.
Provinces in the “Three North” region were the main producers and exporters of non-hydro renewable energy power thanks to their abundant resources of wind and solar energy. These 12 provinces or regions, shown in Figure 14 ought to bear more responsibility in RPS completion under their relatively high RPS target. The provinces or regions in Figure 1 were sorted by completion pressure from left to right and top to bottom, based on summarized data from NEA (2016, 2017a), and NEA (2018d).
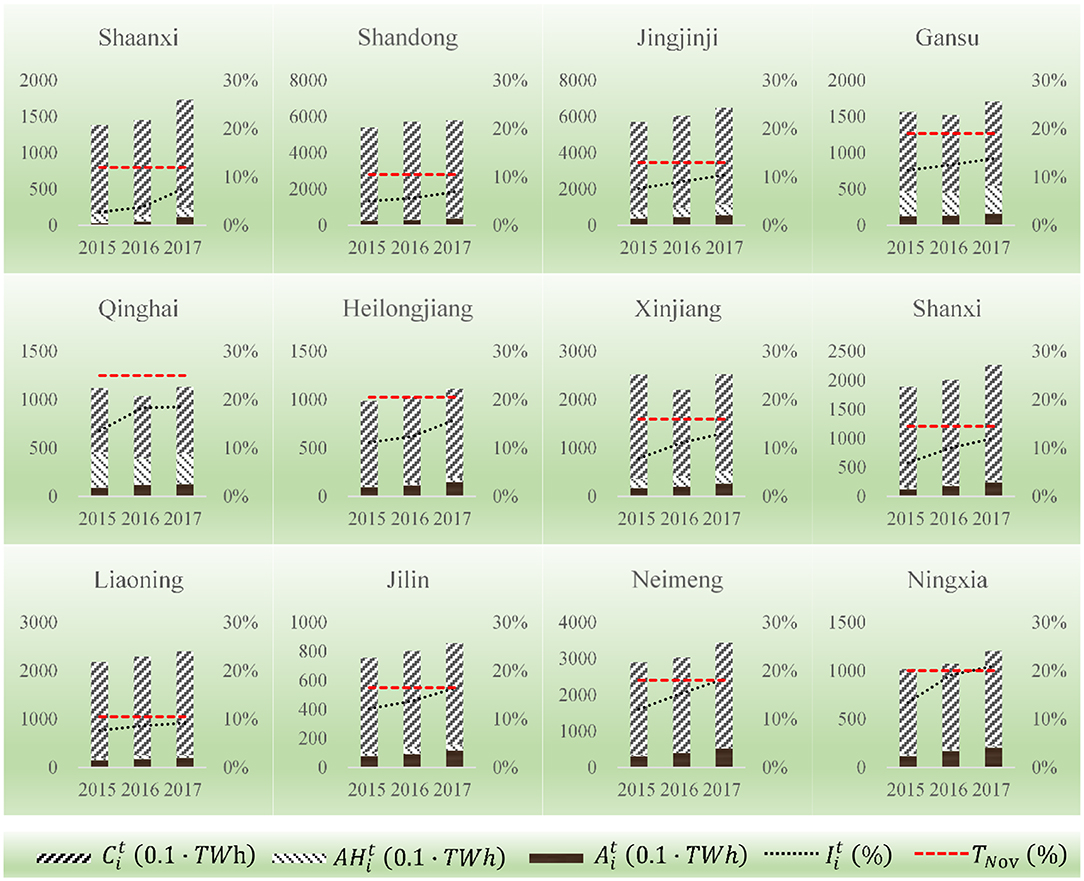
Figure 1. Evolution of the provincial accommodation rate in the “Three North” region, 2015–2017.
Higher RPS completion pressure for these provinces meant more motivation for promoting nearby accommodation inside the “Three North” region because more completion would be preferentially done by local accommodation while the export of redundant RPS completion would be less. This ought to be a more economical way for accommodation compared with long-distance trans-regional transmission. It has been proven that there remained much potential for absorbing uncertain green electricity inter-provincially or trans-regionally throughout the “Three North” region by activating nearby accommodation regardless of a saturated electricity consumption market. For instance, trans-regional accommodation between the North–West China Grid (NWCG), the North China Grid (NCG), and the North–East China Grid (NECG) totally achieved 9.64 TWh, as illustrated in Figure 2. And inter-provincial accommodation achieved 2.07 TWh among provinces in the NWCG and 5.2 TWh in NECG. Though there were still rough accommodation problems in the “Three North” region, the accommodation rate of non-hydro renewable energy power, shown as in Figure 1, had risen from 2016 to 2017, especially in Xinjiang, Ningxia, Inner Mongolia, Heilongjiang, and Jilin Provinces. However, completion pressure was quite different from each other in the “Three North” region. Whether the first five provinces illustrated in Figure 1, which were classified as class C, had more potential to achieve the RPS target through nearby accommodation remained uncertain.
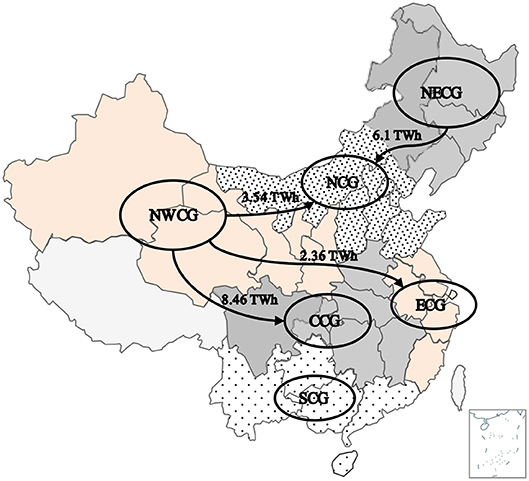
Figure 2. Trans-regional accommodation of non-hydro renewable energy power in China.
The excessively high completion pressure for provinces in the “Three North” region might reduce the supply in the trading market for RPS completion and act against a nationwide accommodation of non-hydro renewable energy power. Compared with the low increase of the provincial electricity consumption from 2015 to 2017, some provinces such as Shaanxi achieved an extremely high growth rate of accommodation amount, while provinces such as Qinghai and Gansu had a weak growth especially from 2016 to 2017. The distributed target might be too high for them. Even worse, the obvious increase of RPS completion in some provinces was more likely led by the sacrifice of hydropower, which was also green renewable energy power. A comparison between the accommodation of non-hydro renewable energy power and hydropower, illustrated as a histogram in Figure 1, also revealed this problem. It was not limited to the “Three North” region and was particularly serious in Shaanxi, Gansu, Qinghai, Guangxi, and Yunnan Provinces in 2016. The accommodation of hydropower electricity decreased by 43.8 TWh, while the total accommodation of wind and PV simultaneously increased by 16 TWh in these five provinces. Presumably, a large part of hydropower curtailment occurred in order to transfer more accommodation space for non-hydro renewable energy power thanks to excessive pressure. Yet, this over-optimistic rising data of accommodation was basically set to be a reference for further dynamic modification of the RPS target and will lead to more excessive completion pressure.
In contrast, provinces in the East China Grid (ECG) and the Central China Grid (CCG) should have played a more important role in RPS completion considering their large electricity consumption market, but the completion pressure for some of them were not motivated enough to completely develop their potentials for absorbing green power especially through trans-regional accommodation. There were six provinces in China possessing electricity consumption over 300 TWh, and five of them are located in ECG and CCG. A relatively high completion pressure is beneficial for guiding these provinces to bear more RPS obligation that is equivalent to their electricity consumption. Nearby accommodation is also preferentially encouraged, but restricted by limited nearby installation of wind or solar power. Alternatively, trans-regional accommodation should be further utilized to absorb more uncertain green power through transmission lines. For instance, trans-regional accommodation between the NWCG and CCG achieved 8.46 TWh in 2016, as illustrated in Figure 2, which only occupied 0.8% in total electricity consumption and 14.1% in total accommodation of the provinces located in CCG. The same two percentages between NWCG and ECG were 0.2% and 4.1%, which were also extremely low. On the contrary, the total export electricity of wind and PV in NWCG only achieved 14.4 TWh, merely occupying 17.7% in the total production of non-hydro renewable energy electricity. These five low percentages simultaneously revealed the fact that these provinces could enjoy a better balance between supply and demand of green power through motivating trans-regional accommodation.
Further Discussion
In 2018, the actual accommodation rate of 10 provinces exceeds their obligated targets for 2020, according to NEA (2019b). Eight of them are located in class B before. Yunnan and Ningxia Provinces are still located in class A, while Inner Mongolia declined to locate in class B. This could partially verify the rationality of the prospect analysis method proposed in this paper. The difference between the actual circumstance in 2018 and the estimated assessment results is possibly led by the impacts of parameter uncertainties. These uncertainties mainly come from the newly added accommodation gained in increasing consumption market and further accommodation of decentralized NREP.
The experience of implementing the RPS scheme in California, Japan, and Britain, is to conduct accommodation cost to end users by a compulsory TGC market and a mature electricity market. Whether responsible subjects are actively involved in RPS implementation depends on the price signal of these two markets. China has reformed its power system, but the electricity market is far from mature. Therefore, there is much more potential for RPS completion that could be developed from a market-oriented transition.
Besides, enterprises are more willing to consuming NREP either through a direct purchase or certificates subscription (Zhang and Ji, 2019). This has become a global trend due to social responsibility or customer demand (Xu et al., 2019). With future green financial tools, China will motivate more potential for absorbing green power, as illustrated in Ji and Zhang (2019) and Zhang et al. (2019). In addition, technological revolution in block chain will further remove obstacles to the certificate trade and release more completion possibility for the obligated quota (Ji et al., 2019).
Unfavorable Factors Against RPS Completion
Structural Data Analysis
The structural data analysis proposed in this paper is based on three “structures.” The structure of accommodation, the power supply structure, and the structure of provincial electricity balance. The first structure is closely related to complex components, including locally produced and accommodated NREP, a locally accommodated one but is produced outside, and the dispersedly absorbed one. The second one is about the amount and proportion data for all kinds of power suppliers, especially for thermal power units. The third one reflects detailed provincial electricity balance, including trans-provincial export or import of NREP and total power exchange, local electricity production, and consumption. All the complicated data are collectively illustrated together to directly reveal unfavorable factors against activating accommodation potential and RPS completion. The structural data analysis framework is applied to find out the data relationship hiding behind these three “structures.”
The data used in this section were collectively quoted from several yearbooks for 2015 issued by the China Electricity Council (CEC) and the National Statistical Bureau of China (NSBC). Besides, the valid data in 2015 reflected China's most common curtailment problem in recent years. The influence factors related to NREP accommodation could be either estimated in the simulation system based on unit commitment and an economic dispatch model or analyzed based on a macroscopic economic model with a detailed module of the electricity department (Li et al., 2018). The method applied in this section avoids the complicated calculation of the former and the strict economic conditions of the latter and is feasible and rational due to the close relationships among the core parameters inside the three “structures.”
Provincial Electricity Balance and Insufficient Interconnection of the Power Grid
The following subsection identifies unfavorable factors for RPS completion which hide behind the complex relationships between the structural data of electricity balance and the accommodation in 2015. Every province fulfills its electricity balance by consuming electricity that is generated locally or imported outside. The provincial electricity balance, together with the structural parameters of accommodation and generation, are listed as Equations (8–10).
where is the total provincial electricity generated locally; is the final imported or exported electricity outside a province (it is set to be negative if the province finally exported power); is the provincial electricity consumption; is the provincial accommodation of non-hydro renewable energy power; is the locally generated and absorbed part of accommodation; is the imported part of accommodation (it is also set to be negative if the province finally exported non-hydro renewable energy power); and , , and , respectively, refer to the locally generated electricity from non-hydro renewable energy power, hydropower, and thermal power.
It is well-known that the development of the electricity industry in China is strictly plan-oriented. At present, nearly all provinces across Mainland China have published their provincial 13th 5-Year Plan (FYP) not only for the development of the electricity industry but also for the utilization of renewable energy. As the first year of the 13th FYP, 2015 was chosen to be the representative year, with its structural data illustrated in Table 2 in this paper. Provinces were sorted by the amount of .
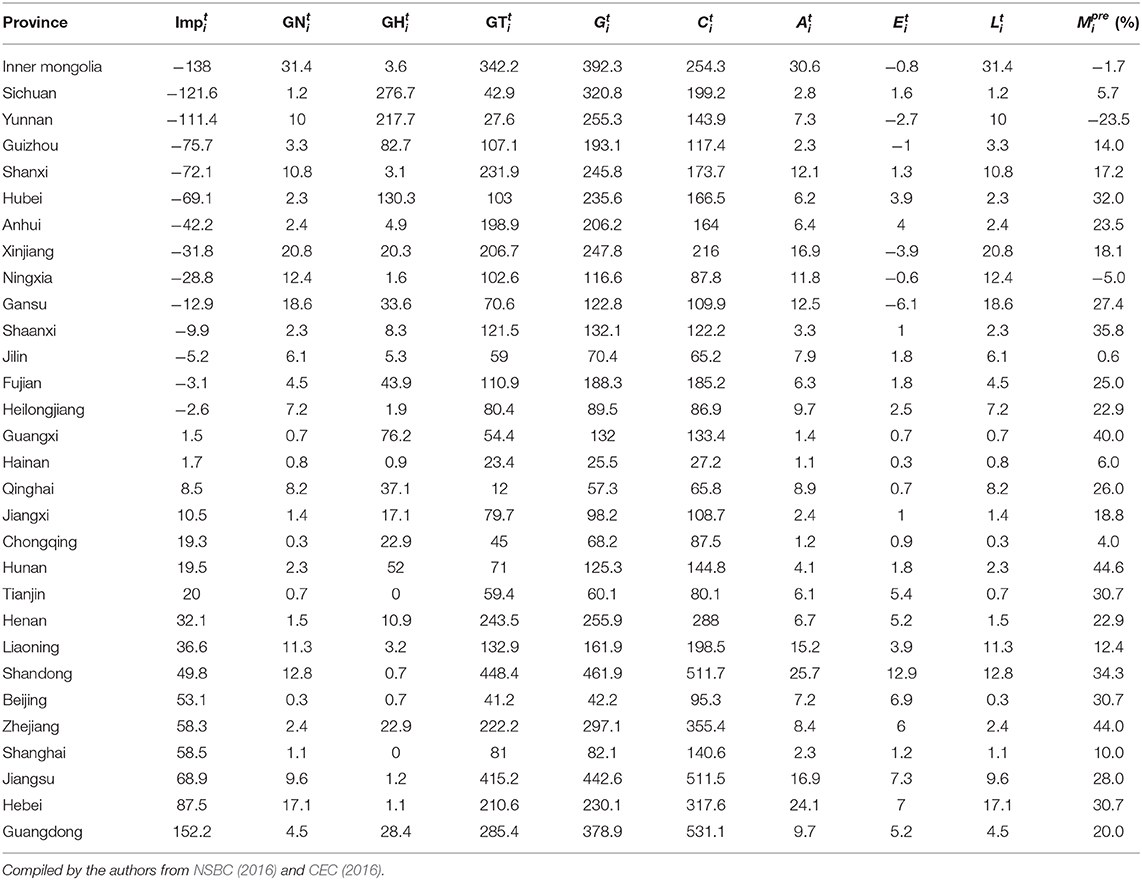
Table 2. Structural data of the provincial electricity balance and accommodation, 2015.
Nearly every province exports locally generated power to others and meanwhile imports power outside to flexibly achieve a real-time power balance and electricity balance. Among those 30 provinces across Mainland China, there were 14 provinces finally exporting power to others and 16 provinces finally importing power from others in 2015.
The relationships between and , concluded from Table 2, showed that not all provinces which finally exported power to others simultaneously possessed export of non-hydro renewable energy power. It was assumed that locally generated electricity was preferentially accommodated so that the column illustrated as was set to be the same as . Only five provinces which are famous for their rapid development of centralized PV and wind power stations finally exported non-hydro renewable energy power when exporting electricity to others. The final in the other nine exporting provinces was more probably occupied by hydropower and thermal power. As for those 16 importing provinces, another relationship was illustrated from Table 2 that all provinces which finally imported power from others simultaneously possessed some but extremely little import for non-hydro renewable energy power.
Notably, the amount of total import of non-hydro renewable energy electricity was far more than that of the total export shown as in Table 2, which was away from the realistic balance of supply and demand in the inter-provincial or trans-regional trading market for green electricity. In fact, there was another important part which should also be contained in yet not being assessed in this section. It is usually the accommodation of electricity generated by a distributed system of PV or wind power. The amounts in the column illustrated as in Table 2 were far lower than the realistic ones due to the absent electricity generated by distributed solar or wind power station. However, two basic relationships illustrated in the previous paragraph were still reasonable, though the absent calculations of distributed systems, the effects from absent four provinces of China, and the international export or import were not assessed. These two relationships between the structural data of electricity balance and accommodation revealed a tough circumstance that neither the supply side nor the demand side of the inter-provincial or trans-regional electricity trading market had a high proportion of NREP.
Once the RPS was strictly implemented, it would be another structure of electricity balance and decomposition of accommodation, where and rose before a new balance between , , and formed, especially in those provinces with high completion pressure no matter they finally exported or imported electricity. More provinces classified in class B would be likely to complete their RPS target and then become suppliers of surplus RPS completion. By then, the total supply of RPS completion, which was calculated by the electricity consumption and RPS target of the provinces that had completed their targets, would be enough to support a sustainable trading market.
However, several obstacles must be overcome in the way provinces are improving conditions for completing RPS.
NREP installations in China were concentrated in the “Three North” region, large in scale, far away from the load center, and difficult to be locally absorbed, while NREP installations in Europe, America, and other countries were dispersedly distributed and absorbed nearby. Transmitting green power generated from the “Three North” region to the load center seemed to be one of the few available alternatives for China to improve tough accommodation. Yet, neither the technological delivering capacity of the trans-regional transmission lines nor the benefits distribution between the importing and the exporting provinces of green electricity transaction was ideal.
The total trans-regional power transmission capacity had achieved 93.42 million kW till the end of 2018, merely accounting for 26% of the total installed capacity of PV and wind power, which was far from enough in contrast to the rapid development of arranged PV and wind power bases in recent years. As a comparison, the transmission capacity between Denmark, Norway, Sweden, and other countries was 1.6 times the domestic wind power installations, and Portugal connected more than a half of the installed capacity of NREP to neighboring countries. Long-distance transmission was mainly supported by ultra-high-voltage (UHV) transmission lines in China. The following eight UHV alternative current (UHVAC) and 13 UHV direct current (UHVDC) transmission lines listed in Table S1 in the Supplementary Material available online and in Figure 3 were also the backbone channel of the nationwide power grid. Nevertheless, only four lines were designed to transmit NREP; three lines had been approved for auxiliary power suppliers generated from wind or PV. Only two of them, illustrated as No. 13 and No. 15 in Table S2, had a reasonable transmission proportion of NREP (near 30%) on the limited technological conditions that an uncertain power output of PV and wind installations could not be solely delivered. Even worse, these lines had to undertake the external power transmission task of the coal-fired power generation bases, which further compressed the conveying space of NREP. In a word, limited trans-provincial or trans-regional transmission capacity determined the insufficient interconnection of the power grid, and even low capacity for delivering NREP restricted nationwide accommodation.
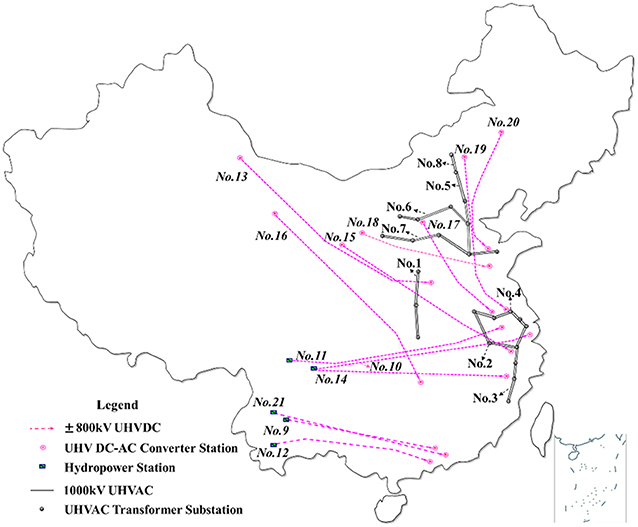
Figure 3. Distribution map of the completed eight ultra-high-voltage alternative current (UHVAC) and 13 ultra-high-voltage direct current (UHVDC) transmission lines (Shu and Chen, 2018).
The receiving province of the trans-regional or inter-provincial transmission toward green power had to compress the generating space of local power suppliers thanks to the non-adjustable and plan-oriented output of importing power. And the price of a long-distance import of green power was usually more expensive than the local ones. It was not economically motivated enough for receiving provinces to agree on the transactions, unless the economic compensation mechanism was reasonable. Inter-provincial barriers still existed in China, while Europe has formed a unified electricity market. This compensation mechanism was harder for China to design mostly due to the low marketization degree of the electricity market.
Provincial Power Supply Structure and Limited Flexibility of the Supply Side
With high penetration of NREP integrated, the randomness and fluctuation of its output increase the burden of peak regulation, and more flexibility of the power system is required. Conventional power suppliers not only need to follow the load changes but also need to flexibly balance the output fluctuation of PV and wind power. When the power output of NREP exceeds the regulation range of the power system, the output must be controlled to ensure a dynamic balance, resulting in the curtailment of PV and wind power. Yet, not only the lack of flexible regulated power supplies and the limited flexibility of the conventional power units, especially those coal-fired units, but also the negative participation of captive power plants in peak regulation, made the power system in China inflexible to accommodate more NREP, which was to the disadvantage of completing the RPS target.
China's power supply structure is still dominated by coal-fired power, especially in the “Three North” region. The average national proportion of flexible regulated power supplies, such as pumped storage and gas-fired power, is only 6%, while the inflexible thermal units account for over 70%. Table S2 illustrated the proportion of flexible unit in a power supply structure in the “Three North” region, which was far lower than that of Spain, Germany, America, and Portugal.
The peak regulation task of the power system is also mainly undertaken by thermal power in China. Unfortunately, the coal-fired units, which account for the majority in thermal power throughout China, are too inflexible to undertake the task of peak regulation due to the less adjustable load range, lower climbing rate, and longer start–stop time compared with flexible units. Generally, the minimum technical output of units above 0.3 GW usually lies between 40 and 50 % of the rated capacity, while the same index of units below 0.1 GW lies over 80% in China. Table S3 lists the adjustable load range of different coal-fired units, among which a 600-MW unit and a 1,000-MW unit had a relatively high adjustable range. The type of thermal power was mainly covered by 300 to 1,000-MW units in most provinces, as illustrated in Table S4. However, some provinces still possessed a high proportion of units below 300 MW, such as Shandong, Xinjiang, and Hainan Provinces. The more restricted flexibility of units in these three provinces partially contributed to their low increase of accommodation toward NREP. Hence, raising the peak regulation capability of the coal-fired units is a feasible though uneconomical way of meeting the pressing need of system flexibility in China, which means the deeper peak regulation coal-fired units participated, the more accommodation reserved for non-hydro renewable energy power.
The installed capacity of thermal power in most provinces in 2015, which was much more than the maximum load of power generation, as illustrated in Table S4, was relatively excessive considering the weak growth expectations of electricity consumption during the 13th FYP (Zhao et al., 2017). The redundant coal-fired power units in those red-warning provinces shaded in Table S4 had pressed the generation space of PV and wind power (NEA, 2017b)5. Besides, limited regulation performance of thermal power, which occupied the power supply structure, affected the flexibility of the power system and further restricted the accommodation of uncertain green power. In contrast, provinces where thermal power was not the leading power supplier, such as Hubei, Hunan, Sichuan, Qinghai, and Yunnan, either possessed a high increasing rate of accommodation or a high increasing percentage of accommodation rate, as illustrated in Table 1, partially revealing the relationship between the completion conditions of RPS and the provincial power supply structure.
Particularly, heating units, also known as cogeneration units or combined heat and power (CHP), were usually not used as the peak regulation power supplier because they had to meet the heating load demand while producing electric power, which further restricted their regulation performance. For instance, when the heating load gradually increased, a 300-MW CHP unit enlarged the capacity of suction; consequently, the minimum technical output rose while the maximum technical output dropped, and its adjustable load range varied from 51.1 to 7.1%, lower than that of the non-cogeneration units listed in Table S3. However, heating units accounted for an enormous share of thermal power, especially in the “Three North” region. There are nine provinces listed in Table S4 where the proportion of heating units was above 50%, and eight of them came from the “Three North” region. These heating units had to take part in peak regulation thanks to conflicts between the limited adjustable load range and the incremental demand of accommodation. Huge curtailment of wind power occurred when the strong wind period overlapped with the heating period during the winter and spring. Those representative provinces, including Gansu, Heilongjiang, Liaoning, Jilin, Hebei, Tianjin, Shandong, and Shanxi, must improve the limited adjustable load range of heating units to accommodate more green power and speed up RPS completion.
Whether the captive power plants participated in peak regulation makes a difference to the system flexibility as well. The most captive power plants belonged to high-electricity-consuming enterprises. They supplied power to “selfishly” meet their own relatively fixed load and did not join the unified peak regulation of the power system. It could be inferred from Table S5 that the rising installed capacity and power generation of captive power plants had forced public power plants and non-hydro renewable energy power suppliers to further press their power output. This was another obstacle for speeding up RPS completion, especially in Xinjiang, Shandong, Gansu, Ningxia, Inner Mongolia, Heilongjiang, and Liaoning.
The limited flexibility of the power system is not only closely related to the provincial power supply structure but is also influenced by the marketization degree of the electricity market. China is still dominated by a traditional plan-oriented management of power generation and utilization, and the economical compensation mechanism for auxiliary services of peak regulation and frequency modulation is not perfect. In contrast, Europe has established a market-oriented mechanism that is conducive to mobilizing the flexible regulation of power supply and active response of the demand side to participate in peak regulation. More accompanying measures are needed to match the implementation of RPS and create a better condition for RPS completion. These measures, which cover the supply side, grid side, together with the demand side of the power system, containing but not limited to those that have been adopted during the past 4 years, were empirically analyzed in the following section.
Practical Experience From China
Activating Flexibility of the Supply Side
Flexibility Modification of Thermal Power Units
Flexibility modification means the minimum operation mode and minimum technical output of thermal power units approved by the government must be strictly implemented to optimize startup arrangement and accommodate more green power. It was especially suitable for those provinces where the power supply structure was mainly occupied by thermal power and was proven to be a feasible measure to maximize peak regulation capacity. For example, thermal power in NECG operated on the minimum technical output in 2016; 6.372 billion kWh of wind power was additionally absorbed. Seven provinces, including Liaoning and Jilin, had completed the preliminary work till the end of 2017. A total of 26 units had completed flexibility modification, and 930 million kWh of non-hydro renewable energy electricity was additionally absorbed by the end of 2017. Minimum output of thermal power could further drop and the adjustable load range would be further enlarged when mature technology in deep peak regulation was applied in more power units.
Strictly controlling the startup mode and power output of CHP units according to the minimum operation mode has been particularly implemented in some provinces. For instance, Jilin Province relied on the “peak-load character management system of thermoelectricity unit” to timely monitor heating information in real time, dynamically calculate the peak regulation capacity, and arrange units to participate to the furthest in deep peak regulation. This model could be popularized in NC and NEC, where the heating load demand was enormous in winter.
Thermoelectric decoupling of CHP units was proven to be another effective measure especially in those provinces which possessed huge installations of heating units. The adjustable load range of CHP units would be extended mainly through four methods, which are equipment of heat storage tank, installation of electric heat storage boiler, cooling and decompression of main steams, and integration of the pumping condensation unit and back pressure unit. The first two measures were relatively mature and had been widely adopted abroad, which could be promoted and applied in China. It should be selected according to the heating requirements of power plants and characteristics of the power system (Pei et al., 2017).
Substitution Trade Toward Captive Power Plants
Substitution trade between NREP suppliers and captive power plants was an effective measure before the unified peak regulation management was fully developed. The substitution electricity in Shaanxi, Gansu, Qinghai, Ningxia, and Xinjiang achieved 390 million kWh, 1.89 billion kWh, 540 million kWh, 1.22 billion kWh, and 7.9 billion kWh, respectively, in 2016. This measure could be similarly applied in Shandong, Inner Mongolia, Heilongjiang, and Liaoning Provinces, which also possessed a huge installed capacity and proportion of captive power plants. Once the unified peak regulation management was completely established, the supplementary adjustable capacity of captive power plants would further raise the peak regulation capability of the supply side.
Unified Planning of Power Generation
Unified planning of power generation is a feasible yet not adopted measure aiming to optimize the distribution and guide the construction of NREP projects in an orderly manner and make room for the accommodation of uncertain green power by strictly controlling new coal-fired power in the provinces regulated by the CCG and ECG.
Enhancing Interconnection of Power Grid
Timely Construction of Provincial Supporting Power Grid
The approval of power grid projects usually lags that of non-hydro renewable energy projects; thus, there was a lack of supporting grid project during the rapid development of PV and wind power bases these years, which leads to a less timely integration of uncertain green power. Consequently, timely construction of provincial supporting power grid was an effective measure toward those provinces where PV or wind power far away from the grid center could not be timely connected to the power grid. For instance, Qinghai had speeded up the resolution of the cross-section restriction caused by the lagging construction of the collection and delivery lines in regions where wind resources are rich. Xinjiang had also increased its delivery capacity by 5 million kW through the operation of a new inter-provincial transmission channel in 2017. Shanxi also alleviated the blockage of wind power, reducing curtailment by 400 million kWh in 2017. Till now, the structure of the inter-provincial power grid has been greatly improved and is friendlier to the integration of NREP. This ongoing measure will sequentially optimize and intellectualize the provincial power grid to face more challenges led by the higher penetration of PV and wind power.
Further Improvement of Inter-provincial Transmission Channels
Inter-provincial transmission is one of the available alternatives for enlarging the configuration range of non-hydro renewable energy power, which contributes to regional accommodation. It is easier for neighboring provinces in the same region to connect with each other than trans-regional ones. Therefore, the orderly construction of inter-provincial transmission channels had become a relatively feasible and effective measure for absorbing more green power. For instance, the total amount of inter-provincial transaction of PV and wind power achieved 49.2 billion kWh in 2017, and the “Three North” region increased accommodation for 6.19 billion kWh through this measure. This measure was proven to be especially suitable for the regional power grid, where inside provinces could integrate their advantages both in adjacent locations and complementary characters in regulation performance, and should be further continued to achieve a more stable structure of the regional electricity balance so that more uncertain green power could be regionally absorbed.
Full Utilization of Trans-regional UHV Transmission Lines
It has been proven that trans-regional UHV transmission could resolve curtailment problems in the “Three North” region, to some extent. For instance, the No. 13 line, listed in Table S1, transmitted 32.26 billion kWh electricity in 2016, of which 7.34 billion was from non-hydro renewable energy, accounting for 23% of the total. The external power supply of the No. 15 line was 7.28 billion kWh in 2016, of which 2.08 billion kWh was from wind power, accounting for 29% of the total. Since the No. 16 line was put into operation in June 2017, more than 2 billion kWh of non-hydro renewable energy power had been delivered. China had built eight UHVAC and 13 UHVDC transmission lines across China, yet these trans-regional channels were not fully utilized corresponding to their transmission capacity. Other existing UHV transmission lines similarly had much room for the effective allocation of NREP and remained to be further developed, and more trans-regional UHV transmission lines used for specially transmitting NREP in the “Three North” region should be timely built and put into operation considering the distribution map, illustrated as Figure 3.
Enlarging Accommodation Market of the Demand Side
The demand side of the power system determines the maximum limit of the accommodation market. Enlarging the overall scale of the electricity consumption market and increasing the accommodation rate of non-hydro renewable energy power are the basic ways for the realization of RPS. The growth of power demand was slowing down in recent years, while various types of power generators, including non-hydro renewable energy sources, maintained a rapid growth. The more non-hydro renewable energy power accommodated in additional consumptive market, the earlier the RPS target will be completed.
Electric power substitution was proven to be effective in lessening the apparent imbalance between power supply and demand. It was comprehensively carried out in China by separately increasing the electricity consumption on the condition that the newly added electricity market could not support the requirement of accommodation. In 2016, 41,000 key projects of electric power substitution, including electric heating, electric kiln, port shore power, and APU alternative on airport bridges, were implemented, and 103 billion kWh of substitution electricity was completed. In 2017, 115 billion kWh of substitution electricity was completed. With this measure, Xinjiang, Sichuan, and Hebei increased accommodation for 7.9 billion kWh, 1.49 billion kWh, and 47.3 million kWh, respectively, by encouraging PV or wind power suppliers to directly trade with electricity consumers point to point. Gansu had set up a trading platform which offered timely information about electric power supply and demand, so that non-hydro renewable energy power generation enterprises, electric boiler enterprises, and electric heating residential districts could build a closer relationship. This mode could also be applied to other provinces where the heating demand in the winter was stable and the regulation performance was relatively flexible for supporting electric heating by uncertain green power.
Power users should have the market-oriented option of purchasing non-hydro renewable energy power across provinces, either via a trans-regional spot market or through an improved trading system that focuses on medium- or long-term trading and supplementary electricity trading. The market rules and non-hydro renewable energy power trading mechanism should be improved as soon as possible during the construction of a unified national electricity market. Enterprise and an individual's social responsibility and enthusiasm should be improved and encouraged to change the way in using power. Terminal energy efficiency should be improved mainly by introducing an active response, interruptible load control, or other forms of demand side management (DSM). DSM measures also contribute to the overall flexibility of the power system and could be further implemented by market reform (including pricing mechanism reform, in particular).
Strengthening the Core Position of Power Grid Corporations
Power grid corporations should not only bear the responsibility of implementing RPS in their business areas and assisting the government in formulating plans but also act as a technical supporter to assist in determining RPS distribution. Meanwhile, their power supply companies must bear the obligations of completing RPS. As mentioned above, there were a sea of troubles during the implementation of RPS completion in China, mainly due to characteristics in contradiction between the centralized development and provincial accommodation of NREP, limited flexibility of the power system, and the low marketization degree of the electricity market. Consequently, this powerful plan-oriented policy urgently needed a strong executive organizer and an experienced technical supporter. The power grid corporation happened to be a combination of the two mainly due to its centralized management mode, comprehensive data support, and mature technology accumulation, which decided its core position not only in implementing RPS but also in creating better conditions for RPS completion.
Power dispatching is the core work of power grid corporations; optimal dispatching aims to maximize the generating space for uncertain NREP based on the current peak regulation capability under the premise of ensuring a safe and reliable power supply, which is a direct way to tap potentials for RPS completion.
For those provinces with huge installations of PV and wind power in the “Three North” region, more dispatching technologies could be intellectually integrated in the provincial dispatching system to positively maximize the local accommodation of uncertain green power without a huge improvement in provincial peak regulation capability. For instance, Ningxia, Gansu, and Qinghai Provinces used a coordinated and intelligent operation control system, incorporating formulation of power generation, prediction of power output, and implementation of automatic gain control (AGC) into a closed-loop management to adjust the output of thermal power in time, which promoted the consumption of NREP. For those provinces which possessed huge installations of hydropower, the dispatching system could be further improved to achieve a smooth and stable power generation curve since the hydropower station could be used to track uncertain power output and complementarily adjust active power output relying on the rapid response of hydro-turbine and adjustment capability of reservoirs. For those provinces which lack the peak regulation capacity, signing an inter-provincial mutual aid contract of peak regulation could be a complementary measure. Under this agreement, one provincial power grid corporation was obligated to provide daily peak regulation power or electricity to help the other one supplement the absent capacity in peak regulation. With this measure, NECG and NWCG had increased accommodation of non-hydro renewable energy electricity for 1.15 and 8.59 billion kWh, respectively, till the end of 2016.
Organization of electricity transactions is another important work for power grid corporations in China. More active participation in inter-provincial or trans-regional electricity transactions uniformly organized by the electricity trade center of power grid corporations also contributes to speeding up RPS completion. Those measures taken on the grid side were also mainly fulfilled by power grid corporations, which had invested, constructed, and possessed huge power grid assets.
Coordinating Market-Based Mechanism With Plan-Oriented RPS
Judging from the implementation of RPS in other countries, it is extremely important to establish a clearly regulated green certificate trading market for successfully realizing the RPS target. The successful operation of the green electricity trading market requires the government to clearly designate the obligor and the regulatory agency, and the regulatory agency should design clear trading rules such as trading times, storage time limit, and rewards and punishments according to the characteristics of the electricity market. The government should have the ability to regulate the certificate market, especially the means to mediate between the supply and demand of certificates.
China had already done fruitful work not only in the design and distribution of RPS but also in the exploration of market-oriented mechanism. Market-oriented mechanism here mainly referred to TGC or other forms of transaction for RPS completion, which was another direct way to raising the assessment index of RPS and supplemented all measures taken from the three sides of the power system. According to the notice promulgated in November 2018, the market-oriented mechanism in China was going to be implemented from 1 January 2019, but a green certificate would not be solely involved in the assessment. Both a directly purchased RPS completion from overfulfilled provinces and a calculated one corresponding to purchased tradable green certificates could be assessed as RPS completion. This market-oriented mechanism with Chinese characteristics was expected to reduce the overlapping of the policies and seems easier to operate, but the implementation effect would not be guaranteed considering facts that the TGC was provided to be purchased voluntarily while the economic punishment of RPS and detailed incentive scheme were not clearly announced. There remained somewhere to be further improved toward this core accompanying market-oriented mechanism of RPS in China in order to accelerate the true implementation of TGC or RPS completion trading market. It was important for the successful implementation of RPS in China to coordinate the activation of a market-oriented mechanism with the execution of a plan-oriented policy.
Not only do TGC or other forms of transaction for RPS completion need coordination, but also many other market-oriented mechanisms which accompany measures taken on the supply side, grid side, and demand side of the power system need to coordinate with this plan-oriented policy. A nationwide peak regulation auxiliary service market should be further improved to economically motivate active participation in peak regulation. A compensation mechanism between the importing and exporting provinces of NREP should also be established to effectively break down the inter-provincial barriers for accommodation.
Conclusions
Inevitably, the implementation of China's newly modified provincial RPS will maintain a significant role in energy revolution to provide more than half of the electricity from renewables. Although China has achieved certain progress in the mechanism design and target distribution, great challenges remain not only in further improvement of the completion conditions but also their effective implementation.
This paper focuses on the completion prospect of a new provincial renewable portfolio standard in 30 provincial administrative regions across Mainland China. The prospect analysis specifically introduces a newly modified demand side-based assessment mechanism toward both a single responsible subject and the overall province and then proposes a prospect analysis framework based on an assessment index of the completion pressure. The estimation results indicate that 17 provinces now enjoy an extremely high completion pressure while 10 provinces make it relatively easy to complete, which are partially verified by the actual data in 2018. Unfavorable factors for raising the assessment index are revealed from the structural data analysis on the provincial electricity balance and power supply structure. These factors can be mainly summarized into the contradiction between the centralized development and provincial accommodation of NREP, the limited flexibility of the power system, and the low marketization of the electricity market. However, a greater completion potential could be acquired by the active introduction of systematical measures. This paper empirically analyzes these measures taken from three sides of the power system, which mainly aims to develop a nationwide and provincial flexible power system either by activating the regulation performance of power units from the supply side, enlarging the configuration range of green power accommodation via a more sufficiently interconnected power grid, or by guiding active response and interruptible load control from the demand side. Meanwhile, the unique pathway for ensuring an effective RPS implementation in China simultaneously highlights the accompanying market-based mechanism and core position of power grid corporations. Both introducing a more market-based mechanism to coordinate with a plan-oriented RPS and encouraging the provincial power grid corporation to bear the core responsibility of not only improving the completion conditions of RPS but also in leading, organizing, assessing, and regulating responsible subjects will contribute more in the future implementation of RPS.
Data Availability Statement
Publicly available datasets were analyzed in this study. This data can be found here: http://zfxxgk.nea.gov.cn/auto87/201803/t20180323_3131.htm, http://www.nea.gov.cn/2018-11/15/c_137607356.htm, http://zfxxgk.nea.gov.cn/auto87/201608/t20160823_2289.htm, http://zfxxgk.nea.gov.cn/auto87/201704/t20170418_2773.htm, http://zfxxgk.nea.gov.cn/auto87/201805/t20180522_3179.htm.
Disclosure
Frontiers Media Ltd. remains neutral with regard to jurisdictional claims in published maps and institutional affiliations.
Author Contributions
YB collected the research data and wrote the total paper. XZ revised the paper and gave several suggestions.
Funding
This work was completed by National Social Science Fund of China (Grant No. 15ZDB165).
Conflict of Interest
The authors declare that the research was conducted in the absence of any commercial or financial relationships that could be construed as a potential conflict of interest.
Acknowledgments
The authors would like to thank the referees and the editor of this journal. The authors also gratefully acknowledge the financial support of the Major Program of the National Social Science Fund of China (Grant No. 15ZDB165).
Supplementary Material
The Supplementary Material for this article can be found online at: https://www.frontiersin.org/articles/10.3389/fenrg.2020.00059/full#supplementary-material
Footnotes
1. ^RPS completion and the related parameters used in all equations were all non-hydro ones by default, and hydropower was not assessed unless separately mentioned in this paper.
2. ^The report for 2019 is not yet published.
3. ^The boundary value between classes B and C was set to be 20% considering the stipulation that the regulated monitoring and evaluation will be removed when the overall assessment index (including hydropower) exceeds 80% of the target (NEA, 2018c). Thus, it was more challenging for the non-hydro one to exceed this level.
4. ^Specially, Figure 1 used “Jingjinji” to represent Beijing–Tianjin–Hebei region because Beijing, Tianjin, and Hebei Province possessed the same RPS target and were set to be an integral region when involved in RPS assessment. is the provincial accommodation amount of hydropower.
5. ^The installation of coal-fired units in red-warning provinces is quite redundant considering the provincial reasonable system reserve rate.
References
Bento, A. M., Garg, T., and Kaffine, D. (2018). Emissions reductions or green booms? general equilibrium effects of a renewable portfolio standard. J. Environ. Econ. Manage. 90, 78–100. doi: 10.1016/j.jeem.2018.05.006
CEC (2016). [In Chinese]. China Electric Power Industry Statistical Yearbook 2015. Beijing: China Electricity Council.
Chen, X., Mcelroy, M. B., Wu, Q., Shu, Y., and Xue, Y. (2018). Transition towards higher penetration of renewables: an overview of interlinked technical, environmental and socio-economic challenges. J. Mod. Pow. Syst. Clean Energy 7, 1–8. doi: 10.1007/s40565-018-0438-9
Feng, T., Yang, Y., and Yang, Y. (2018). What will happen to the power supply structure and CO2 emissions reduction when TGC meets CET in the electricity market in China? Renew. Sustain. Energy Rev. 92, 121–132. doi: 10.1016/j.rser.2018.04.079
He, Y., Xu, Y., Pang, Y., Tian, H., and Wu, R. (2016). A regulatory policy to promote renewable energy consumption in China: review and future evolutionary path. Renew. Energy 89, 695–705. doi: 10.1016/j.renene.2015.12.047
Ji, Q., Li, J. P., and Sun, X. L. (2019). New challenge and research development in global energy financialization. Emerg. Mark. Finance Trade 55, 2669–2672. doi: 10.1080/1540496X.2019.1636588
Ji, Q., and Zhang, D. Y. (2019). How much does financial development contribute to renewable energy growth and upgrading of energy structure in China? Energy Policy 128, 114–124. doi: 10.1016/j.enpol.2018.12.047
Li, W., Liu, L., Zhang, S., and Zhang, H. (2018). Will the tradable green certifications and renewable portfolio standard policy work well in China: a recursive CGE analysis. J. Renew. Sustain. Energy 10:055904. doi: 10.1063/1.5019756
NEA (2016). [In Chinese]. Report on the Monitoring and Evaluation of National Renewable Energy and Electricity Development in 2015[EB/OL]. Available online at: http://zfxxgk.nea.gov.cn/auto87/201608/t20160823_2289.htm
NEA (2017a). [In Chinese]. Report on the Monitoring and Evaluation of National Renewable Energy and Electricity Development in 2016[EB/OL]. Available online at: http://zfxxgk.nea.gov.cn/auto87/201704/t20170418_2773.htm
NEA (2017b). [In Chinese]. Notice on Issuing Early Warning of Coal and Electricity Planning and Construction Risks in 2020[EB/OL]. Available online at: http://zfxxgk.nea.gov.cn/auto84/201705/t20170510_2785.htm
NEA (2018a). [In Chinese]. Notice on Soliciting Opinions of Renewable Portfolio Standard and Assessment Measures. Available online at: http://zfxxgk.nea.gov.cn/auto87/201803/t20180323_3131.htm
NEA (2018b). [In Chinese]. Notice on Soliciting Opinions of Renewable Portfolio Standard and Assessment Measures. Available online at: http://huanbao.bjx.com.cn/news/20180926/930338-2.shtml
NEA (2018c). [In Chinese]. Notice on Trial Implementation of Renewable Portfolio Standard and Assessment Measures. Available online at: http://www.nea.gov.cn/2018-11/15/c_137607356.htm
NEA (2018d). [In Chinese]. Report on the Monitoring and Evaluation of National Renewable Energy and Electricity Development in 2017[EB/OL]. Available online at: http://zfxxgk.nea.gov.cn/auto87/201805/t20180522_3179.htm
NEA (2019a). [In Chinese]. Notice on Guarantee Mechanism of Renewable Energy Power Accommodation. Available online at: http://zfxxgk.nea.gov.cn/auto87/201905/t20190515_3662.htm
NEA (2019b). [In Chinese]. Report on the Monitoring and Evaluation of National Renewable Energy and Electricity Development in 2018[EB/OL]. Available online at: http://zfxxgk.nea.gov.cn/auto87/201906/t20190610_3673.htm
Pei, Z., Wang, X., Dong, C., Xing, Y., and Liang, Z. (2017). [In Chinese]. Analysis of impact of CHP plant on renewable energy accommodation in Northeast China and thermoelectric decoupling measures. Pow. Syst. Technol. 41, 1786–1792. doi: 10.13335/j.1000-3673.pst.2016.2178
Rouhani, O. M., Niemeier, D., Gao, H. O., and Bel, G. (2016). Cost-benefit analysis of various California renewable portfolio standard targets: is a 33% RPS optimal? Renew. Sustain. Energy Rev. 62, 1122–1132. doi: 10.1016/j.rser.2016.05.049
Shu, Y., and Chen, W. (2018). Research and application of UHV power transmission in China. High Volt. 3, 1–13. doi: 10.1049/hve.2018.0003
Xu, X. F., Wei, Z. F., Ji, Q., Wang, C., and Gao, G. (2019). Global renewable energy development: influencing factors, trend predictions and countermeasures. Resour. Policy 63:101470. doi: 10.1016/j.resourpol.2019.101470
Yoon, J., and Sim, K. (2015). Why is South Korea's renewable energy policy failing? a qualitative evaluation. Energy Policy 86, 369–379. doi: 10.1016/j.enpol.2015.07.020
Zhang, D. Y., and Ji, Q. (2019). Energy finance: frontiers and future development. Energy Econ. 83, 290–292. doi: 10.1016/j.eneco.2019.07.003
Zhang, D. Y., Zhao, R., and Ji, Q. (2019). Green innovation and firm performance: evidence from listed companies in China. Resour. Conserv. Recycl. 144, 48–55. doi: 10.1016/j.resconrec.2019.01.023
Zhang, Q., Wang, G., Li, Y., Li, H., McLellan, B., and Chen, S. (2018). Substitution effect of renewable portfolio standards and renewable energy certificate trading for feed-in tariff. Appl. Energy 227, 426–435. doi: 10.1016/j.apenergy.2017.07.118
Zhang, Y. Z., Zhao, X. G., Ren, L. Z., and Yi, Z. (2017). The development of the renewable energy power industry under feed-in tariff and renewable portfolio standard: a case study of China"s wind power industry. J. Clean. Prod. 168, 1262–1276. doi: 10.1016/j.jclepro.2017.09.102
Zhao, C. R., Zhang, W. R., Wang, Y., Liu, Q., Guo, J., Xiong, M., et al. (2017). The economics of coal power generation in China. Energy Policy 105, 1–9. doi: 10.1016/j.enpol.2017.02.020
Keywords: renewable portfolio standard, renewable energy, accommodation, prospect analysis, structural data analysis
Citation: Bu Y and Zhang X (2020) The Prospect of New Provincial Renewable Portfolio Standard in China Based on Structural Data Analysis. Front. Energy Res. 8:59. doi: 10.3389/fenrg.2020.00059
Received: 20 January 2020; Accepted: 26 March 2020;
Published: 28 April 2020.
Edited by:
Qiang Ji, Institutes of Science and Development (CAS), ChinaReviewed by:
Ming Zhang, China University of Mining and Technology, ChinaXu Tang, China University of Petroleum, China
Bai-Chen Xie, Tianjin University, China
Copyright © 2020 Bu and Zhang. This is an open-access article distributed under the terms of the Creative Commons Attribution License (CC BY). The use, distribution or reproduction in other forums is permitted, provided the original author(s) and the copyright owner(s) are credited and that the original publication in this journal is cited, in accordance with accepted academic practice. No use, distribution or reproduction is permitted which does not comply with these terms.
*Correspondence: Xingping Zhang, enhwQG5jZXB1LmVkdS5jbg==